3rd standard deviation of Vwap is up at 50.25 and key number so looking for shorts up here now...another report in 12 minutes risks a spike up into 1355 which is the R1 level off the weekly numbers
charts coming
BR
BruceM
Rep: 216,211
Posts: 19,895
very little to work with but hopefully something will change before the RTH session opens..here is a video that covers some area I'm watching
BR
BruceM
Rep: 216,211
Posts: 19,895
Paul,
Not sure if you are here today but I reviewed your notes and chart from yesterday and I can honestly say that I do not know if these formations form a floor as u mention . It certainly is a great observation and I'll be watching for that over time to see what repeats. Thanks for that.
Not sure if you are here today but I reviewed your notes and chart from yesterday and I can honestly say that I do not know if these formations form a floor as u mention . It certainly is a great observation and I'll be watching for that over time to see what repeats. Thanks for that.
PA
PAUL9
Rep: 14,898
Posts: 1,170
Bruce, I am here right now, (but I usually don't bother trying to dance in the markets much past noon)
RE your observation that yyou don't really know if there is any validity in the Big double bell pattern of VP,
I don't know either; but it is something I will be studying as I gather more charts.
in your video (THANKS for your videos, they mean more than just numbers because all of us can SEE where the PA was)
in your video, you mentioned that 39 was also (on a shorter-term basis) an LVN.
that is speaking volumes to me (pun intended).
Here are my thoughts,
the Big Bell apparent on the 5 day volume profile was the ceiling that was broken to the upside...question that has to be asked is: Has former resistance become support.
maybe that LVN (39) in the short-term was at least an "OK to give a reversal trade a try"
maybe the big bells on the longer term view have significance for at least a 'first test--trade' when combined with an LVN shorter-term.
RE your observation that yyou don't really know if there is any validity in the Big double bell pattern of VP,
I don't know either; but it is something I will be studying as I gather more charts.
in your video (THANKS for your videos, they mean more than just numbers because all of us can SEE where the PA was)
in your video, you mentioned that 39 was also (on a shorter-term basis) an LVN.
that is speaking volumes to me (pun intended).
Here are my thoughts,
the Big Bell apparent on the 5 day volume profile was the ceiling that was broken to the upside...question that has to be asked is: Has former resistance become support.
maybe that LVN (39) in the short-term was at least an "OK to give a reversal trade a try"
maybe the big bells on the longer term view have significance for at least a 'first test--trade' when combined with an LVN shorter-term.
JO
johnpr2010
Rep: 2,285
Posts: 274
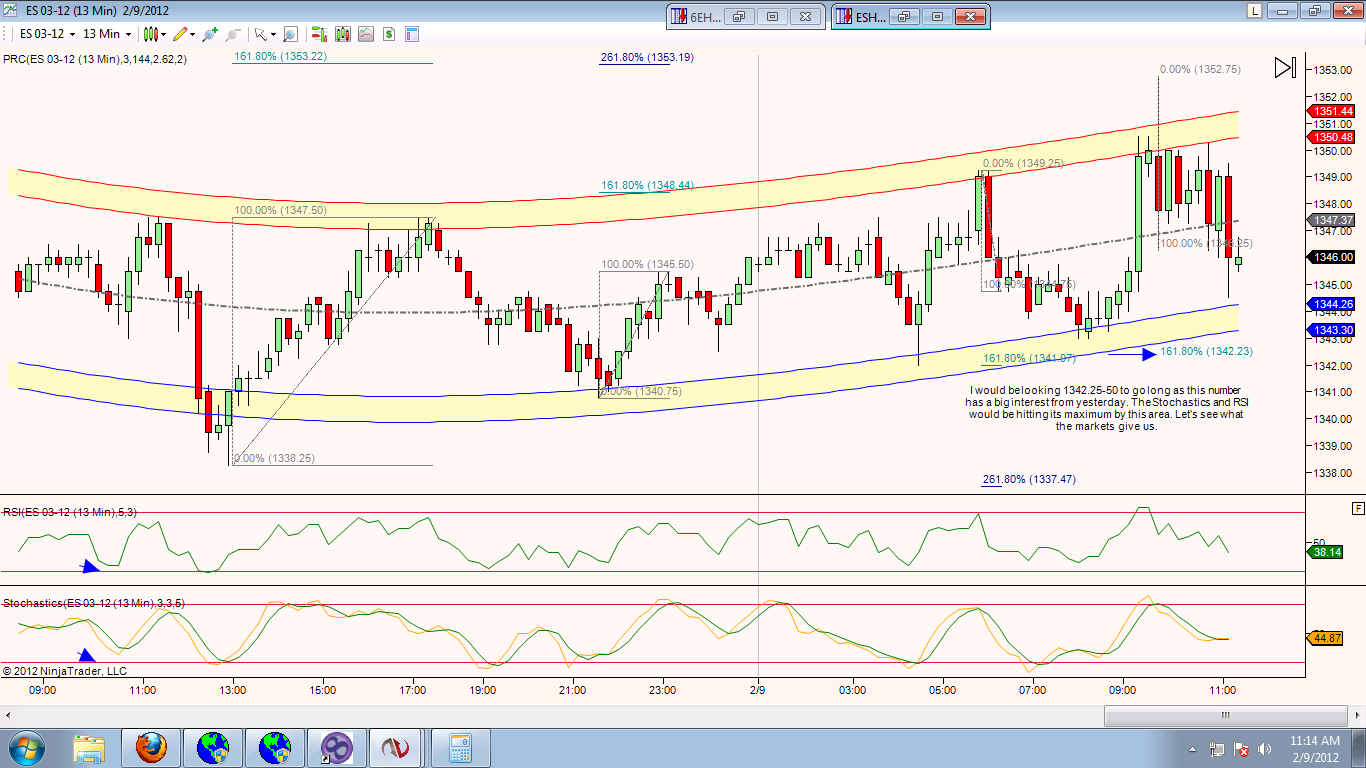
1340.75 is the overnight low. See how it bounce to the tick. I am going to 44.50 on my position.
NI
NickP
Rep: 7,237
Posts: 771
what stop do you use john ?
Originally posted by johnpr2010
1340.75 is the overnight low. See how it bounce to the tick. I am going to 44.50 on my position.
JO
johnpr2010
Rep: 2,285
Posts: 274
NickP,
I use 16 ticks as stop loss and if i am right I manage the stop once it runs on my favor.
I use 16 ticks as stop loss and if i am right I manage the stop once it runs on my favor.
NI
NickP
Rep: 7,237
Posts: 771
thanks
Originally posted by johnpr2010
NickP,
I use 16 ticks as stop loss and if i am right I manage the stop once it runs on my favor.
SA
Sangeo
Rep: 50
Posts: 15
I could be wrong, but it also looks like it's near a volume node from yesterday and 8pts off the open (pitbull number maybe?
). I suppose I should buy there instead of staring at it!
). I suppose I should buy there instead of staring at it!
Originally posted by johnpr2010
1340.75 is the overnight low. See how it bounce to the tick. I am going to 44.50 on my position.