ES Tuesday 3-6-12
Kicking off Tuesday's trading topic with a question:
What would Bruce do?
It's an easy game and designed to make you think and become a better trader. Feel free to replace Bruce with KoolBlue or Monkey Meat or any other trader that you follow, understand or wish to emulate.
Before, at or after the market open and then at any time during the trading day ask yourself what that trader would do at this point. Post your trade (or non-trade) with the reason that you would have (or would not have) taken it. If you're learning and not posting an actual trade then say something like "I would have gone short here if I were trading real money because we hit up against the triples on..." etc.
If you see someone comment on a possible trade setup that you recognize then reply and confirm that you agree with the setup or what you think the setup should have been or why it is invalid.
Think of this as your midterm. You've been reading these topics for days, weeks, months or years. Now try it out and get feedback from your peers (hopefully).
Good luck everyone!
BTW,
the '+' crosses on the chart are vwap restarted every day.
the magenta line with the black dots is the 600 period exponential moving average of the 5minute bars.
the '+' crosses on the chart are vwap restarted every day.
the magenta line with the black dots is the 600 period exponential moving average of the 5minute bars.
http://screencast.com/t/0qmY7rnogH9
Here's a chart of the VOLD and some interpretations of context
All its saying is that the short trade is preferable, not that the long trade cannot work out
Bruce, Sierra Charts gives you the ADD/VOLD even if your data provider don't provide it.. Many data providers only provide futures data and no index data..
what data source is that paul ?
My sources tell me that some of the owners of Fulcrum trading ( the folks who really got everyone interested in CD) sold out the business to Tradershelpdesk.com and now they run this site here.
http://traderscapitalresource.blogspot.com/
Very strange if you can make so much money trading.....always makes me wonder
http://traderscapitalresource.blogspot.com/
Very strange if you can make so much money trading.....always makes me wonder
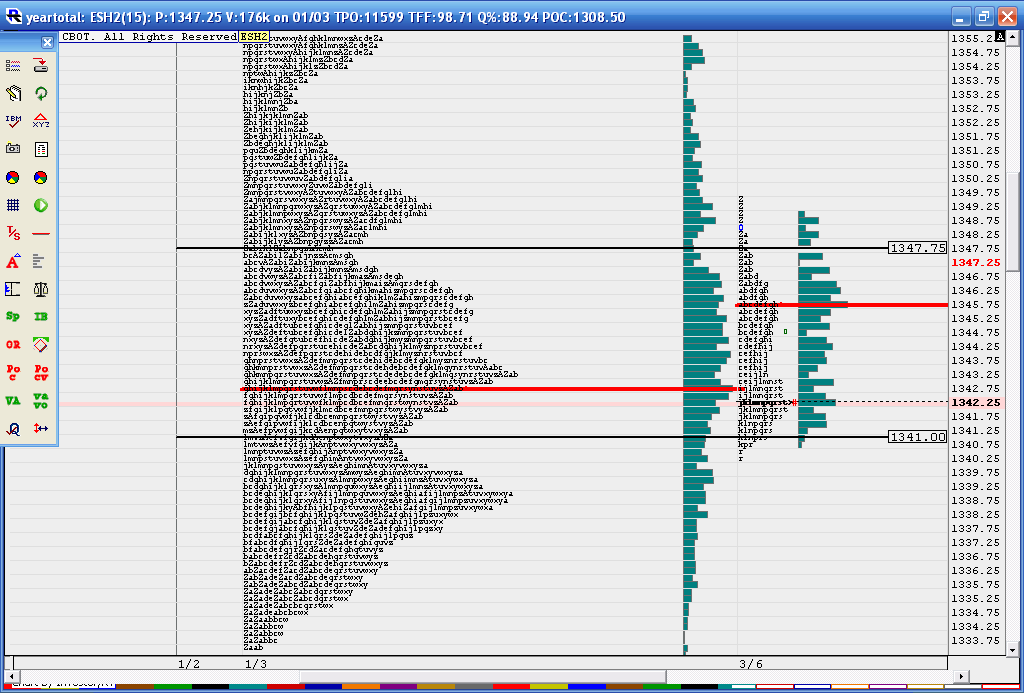
another shot at the low volume area ( I snapped a line ) as per time off the yearly chart..1341..also one at 1347.75
Click image for original size
I went to that site.
Are you serious?
Are you serious?
For me, CD works much better on CL due to lighter volume - On ES, its useful on smaller time frames or 1000/3000 vol charts mainly to avoid being the pioneer in reversals.. sometimes divergences gives some information but not always tradable..
Tdy, it showed heavy CD sell off while price was holding.. This does not mean price can't go lower, but it does tell us there is some absorption in the sell off... In this case, price will either break the absorption and go much lower or rebound some into TOD(time of day) like the last 30 min of trading and etc..
Tdy, it showed heavy CD sell off while price was holding.. This does not mean price can't go lower, but it does tell us there is some absorption in the sell off... In this case, price will either break the absorption and go much lower or rebound some into TOD(time of day) like the last 30 min of trading and etc..
scary but true I think......lots of money selling pans and picks to all those looking to find gold...trading is no different.
Originally posted by PAUL9
I went to that site.
Are you serious?
there was also some absorption to the upside..
Originally posted by BruceM
great trade Horse...it's all cool APK..thanks for the recap..
final contract exit at 42.50.
thanks bruce! have a lot of respect for you and your thoughts for longs today added some conviction to my trade idea. when we have such a strong long term timeframe, it's easier to side with them, even on a day like today!
will be interesting to see what happens tomorrow.
Emini Day Trading /
Daily Notes /
Forecast /
Economic Events /
Search /
Terms and Conditions /
Disclaimer /
Books /
Online Books /
Site Map /
Contact /
Privacy Policy /
Links /
About /
Day Trading Forum /
Investment Calculators /
Pivot Point Calculator /
Market Profile Generator /
Fibonacci Calculator /
Mailing List /
Advertise Here /
Articles /
Financial Terms /
Brokers /
Software /
Holidays /
Stock Split Calendar /
Mortgage Calculator /
Donate
Copyright © 2004-2023, MyPivots. All rights reserved.
Copyright © 2004-2023, MyPivots. All rights reserved.