ES Thursday 3-29-12
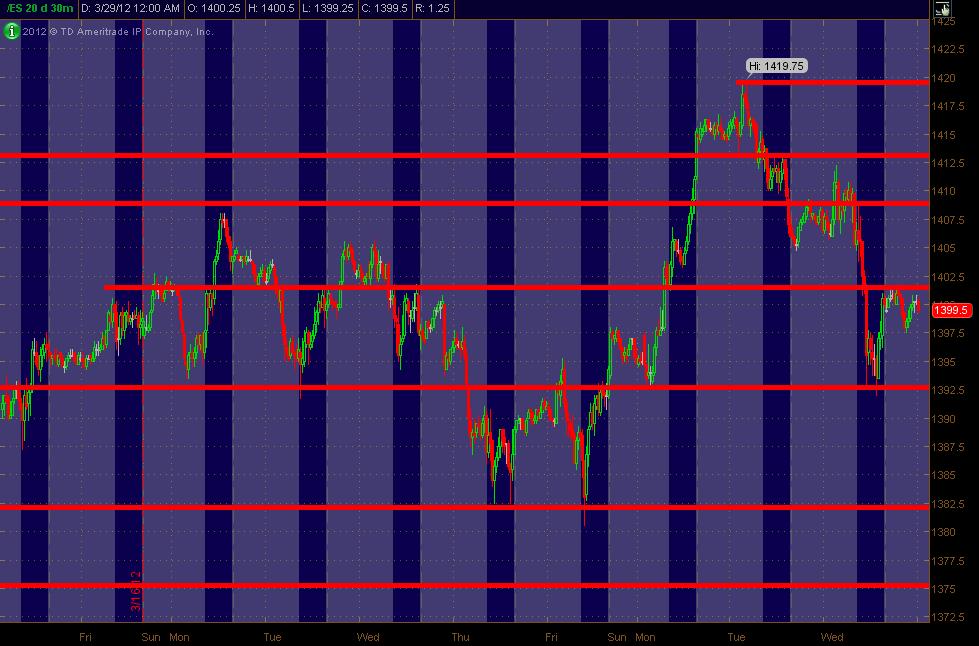
Here are my Monkey Zones of price S/R on a 30min (all trading hours) chart. Hope it's helpful as a Map of price coming into Thursday's trading. Blue background shows RTH with Gray background showing "overnight" trading.
I've a few minor levels ... but these are the potentially significant ones after viewing multiple time frames.
MM
Click image for original size
I've a few minor levels ... but these are the potentially significant ones after viewing multiple time frames.
MM
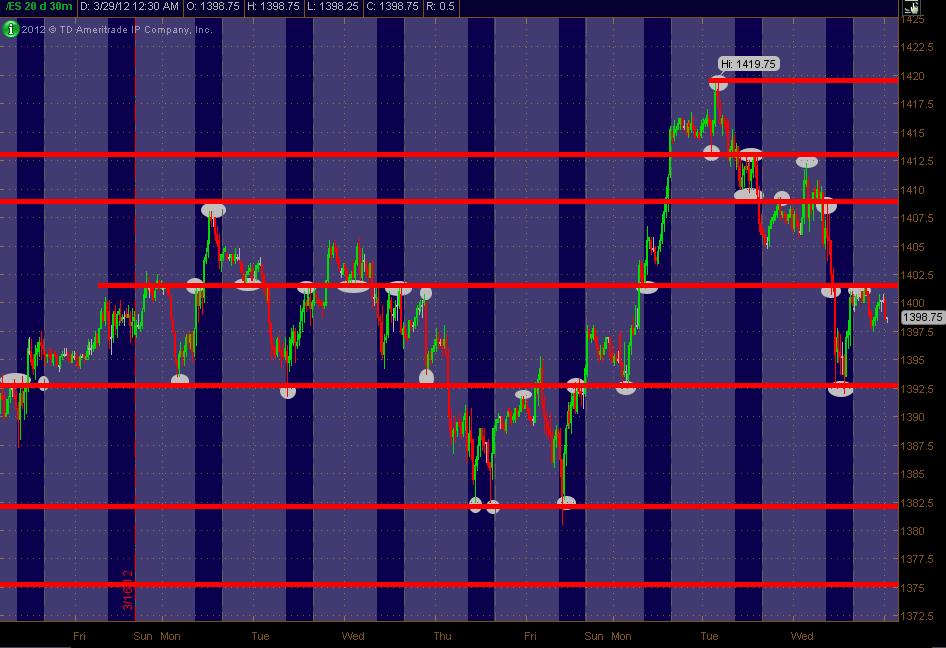
Here's what I see for drawing in the price levels ... shown by the White circles/ovals around price swings/levels. Just tossing this out to better show/describe how I generated the price ZONES. Ain't rocket science, as I've always said.
Click image for original size
Originally posted by MonkeyMeat
Here's what I see for drawing in the price levels ... shown by the White circles/ovals around price swings/levels. Just tossing this out to better show/describe how I generated the price ZONES. Ain't rocket science, as I've always said.
Click image for original size
What made you remove your 88-89 area? We have not been there since we both posted it on our Monday roadmaps.
RE 89-88 area
I've mentioned this before and I don't want to bore readers
you had price points of interest there, there was another measurement that suggested strong odds of a tag of 1387.00
odds are about 8 in 10 that if the 161.8 down of Monday's RTH range is printed RTH, the full extension of Monday's range will print.
161.8 means take Monday's range multiply by .618 and subtract that from the Monday L
This Monday that extension down was 1392.50
( we hit it yesterday RTH, I have mentioned that I have a friend who BUYS the first hit of 618 down with a tight stop (he is a scalper and only looks for 2 points), but the bigger truth is that sometime before the next Monday's close, the full extension down will print. You have to read short-term PA to determine when the PA is is in line with the expectation (RTH prices only) AND, if price moves above 50% of Monday's range odds diminish BTW 50% of Monday's RTH range = 1408.50 (familiar price? the actual calc of 50% of Monday's range is 1308.38, but roung to closest .25 makes it 1408.50
I consider the chances for a full extension down extinct if there is a move above 50% of Monday's range.
FUll extension DOWN means Monday's RTH range subtracted from Monday's L, for this week, that meant:
Monday H 1415.50 minus Monday L 1401.25 = 14.25
Monday L minus 14.25 = 1387.00
A DB in this area would be great for a try higher, but I can tell you that I have not been able to identify any pattern in connection with a full extension. All I know is that they happen.
After recently watching a vendor calling out ES trades (pretty accurately) based on some mysterious calculations, I decided to seek out some info without paying the $3000 - 4000 fee he was asking for. I found it right here on this thread. Thanks to Bruce, Paul, Monkey Meat and all other participants for this great series of posts. I'll be putting in some study hours in the next week or two.
Hey Paul, what is the basis of using Monday? Is it b/c it made new highs for the year, month, day?
Thanks
Thanks
sorry, AVID, I was busy on research computer while dying of boredom.
Monday is first day of week.
Just like day traders will use first 5 minute bar, or first 30 minute range as an anchor to judge intraday movement.
I happened upon the phenomenon while trying to figure out if fibs and pivots were worth watching. went over years and years of RTH data with MOnday fibs in place.
basically I think it works because it represents a threshold of pain for those on the wrong side of the move, it also demonstrates a certain amount of momentum, and momentum usually does not just stop on a first probe.
Once printed, the 618 extension is like an uncle point (I guess), after a little reversion to the mean, it is an easy target for bigger players with more money to press prices to see if they can unlock volume.
I used to have a spreadsheet that produced all sorts of fibs, along with many % moves.
The fibs and % retracements/expansions of range are virtually the same thing.
Believe me, I studied them for years.
You know the formulas for R2, R1, PP, S1, S2 (you can find them by going to the Daily Notes section in mypivots, choose an instrument and then look at the left hand side, slide down a bit, PIVOTS, if you click on Classic or Woddie's you can see the formulae.
If you look at what the formulas do, it is easy to understand why certain fibs and % expansions are the same.. I just focus on the 618 because not only fib watchers will watch it, but players who calculate only Pivot Points will be watching it, too.
regular old percent expansions and retracements are akin to certain pivot point calcs (with the exception of a day when price closes near the HOD or the LOD), here are the relationships
PP is roughly 50% of the range of the day, the only thing that throws the PP higher or lower than 50% of the day is a fraction of the distance between 50% of the range of the day and the close,
50% = (H+L)/2
PP= (H+L+C)/3 (The only thing it's doing is including the close, but it is dividing the sum H+L+C by 3, so it is only a fraction of the the difference between 50% of the day's range and where the close is that differentiates the Pivot Point from 50% of the range. (Mark Fisher wrote a book about using both the 50% and Pivot point, "The Logical Trader")
R2 and S2 are roughly 618 extensions of the range.
Once again there is a little skew based on distance of the C from good old 50% = (H+L)/2
That's why I have focused on .618 and full extensions (range size of anchor period added to range H and subtracted from range Low)
Big Mike
What made you remove your 88-89 area? We have not been there since we both posted it on our Monday roadmaps.
I should've put it on there. It was on my regular chart I use, and I had changed its color to represent perhaps less significant support. It was a judgement call with my thoughts being that there was a better probability that if the market went down, it'd push on past it and into the 82-83 area. I actually had it on the chart I posted but deleted it before I did the "screen capture"/upload.
It should have been left on there. Anyway, that was my last minute rationale at least. In hindsight, it bugs me to goof up something like leaving that level out. Thanks for pointing that out - is still a decent level. My Bad.
Originally posted by MonkeyMeat
Big Mike
What made you remove your 88-89 area? We have not been there since we both posted it on our Monday roadmaps.
I should've put it on there. It was on my regular chart I use, and I had changed its color to represent perhaps less significant support. It was a judgement call with my thoughts being that there was a better probability that if the market went down, it'd push on past it and into the 82-83 area. I actually had it on the chart I posted but deleted it before I did the "screen capture"/upload.
It should have been left on there. Anyway, that was my last minute rationale at least. In hindsight, it bugs me to goof up something like leaving that level out. Thanks for pointing that out - is still a decent level. My Bad.
I thought it was going down around 81 too! Got on when it closed @ 88, luckily got out with green.
Good luck to all!
NICE play!!
Emini Day Trading /
Daily Notes /
Forecast /
Economic Events /
Search /
Terms and Conditions /
Disclaimer /
Books /
Online Books /
Site Map /
Contact /
Privacy Policy /
Links /
About /
Day Trading Forum /
Investment Calculators /
Pivot Point Calculator /
Market Profile Generator /
Fibonacci Calculator /
Mailing List /
Advertise Here /
Articles /
Financial Terms /
Brokers /
Software /
Holidays /
Stock Split Calendar /
Mortgage Calculator /
Donate
Copyright © 2004-2023, MyPivots. All rights reserved.
Copyright © 2004-2023, MyPivots. All rights reserved.