guess I'll start ;)
there is a sea of fibs in the area we touched on thursday....will they snap it back up for the real hit or was that the trigger in disguise?
.768 / 1.128 right there at the high
JI
jimkane
Rep: 3,058
Posts: 33,089
So now these idiots probably want 43 and change. .447 is at 47.11. It could fade as it gets close to 40. I don't mean today, but the way this game is played, you never know. I'd greatly prefer it fail right here and head down, but it needs a bounce...
JI
jimkane
Rep: 3,058
Posts: 33,089
I just saw your post, rat. Yeah, that's the kind of things I had coming in centered around 20 on the ES. But it hit the very upper area, so that may be it.
JI
jimkane
Rep: 3,058
Posts: 33,089
Okay, I know everyone wants me to quit already with my pickfest on Carl. Part of me wants to. I even decided I was done with all that. I had a lesson to teach, I think I taught it, now let it go. If he didn't have so much respect, I would.
So, while pondering my next move, I decided to go back to a random date, and I chose the first part of Sept of 2008. I didn't chose this as a 'well-chosen' example. I haven't even read the posts, today, before or after this one. Here's his post for the day. I am reposting this here so I can highlight his words, as he highlighted them. I can't do that when I quote on the chart.
"Guesstimates on September 2, 8:15 am ET
Spiders - September S&P E-mini Futures: The market has rallied nearly 20 points from its early morning low at 1276.75. It is also trading above most of Friday’s range. Since I am basically bullish I just put back on my 200% long position at 1294.25. I think this up swing will reach 1340. Support today is at 1285. I still think we are in the early stage of a move to 1500."
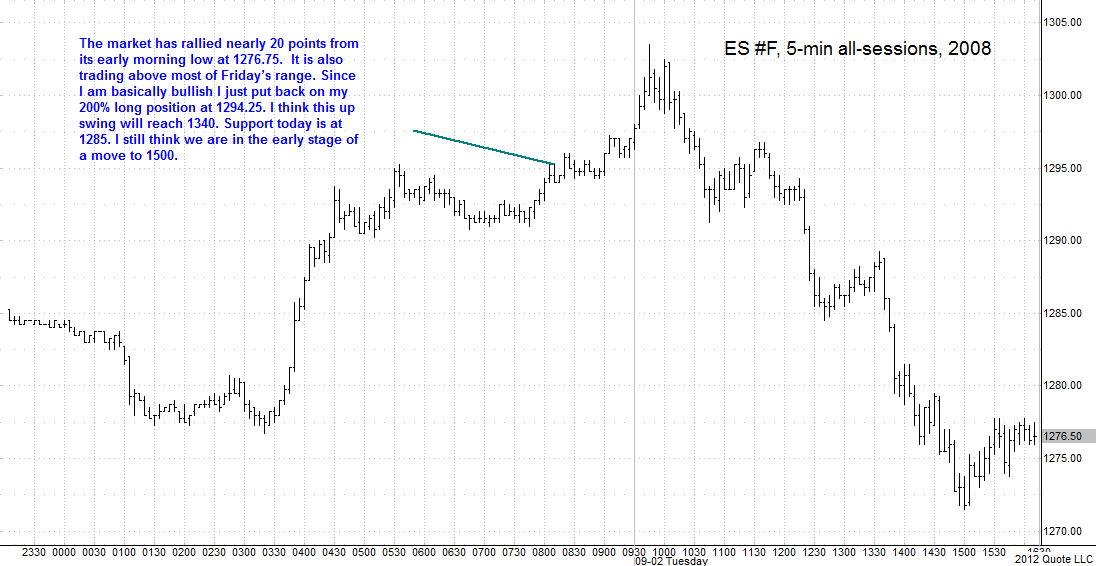
Now for some context, here is the post on the 5-min chart for that day.
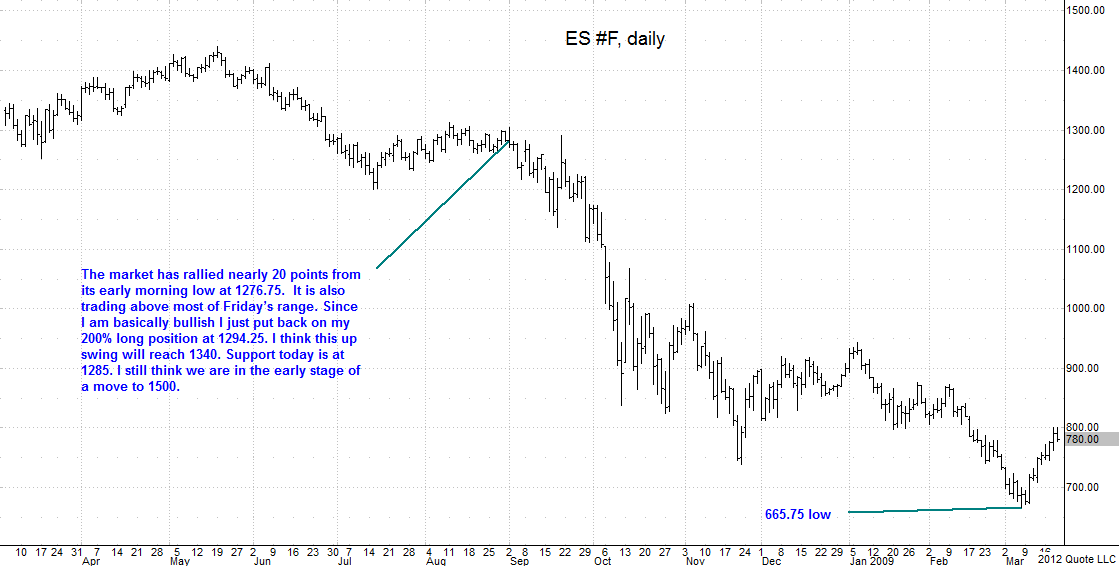
And here's the greater context of what he said and where he said it. This is the daily chart.
So, what's the point? We sit in a potentially similar situation today. Let's look at another example I just chose right now, Jan 6, 2009. He said:
"...I still think that that the 1000 level will be reached this month."
That day was the high for the move, and it dropped just about 30% from there.
Since I'm on a roll (I didn't expect to do any more than that initial quote), let's look at another random date, Feb 20 (I'm just picking these as I go):
"The market dropped as low as 763.25 this morning. I think 765 is support and that the next significant move from here will be upward."
Look at the chart. 765 wasn't 'support', and the market dropped over another 100 points from there.
So, the point is, why am I wasting my time on Carl or any other perma-bull who just calls for endless new bull markets all the way down? It will never change. I simply wanted everyone in here to try to understand how to use blogs to their advantage, and not get suckered by popular consensus and endless bullish drivel.
Now I see, for myself, in having done this experiment here, what is actually going on. I can let it go now. I don't need to point this out over and over. I won't even be using his blog as a contrarian point of view, since he is 100% bullish 100% of the time, as far as I see it. There is no contrarian to a 100% viewpoint. I think we all learned from this.
Now the question I have yet to answer is how can he be up 239% on his account, according to his account summary post???
Charts created on QCharts, courtesy eSignal
So, while pondering my next move, I decided to go back to a random date, and I chose the first part of Sept of 2008. I didn't chose this as a 'well-chosen' example. I haven't even read the posts, today, before or after this one. Here's his post for the day. I am reposting this here so I can highlight his words, as he highlighted them. I can't do that when I quote on the chart.
"Guesstimates on September 2, 8:15 am ET
Spiders - September S&P E-mini Futures: The market has rallied nearly 20 points from its early morning low at 1276.75. It is also trading above most of Friday’s range. Since I am basically bullish I just put back on my 200% long position at 1294.25. I think this up swing will reach 1340. Support today is at 1285. I still think we are in the early stage of a move to 1500."
Now for some context, here is the post on the 5-min chart for that day.
And here's the greater context of what he said and where he said it. This is the daily chart.
So, what's the point? We sit in a potentially similar situation today. Let's look at another example I just chose right now, Jan 6, 2009. He said:
"...I still think that that the 1000 level will be reached this month."
That day was the high for the move, and it dropped just about 30% from there.
Since I'm on a roll (I didn't expect to do any more than that initial quote), let's look at another random date, Feb 20 (I'm just picking these as I go):
"The market dropped as low as 763.25 this morning. I think 765 is support and that the next significant move from here will be upward."
Look at the chart. 765 wasn't 'support', and the market dropped over another 100 points from there.
So, the point is, why am I wasting my time on Carl or any other perma-bull who just calls for endless new bull markets all the way down? It will never change. I simply wanted everyone in here to try to understand how to use blogs to their advantage, and not get suckered by popular consensus and endless bullish drivel.
Now I see, for myself, in having done this experiment here, what is actually going on. I can let it go now. I don't need to point this out over and over. I won't even be using his blog as a contrarian point of view, since he is 100% bullish 100% of the time, as far as I see it. There is no contrarian to a 100% viewpoint. I think we all learned from this.
Now the question I have yet to answer is how can he be up 239% on his account, according to his account summary post???
Charts created on QCharts, courtesy eSignal
JI
jimkane
Rep: 3,058
Posts: 33,089
Those MRRD's really made the bears squeal there.
Originally posted by jimkane
Long live da bears.
JI
jimkane
Rep: 3,058
Posts: 33,089
So, the gun up seems to have started. AAPL is starting to gun. Where will AAPL be after earnings today? 700? 750? They always blow out earnings, set new records for how far out of the park they knocked it, how much they could beat by. The market expects this, yet it happens over and over, and the jumps, which should already be priced in, no?, get bigger and bigger.
The market fully expects a monster beat today. The market fully expects AAPL to be trading at 700 or 750 a few short minutes from now. The market is not discounting this, as usual, which defies all market logic I have or have come to understand. One of these times this will not happen, and AAPL should drop 200-300 in a flash, taking the market with it. But will today be that day? Hard to say, I doubt the time has come yet, but it may have. Some day... Just probably not today. Let's see how those AAPL calls swell by tomorrow.
JI
jimkane
Rep: 3,058
Posts: 33,089
Okay, I'm looking at AAPL at 634 and 667. Let's see. I'm in no way saying this will happen. I'm saying that if these maniac idiots do the usual, these are two levels I would think they would shoot for. Idiots. Anyway, these are just center of areas, not exact points, of course. I'm hoping against hope this is the time when they miss and get hammered. But, the way things are nowadays, I could see them missing and jumping up anyway...