Well, will it gap up and make me cry (actually p#%& me off to no extent*...)? Can it keep running after going essentially straight up over 63 points? Will it blow out my great areas, as seen in rat's charts? Are the odds really what I think them to be, 0.0001% that it could go down here? These, and many other interesting questions, are about to be answered...
*Understand that I would be p#%&ed off to no extent not because I don't think this upside has been tradeable (I think it was highly tradeable), but because I want the market to be allowed to 'do the right thing' and move to fair value. I'm just sick (sick) to my stomach over this endless manipulation. The worse the situation gets, the higher the market goes, and the more the 'bulls' talk about how fair value is much, much higher. Ugh.
JI
jimkane
Rep: 3,058
Posts: 33,089
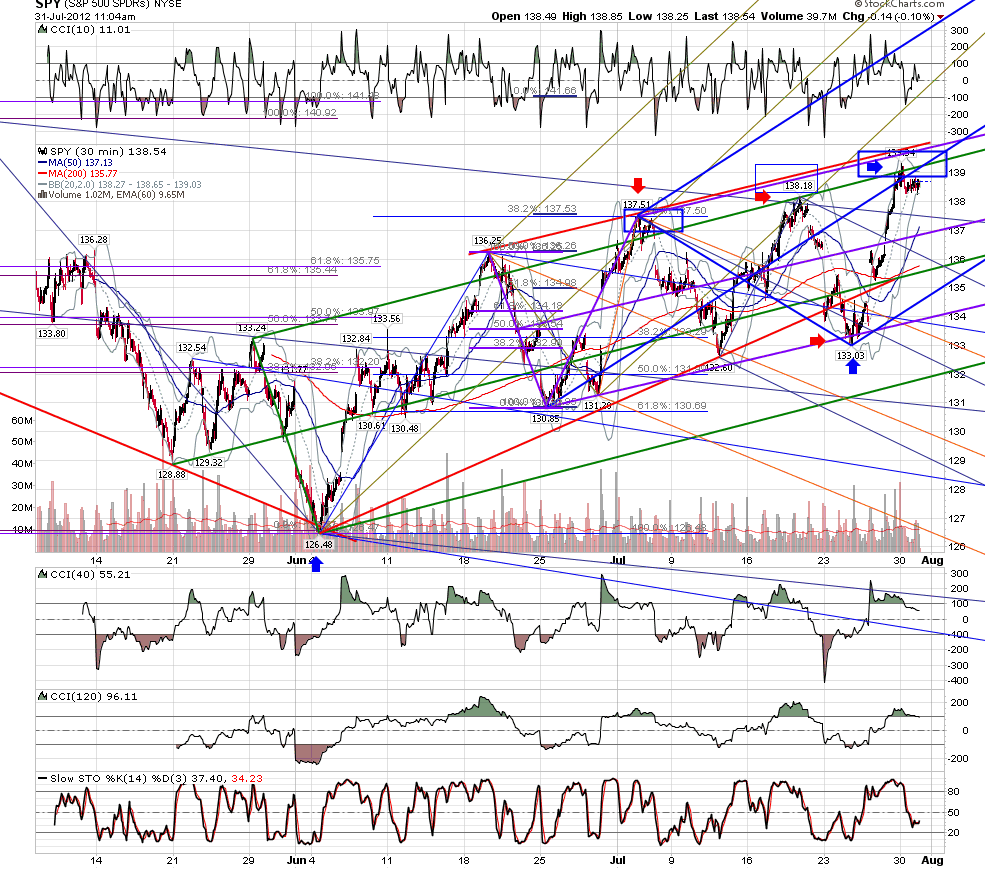
Right off the bearish ABCD, but will it take out the ledge? I doubt it.
JI
jimkane
Rep: 3,058
Posts: 33,089
Yes, it was way cool. I don't need it because I have the real-time ES, but I thought it was great for the stock traders to look at.
Originally posted by rat89
I didn't catch that.....roofer knows a lot of cool stuff!
JI
jimkane
Rep: 3,058
Posts: 33,089
And look at it bounce once again. They are vigorously defending this ledge. In 'the old days' I'd say that's a sign of weakness and they will lose. Nowadays I see it as a prelude to them coming in explosively at some point for an upside 'breakout'. Idiots.
JI
jimkane
Rep: 3,058
Posts: 33,089
And there's the explosive move over the range top. How surprising...
RO
roofer
Rep: 3,689
Posts: 3,574
finviz..... for charts
jim care to comment on the bearish kane patterns in many of the etf's
jim care to comment on the bearish kane patterns in many of the etf's
JI
jimkane
Rep: 3,058
Posts: 33,089
I'm of the opinion that we are forming bearish 'W2' setups in the indices and across the board, and down we go for 'W3' or at worst a CD leg. I can't get over the ES and 5-waves down, heavily overlapping swings up, and every last analyst calling for new highs. It's a perfect layout.
The only thing that bothers me is it's so late in the election run up cycle how can it start a big leg down now? ZH had an article that showed, based on this one model, that QE3 is 110% priced in the market already. Many, many economists think QE3 comes Sept. So, if they 'disappoint' tomorrow, could that be the start of the move down? I think that is possible.
I see no way for the market to move down here without 'news'. It will take news to set the technicals off. I think this last push up here looks solidly like a topping formation. It's all set up for big down. In this world of manipulation, though, that can also mean less than Jack Squat...
Originally posted by roofer
finviz..... for charts
jim care to comment on the bearish kane patterns in many of the etf's