Volume Indicator
Is there such a volume indicator that subtracts sell(down) volume from the buy (up)volume and charts negative results below zero and positive results above zero in bar form?
Sierra charts has a bid/ask vol ratio study. I use it on a tick chart w Heikin Ashi bars, set the bid ask ratio line to color on slope, up green red down. It's easy to spot divergence with the colors, for me the divergence shows up better on a tick chart than a time or vol chart. The Delta Divergence indicator pretty much does the same thing.
http://support.marketdelta.com/entries/114191-delta-divergence-indicator
http://support.marketdelta.com/entries/114191-delta-divergence-indicator
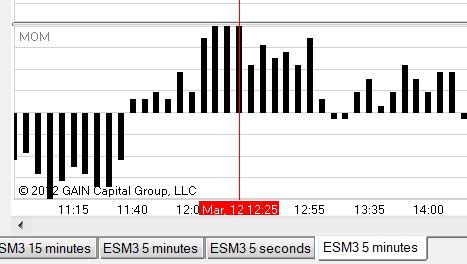
Very cool, thanks for the suggestion. I can split my volume into up(green) or down(red) movement as my choices, but I thought it would be better to subtract the two and display it on a bar chart such as this MOM Indicator... what ever the heck this is. I can't adjust it, I'm not sure what it reads... I just like how it's set up and would like to learn how to set up a volume indicator that reads into negative as well as positive with zero as middle.
A book I've glanced at had an example of a candle that gets fatter as the volume increases, but that seems like it would take a lot of space. Regardless... Thanks again for your suggestion.. I will definitely look into that. cheers!
Click image for original size
A book I've glanced at had an example of a candle that gets fatter as the volume increases, but that seems like it would take a lot of space. Regardless... Thanks again for your suggestion.. I will definitely look into that. cheers!
staylor455... I figured it had to exist somewhere. Many thanks again...
Funny... Last night I posted I had no idea what this MoM indicator was... this morning Business Insiders "10 Things You Need To Know Before The Opening Bell" basically explains it!
"Consensus is for retail sales to rise 0.5 percent month-over-month (MoM)."
I love it when that happens!
"Consensus is for retail sales to rise 0.5 percent month-over-month (MoM)."
I love it when that happens!
Emini Day Trading /
Daily Notes /
Forecast /
Economic Events /
Search /
Terms and Conditions /
Disclaimer /
Books /
Online Books /
Site Map /
Contact /
Privacy Policy /
Links /
About /
Day Trading Forum /
Investment Calculators /
Pivot Point Calculator /
Market Profile Generator /
Fibonacci Calculator /
Mailing List /
Advertise Here /
Articles /
Financial Terms /
Brokers /
Software /
Holidays /
Stock Split Calendar /
Mortgage Calculator /
Donate
Copyright © 2004-2023, MyPivots. All rights reserved.
Copyright © 2004-2023, MyPivots. All rights reserved.