MA
MarcinO
Rep: 67
Posts: 5,506
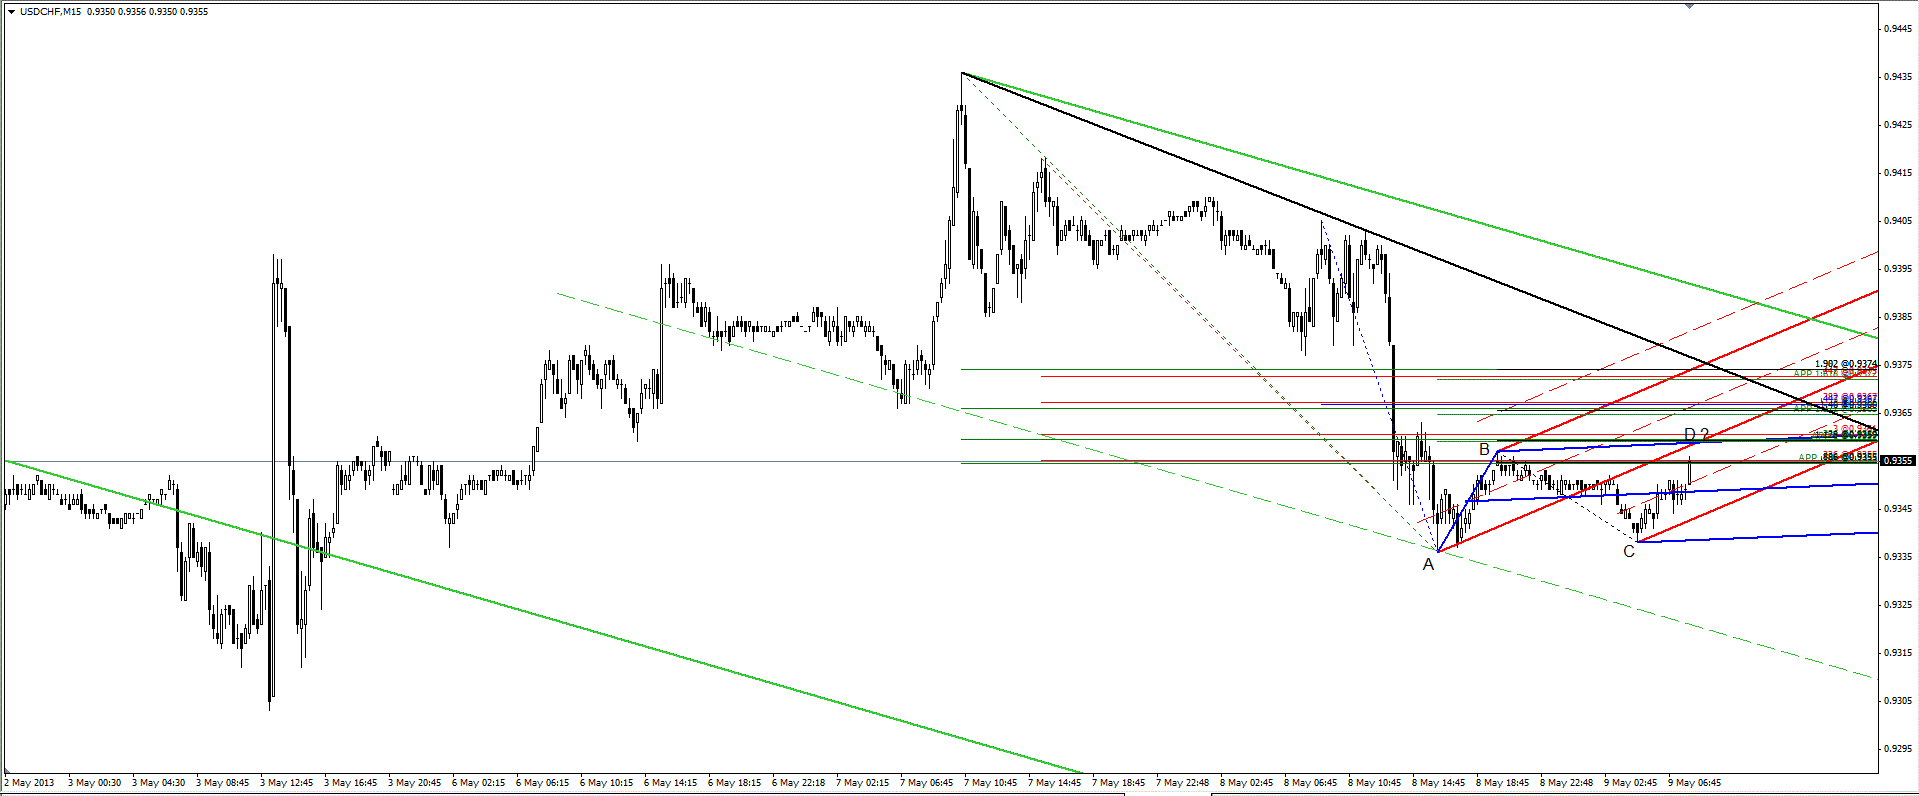
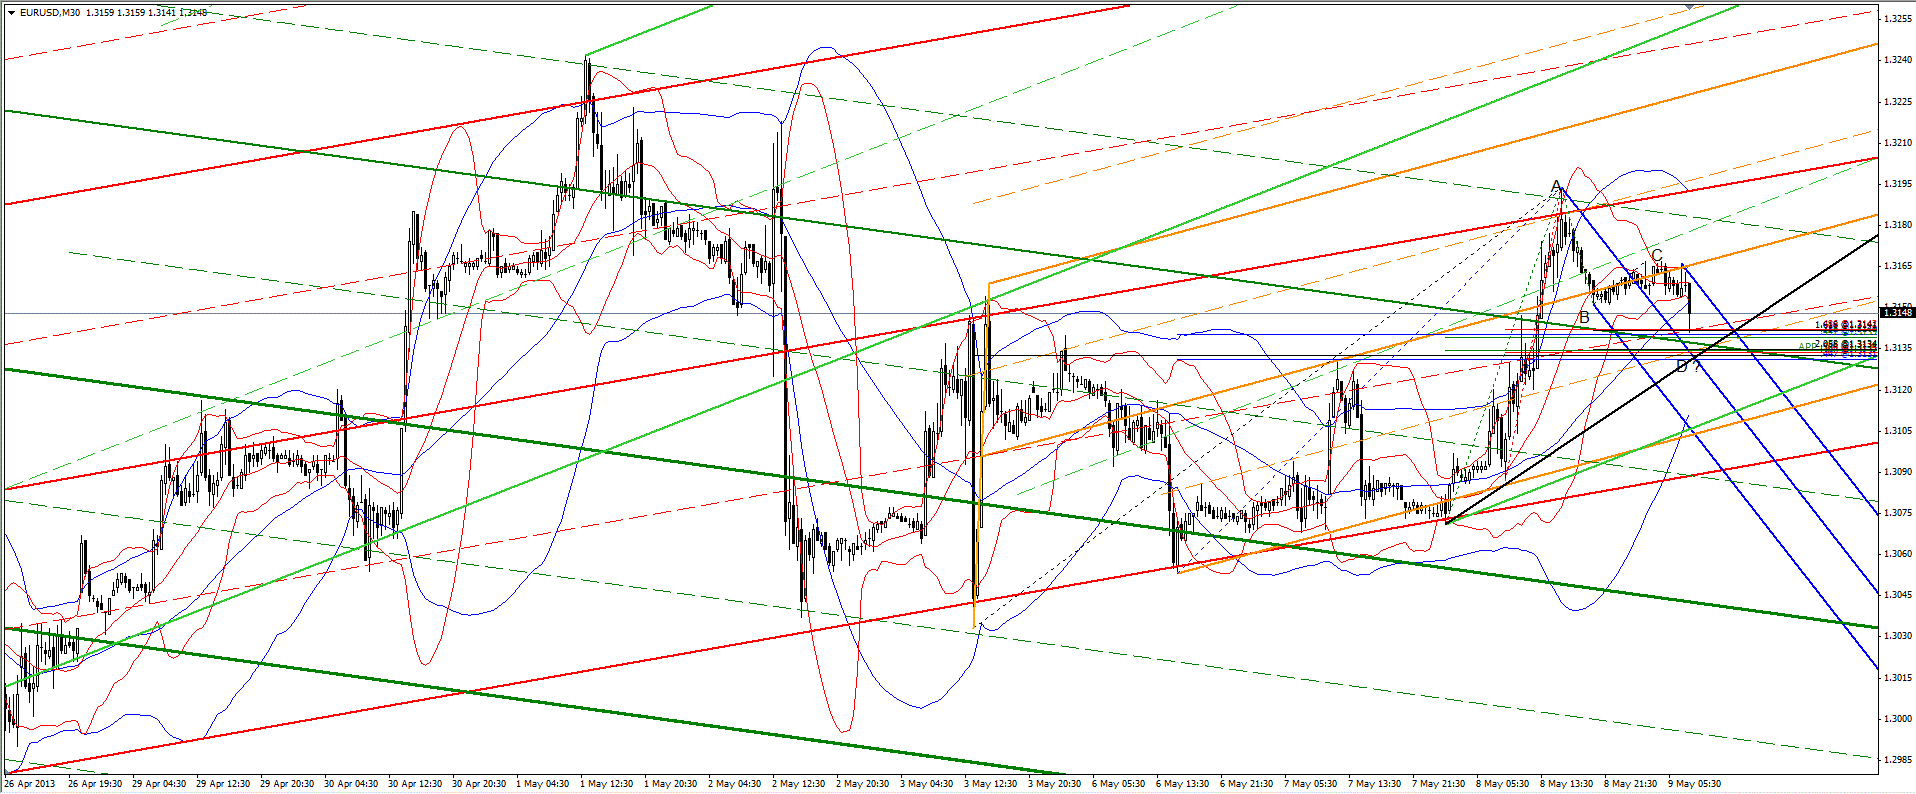
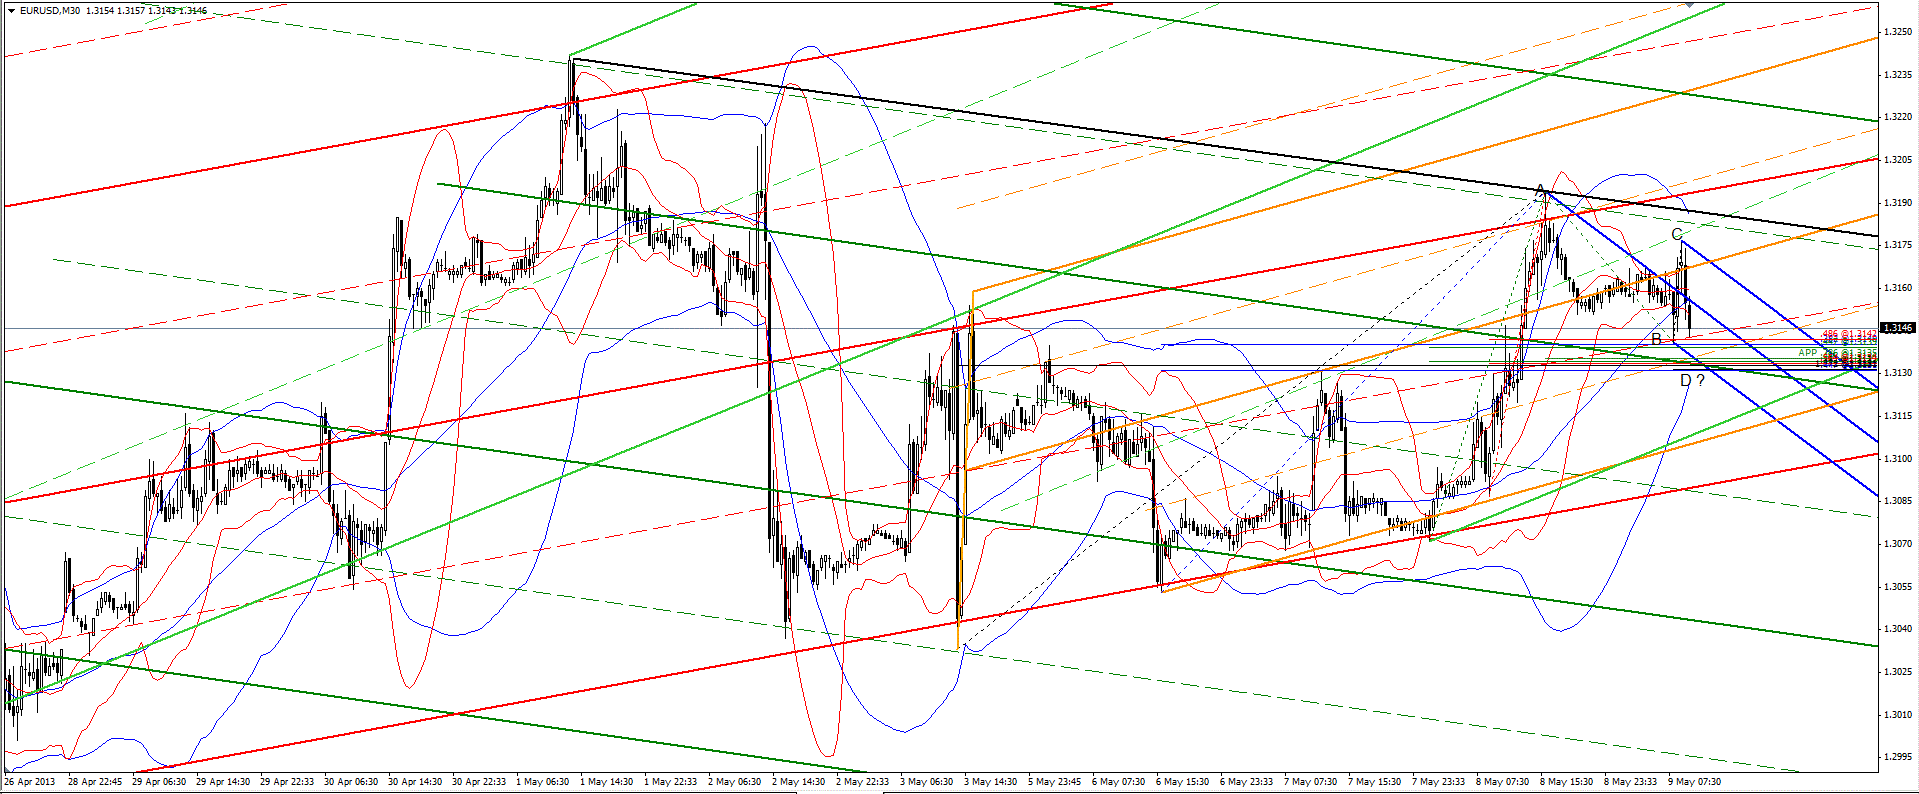
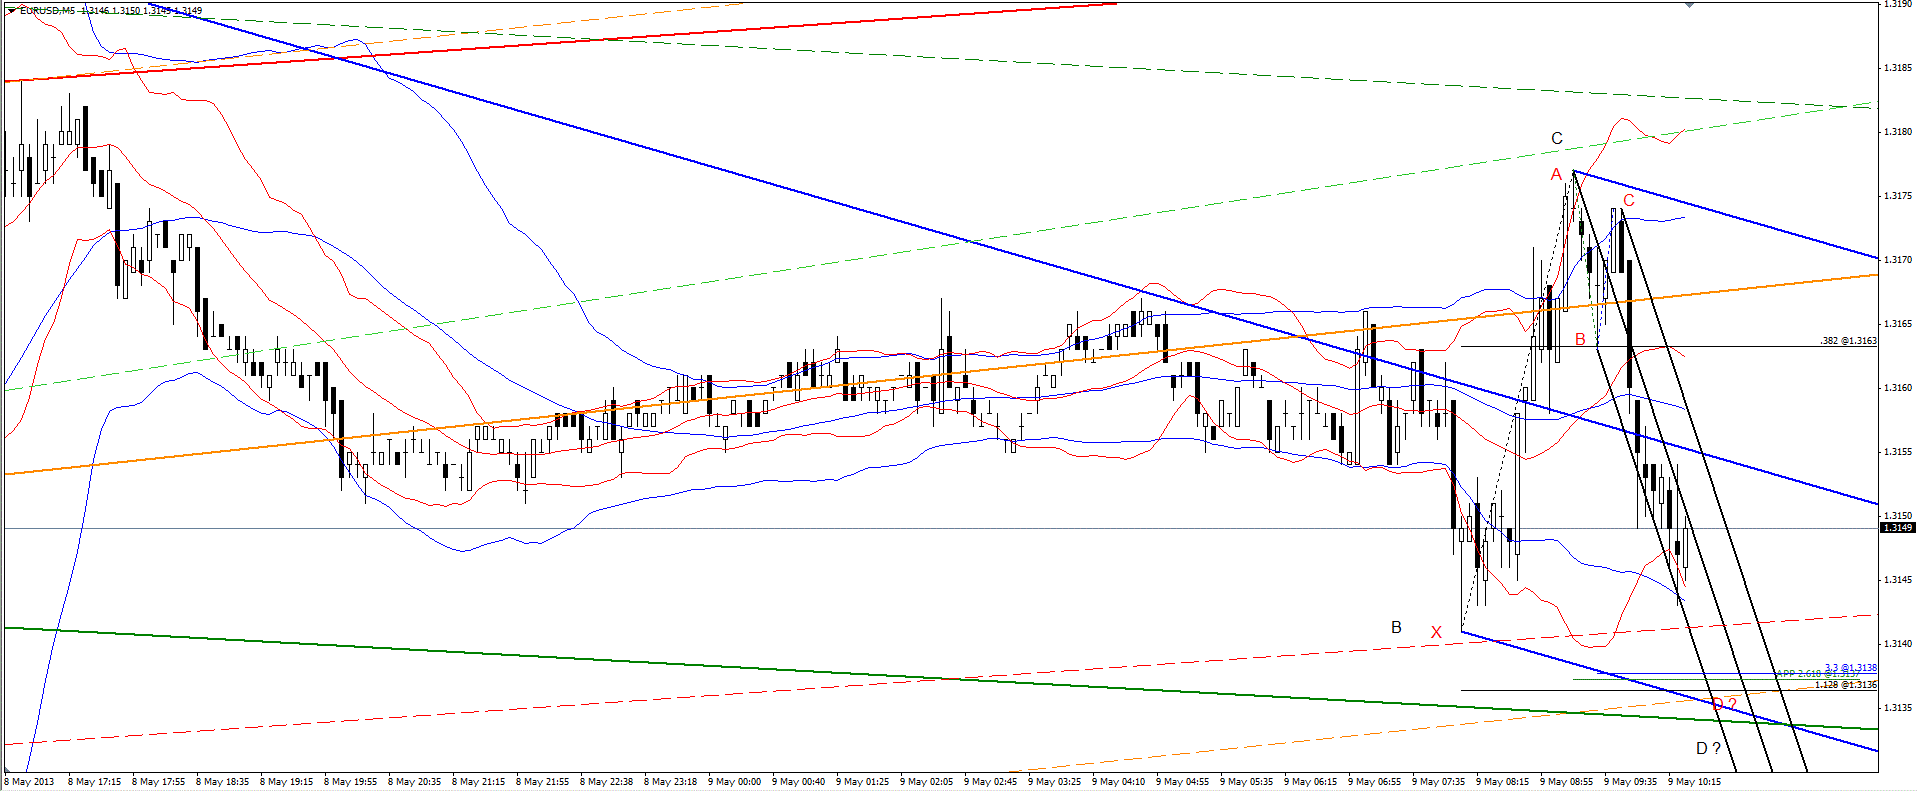
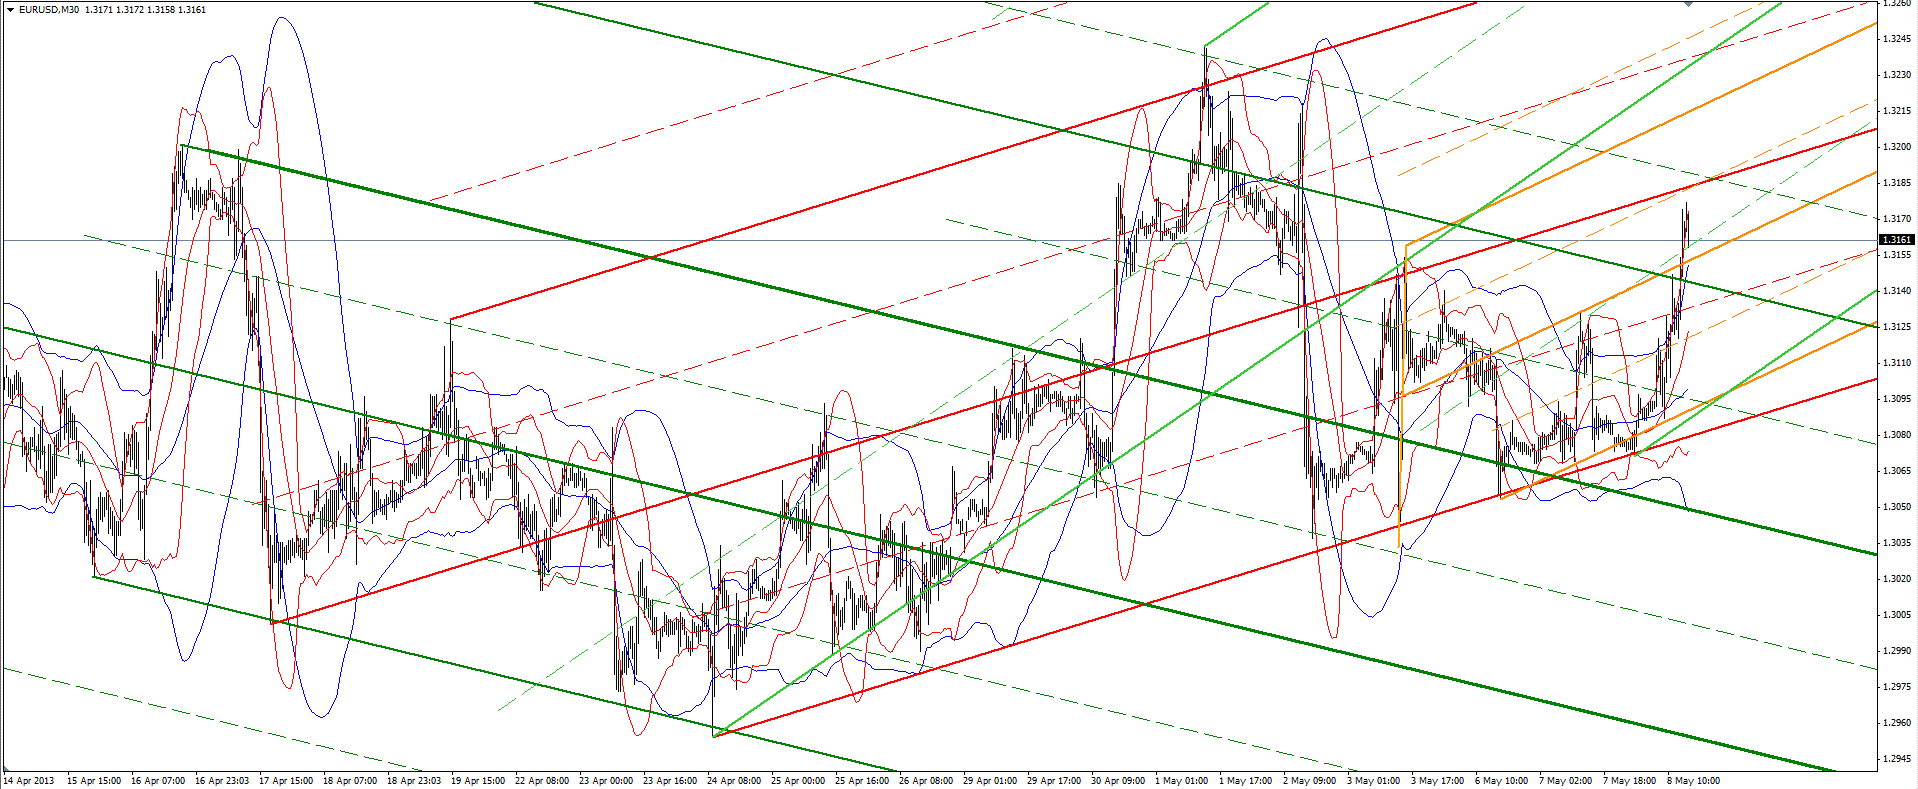
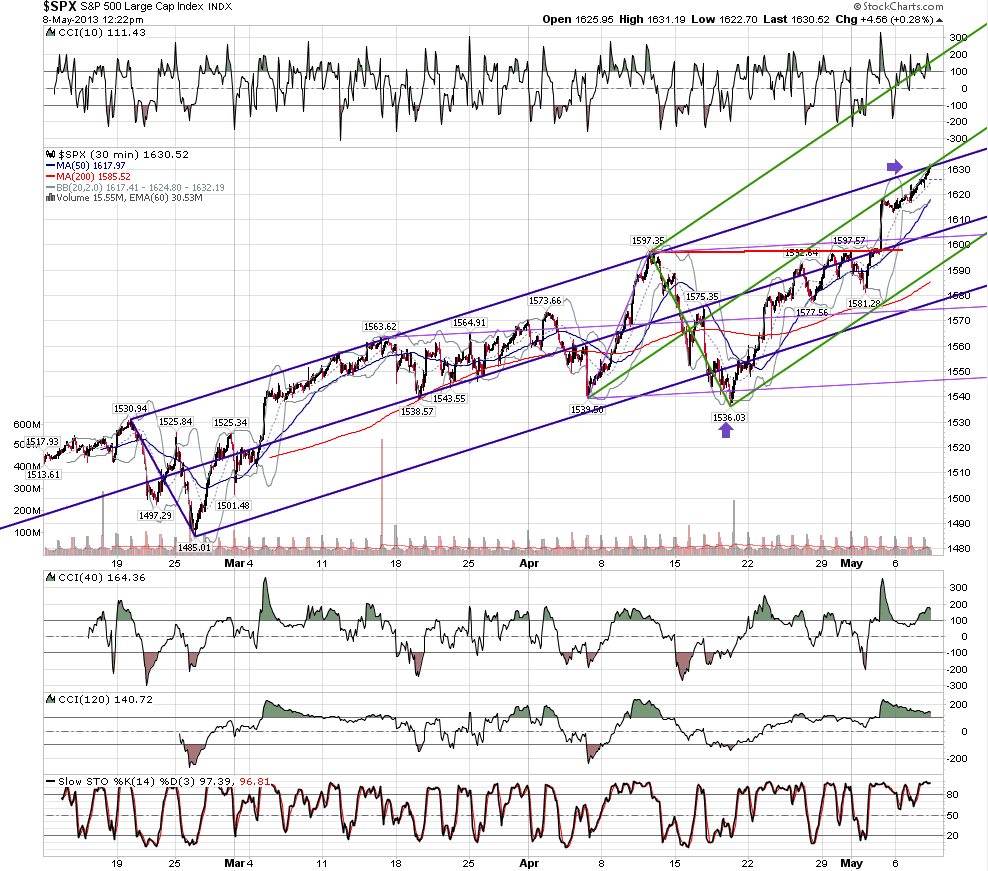
Here is a context chart for the trades attempted today.
Click image for original size
JI
jimkane
Rep: 3,058
Posts: 33,089
I'm still feeling under the weather (so far under I think I'm actually underground). I don't want to dwell on it, and I surely don't want to keep bringing it up over and over. Nonetheless, I wanted to explain my continued absence. I just got a note from a student where 'context' was mentioned, so I thought I'd do an updated chart (you there, Duane?) of that S&P index to show my 'context' thoughts.
As an aside, seems like they are still playing that game over and over, when the market is in an up leg, they just bring in down in the morning for better prices, then run it up, then sometimes pull it in for a final, smaller leg into the close. I don't recall so obvious of a pattern repeated so many times and have it still 'work'. And it may persist until the 'bull' ends, which may be who the heck knows when. Very interesting.
Chart created on QCharts, courtesy eSignal
As an aside, seems like they are still playing that game over and over, when the market is in an up leg, they just bring in down in the morning for better prices, then run it up, then sometimes pull it in for a final, smaller leg into the close. I don't recall so obvious of a pattern repeated so many times and have it still 'work'. And it may persist until the 'bull' ends, which may be who the heck knows when. Very interesting.
Click image for original size
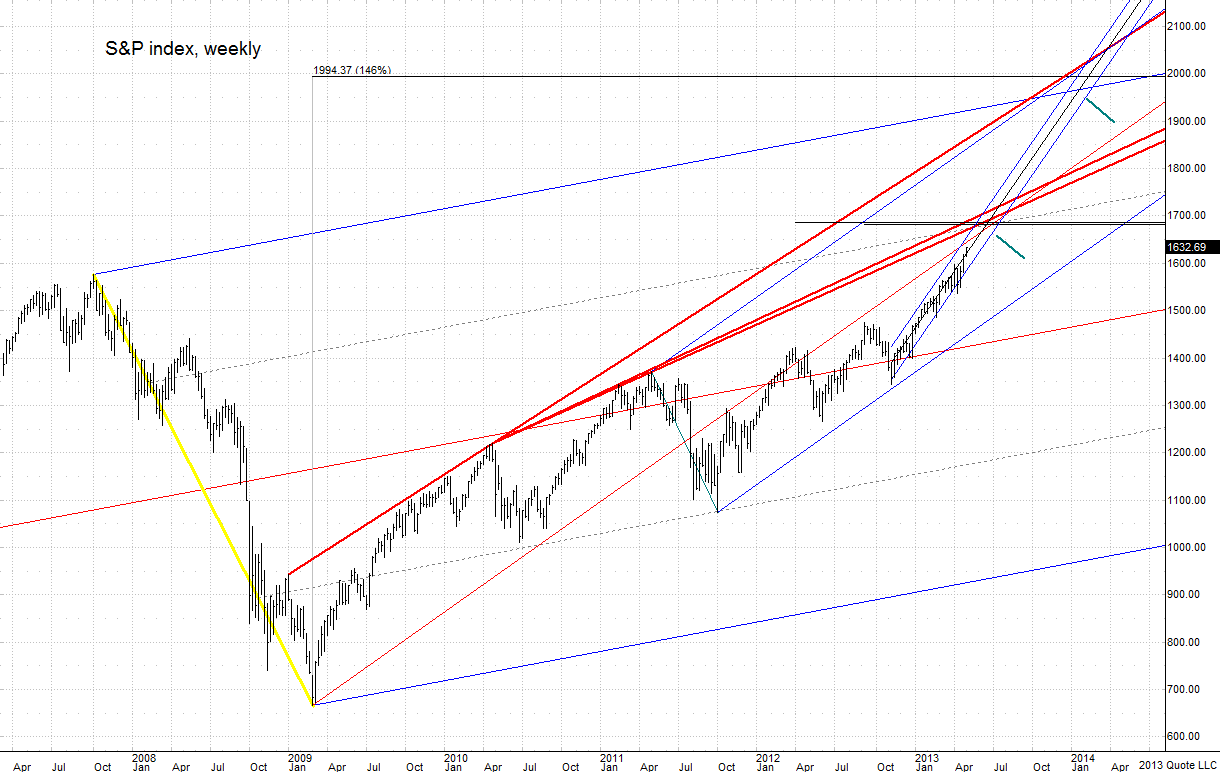
Chart created on QCharts, courtesy eSignal