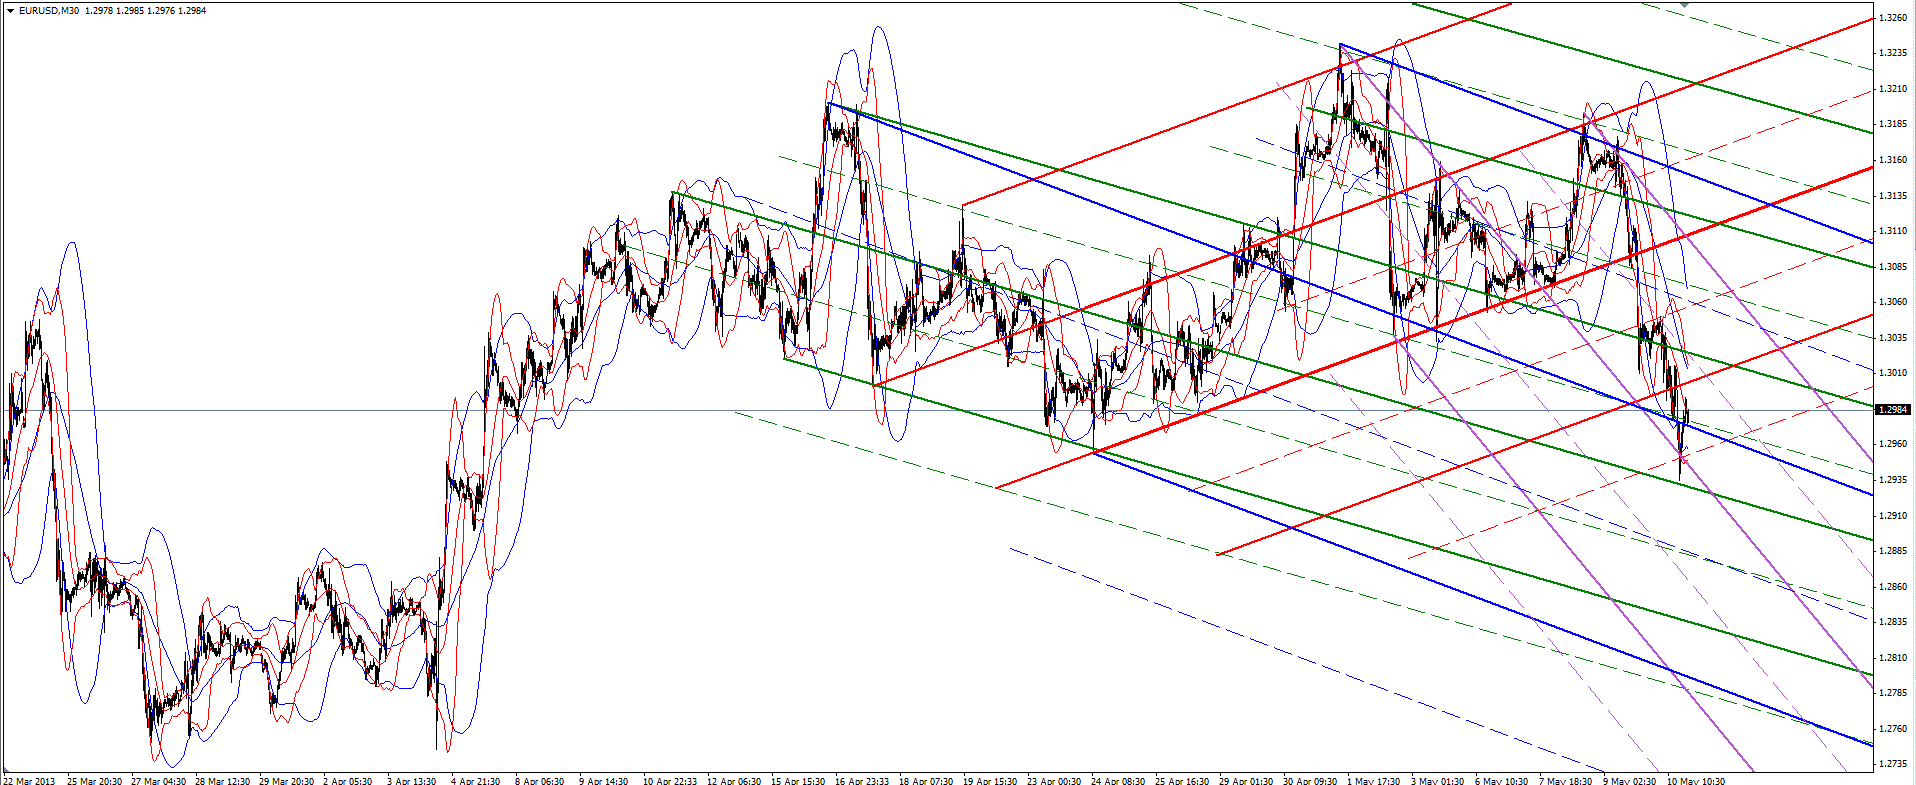
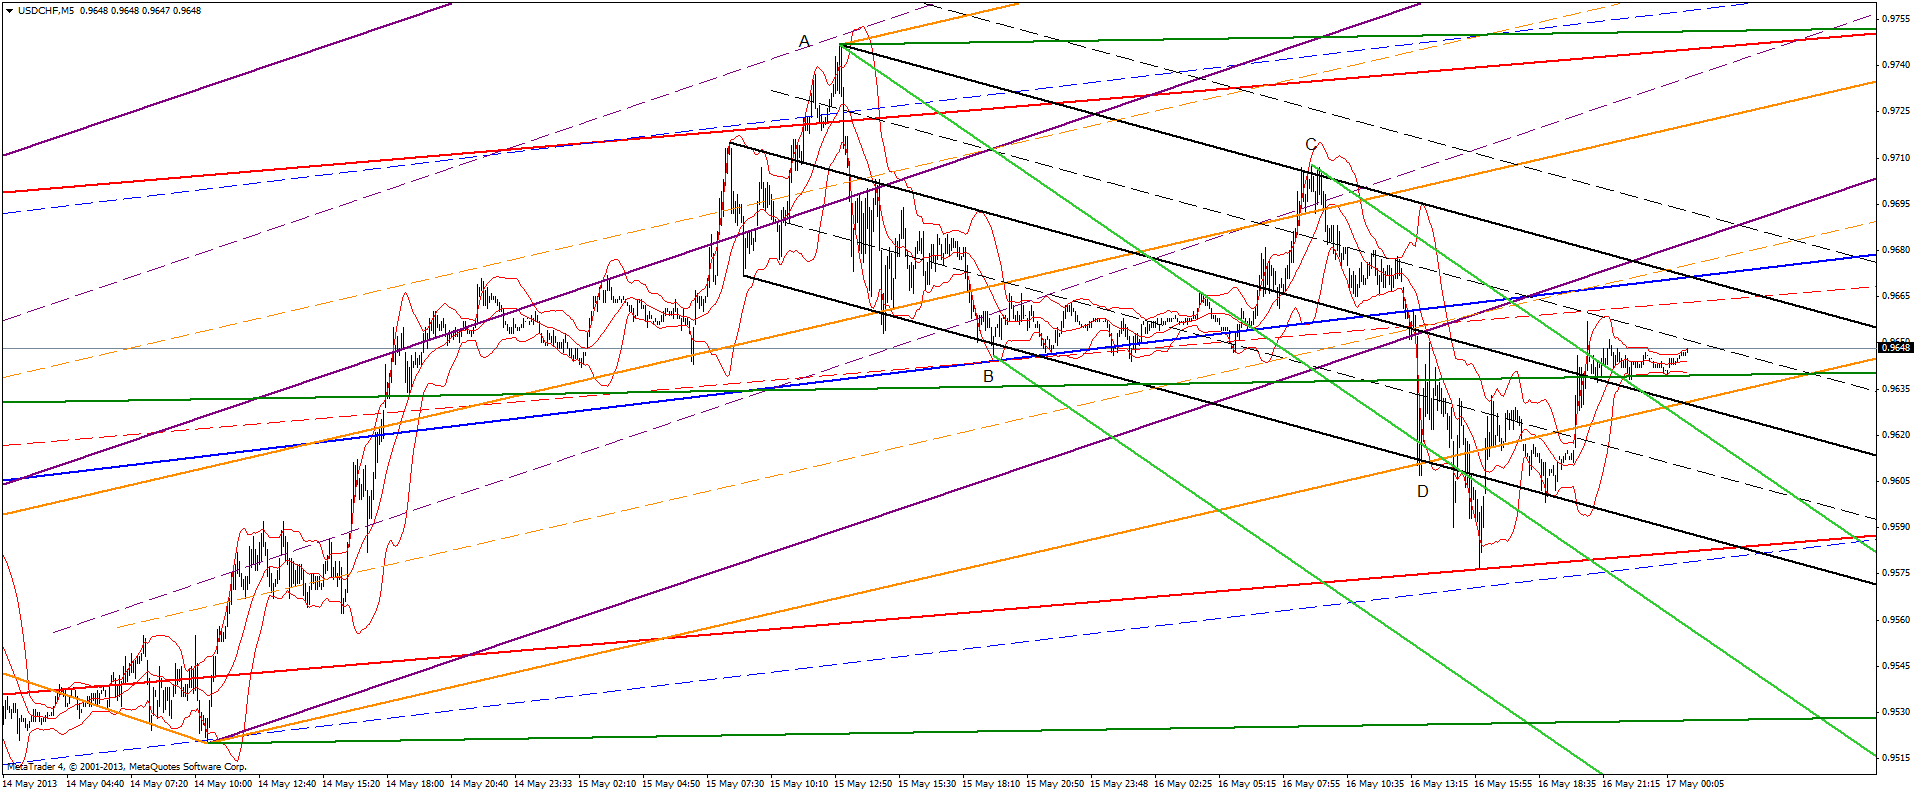
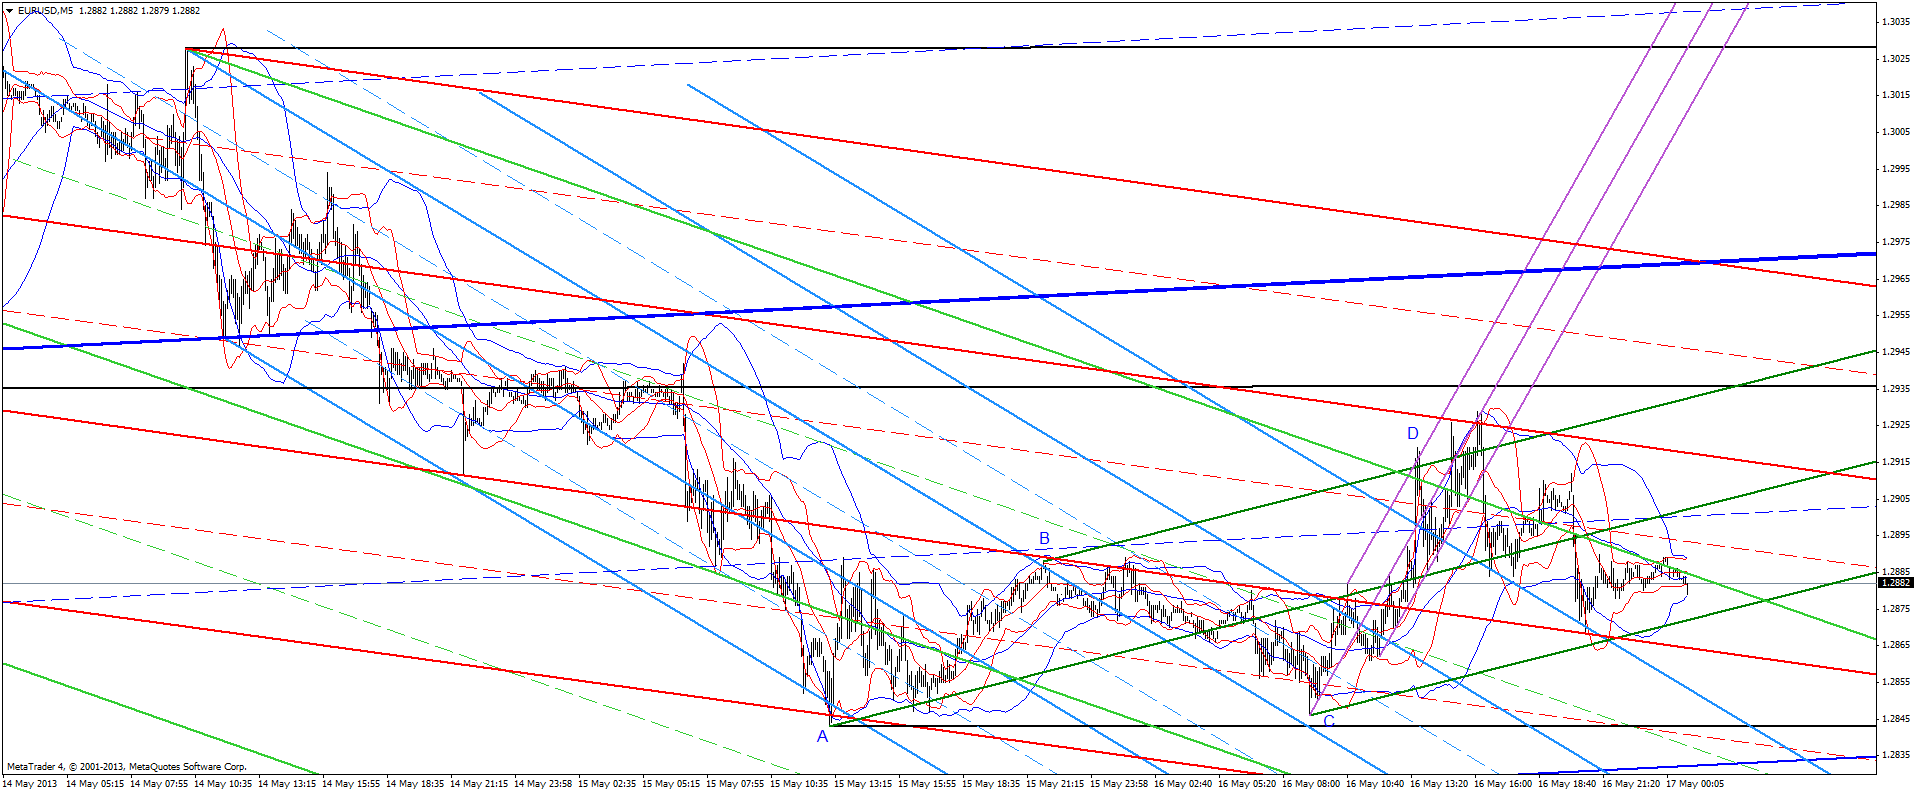
I have some new ML sets for Euro, but the old green set provides the best precision so far.
MA
MarcinO
Rep: 67
Posts: 5,506
I don't know how you get this points, but I know you are right ,Jim. I enjoy this forum...
Originally posted by jimkane
Getting right in there.
Chart created on QCharts, courtesy eSignal.
JI
jimkane
Rep: 3,058
Posts: 33,089
It's tough to precisely define where the overhead area is for this (for management purposes). 64.25 is the first part of the area (and it's a key thing). 65.50 is something. But, things come in up to 71.25. A big grouping of things is around 68.00-69.25. So, somewhere in all that is the best I can do. Sometimes things hit right on top of each other, sometimes it's a more broad area. Now it's all about price action.
JI
jimkane
Rep: 3,058
Posts: 33,089
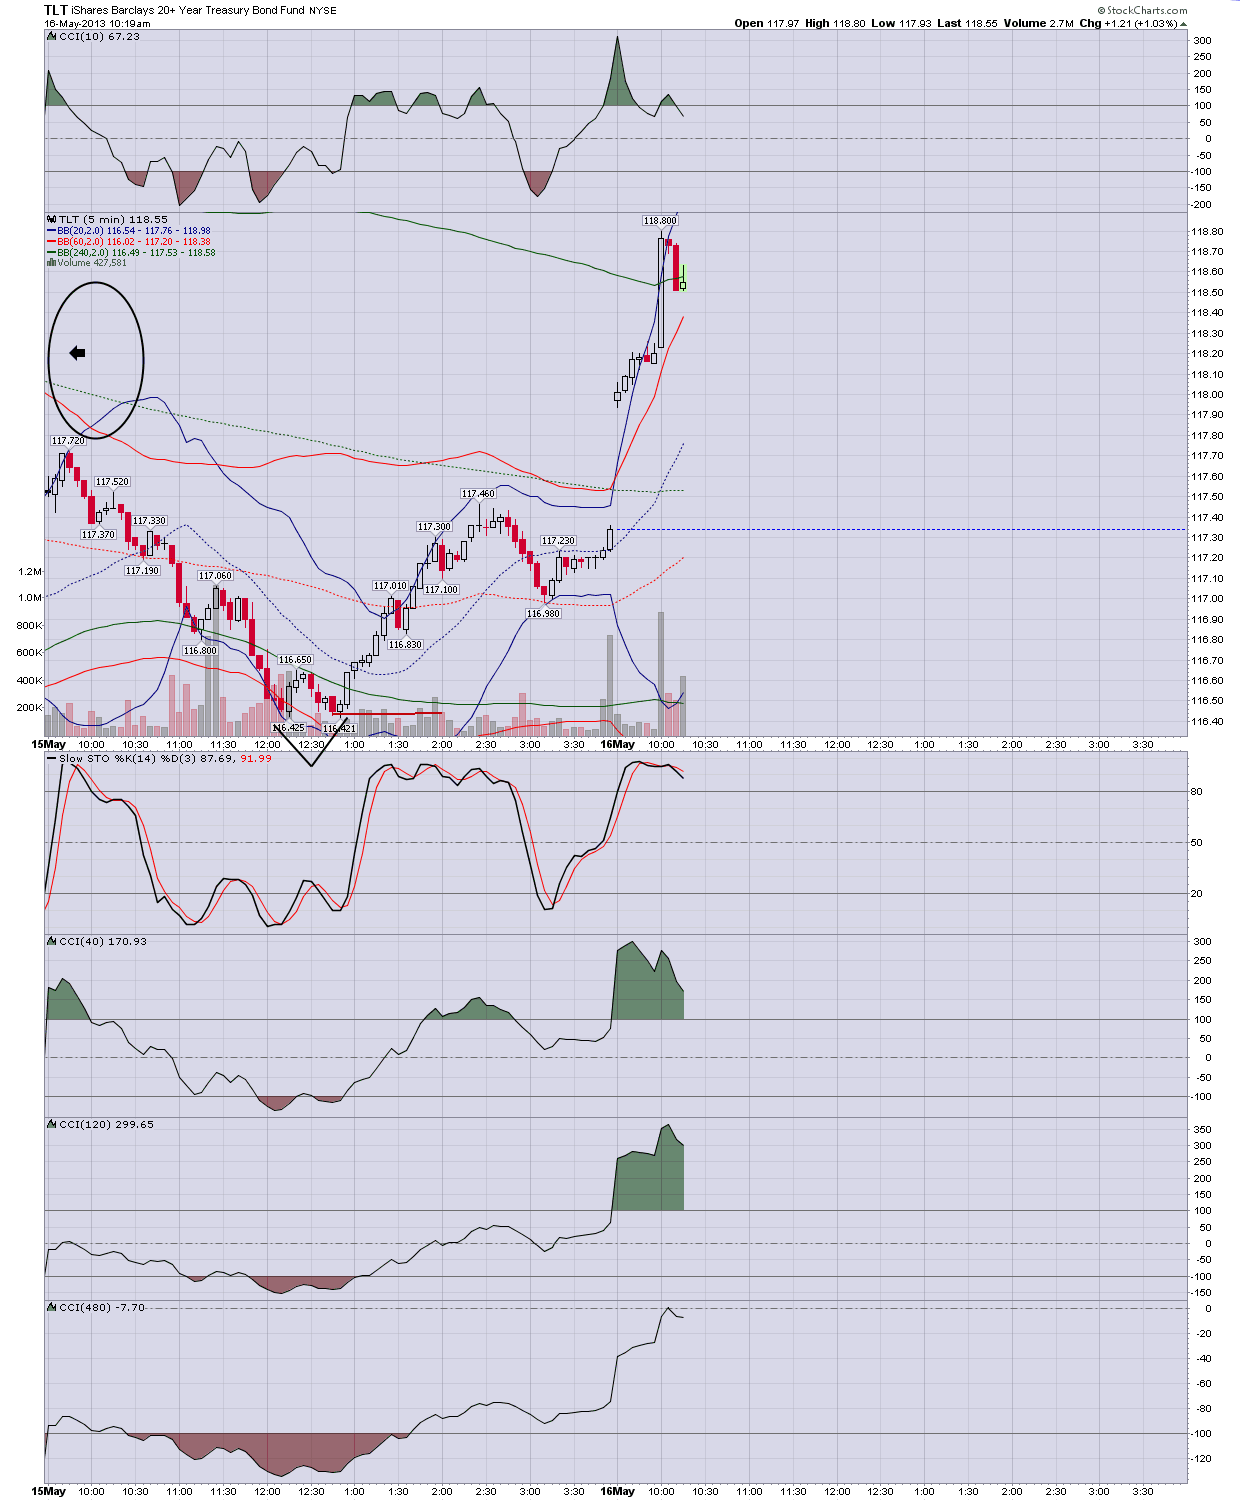
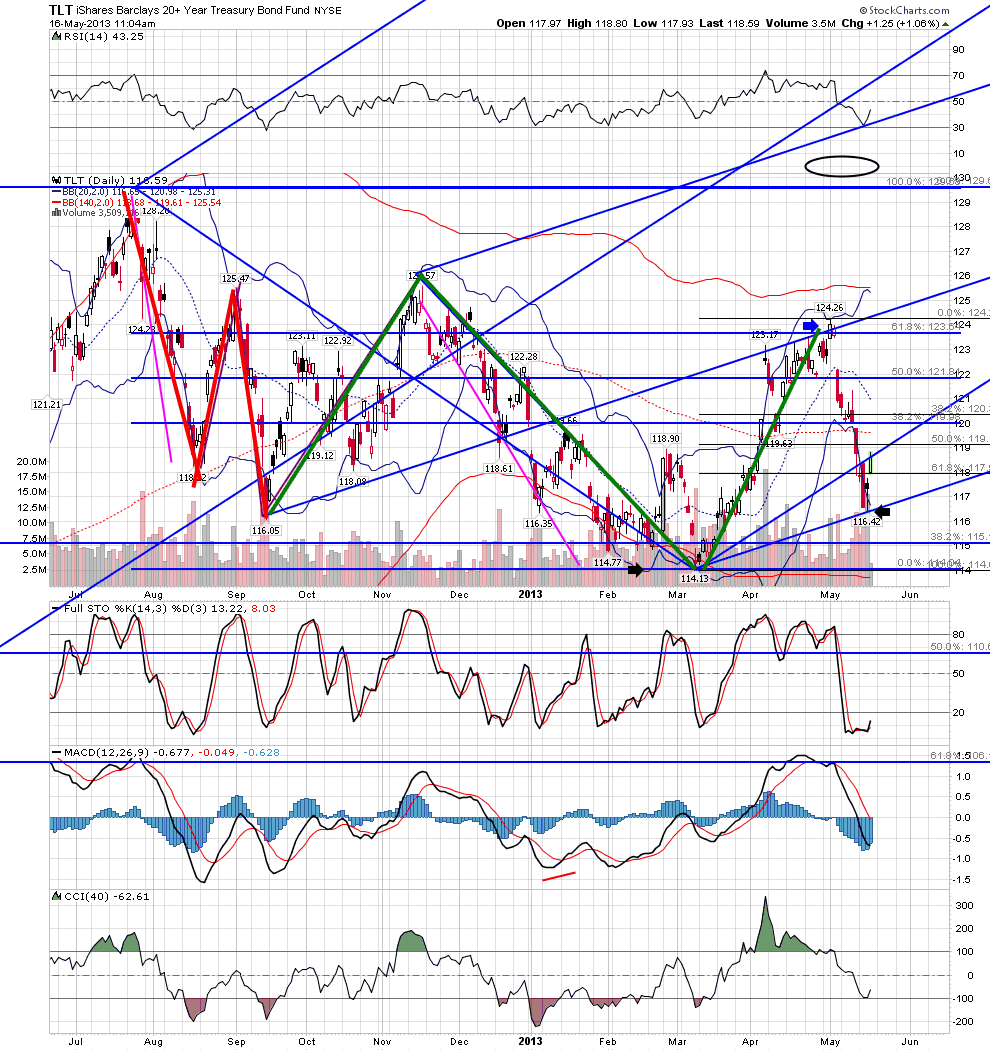
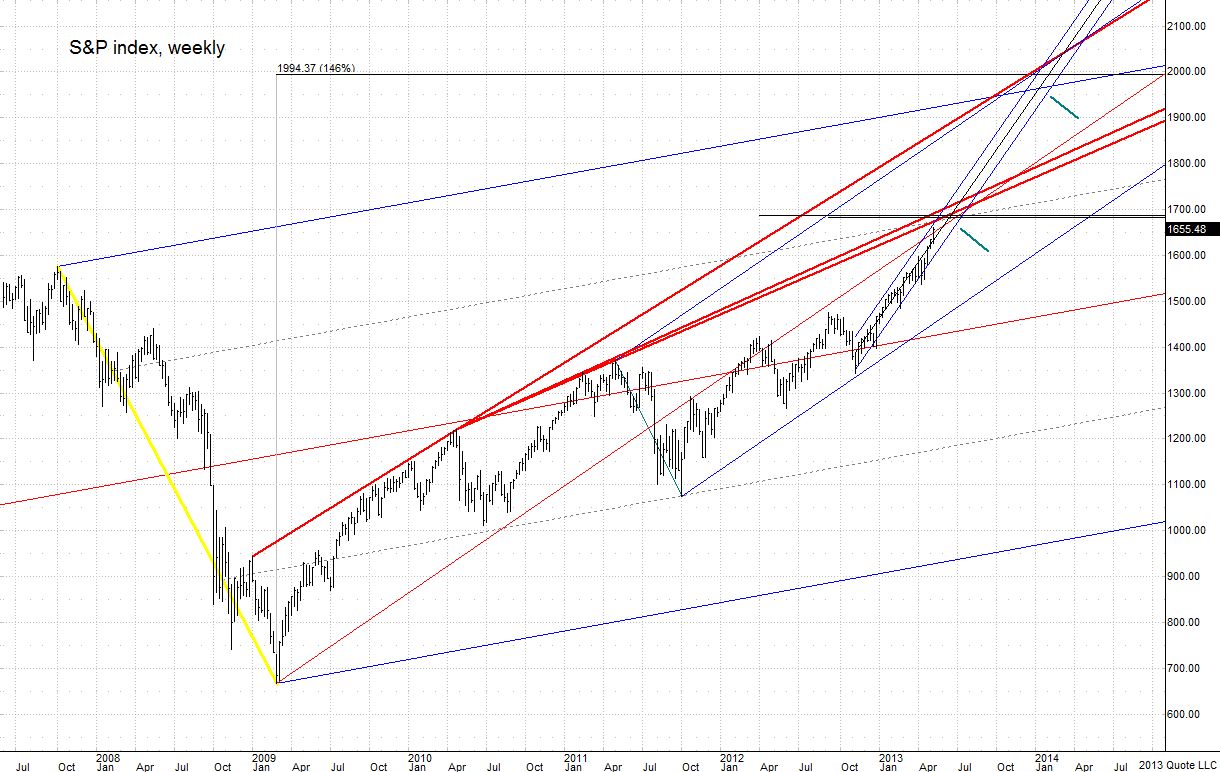
BTW, a lot of the above (except some spike and flow lines) is from the immediate short-term action. This is all in the 'context' of the bigger layout as shown on the S&P index chart.
JI
jimkane
Rep: 3,058
Posts: 33,089
66 is the 1.460 ext ret, right at a key SL. It's just one big layer up in here. I wish it could hit that other end around 71, but 68-69 is just loaded with key stuff. It looks tired, but Friday close, you never know how much it could have left.
JI
jimkane
Rep: 3,058
Posts: 33,089
65.50. Dual lines hit. Key factors. Now we see. 65.50, if broken decisively, is a continuation signal for the rest of the session, but the session is almost over...
JI
jimkane
Rep: 3,058
Posts: 33,089
65.75. Looks like that may be it, unless they do some crazy burst in the after-cash. So, although I wasn't able to define the area with near the precision I feel I usually can, the less precise area was quite clear. Instead of the morning run they did the 14:00 Friday afternoon run. And off the low from yesterday at the ABCD it was 19.75 points. Pretty close to the 20 I usually mention. All is as it should be.