ES 5-17-13
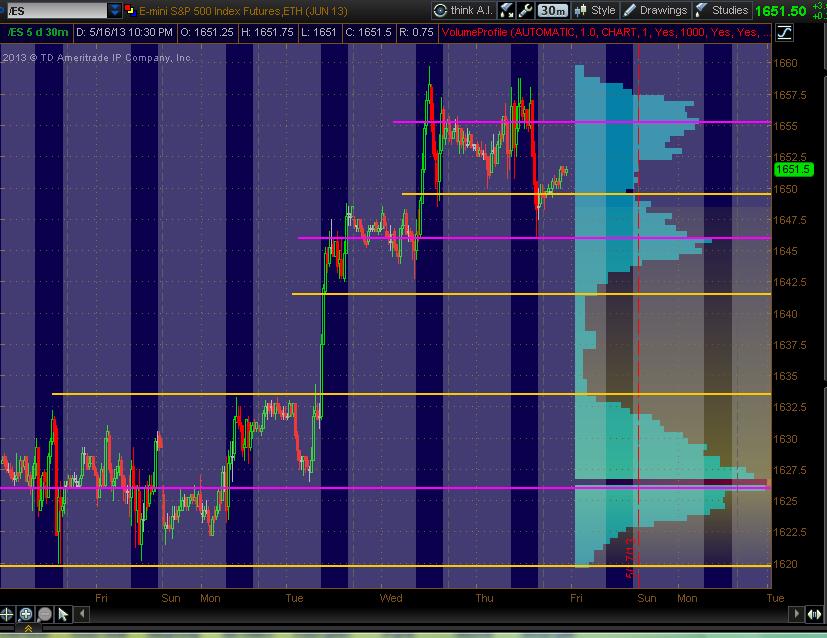
Posting my 5min chart from Thinkorswim showing 5 days with Volume Profile. The point is to initiate a conversation of what different software packages show as HVNs and LVNs. I've drawn lines at price levels for both HVNs and LVNs. Since Bruce is educating so many of us, I thought it would be useful to compare what I and the rest of us have with Bruce's software and price levels for Volume Profile analysis. This is an open door for folks to post their screen shot of the same. Here's what I have with All Trading Hours for 5 days on a 5min chart:
Magenta is where I see HVNs and Yellow is where I see LVNs
Bruce and anyone else share what you've got with a screen shot. This is how we learn folks!
Magenta is where I see HVNs and Yellow is where I see LVNs
Click image for original size
Bruce and anyone else share what you've got with a screen shot. This is how we learn folks!
YW. Don't know about all of the different inputs and how it could or should adjusted etc. Other Youtube vids looked like they had a variety of "input" numbers. If anyone here knows what might be the best way to set up VolProf in TS ... espec. based on the above vid instructions, feel free to post ideas.
Emini Day Trading /
Daily Notes /
Forecast /
Economic Events /
Search /
Terms and Conditions /
Disclaimer /
Books /
Online Books /
Site Map /
Contact /
Privacy Policy /
Links /
About /
Day Trading Forum /
Investment Calculators /
Pivot Point Calculator /
Market Profile Generator /
Fibonacci Calculator /
Mailing List /
Advertise Here /
Articles /
Financial Terms /
Brokers /
Software /
Holidays /
Stock Split Calendar /
Mortgage Calculator /
Donate
Copyright © 2004-2023, MyPivots. All rights reserved.
Copyright © 2004-2023, MyPivots. All rights reserved.