MyPivots
Sign In
MA
MarcinO
Rep: 67
Posts: 5,506
Click image for original size
RA
rat89
Rep: 0
Posts: 7,015
Click image for original size
RA
rat89
Rep: 0
Posts: 7,015
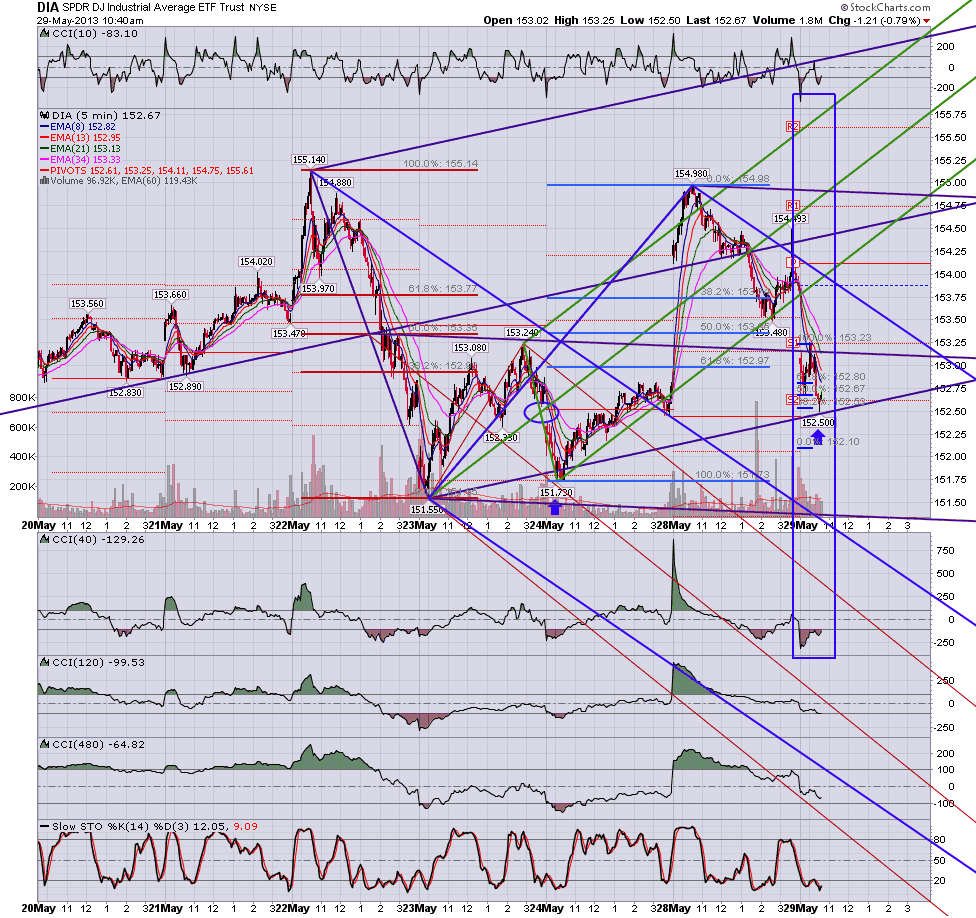
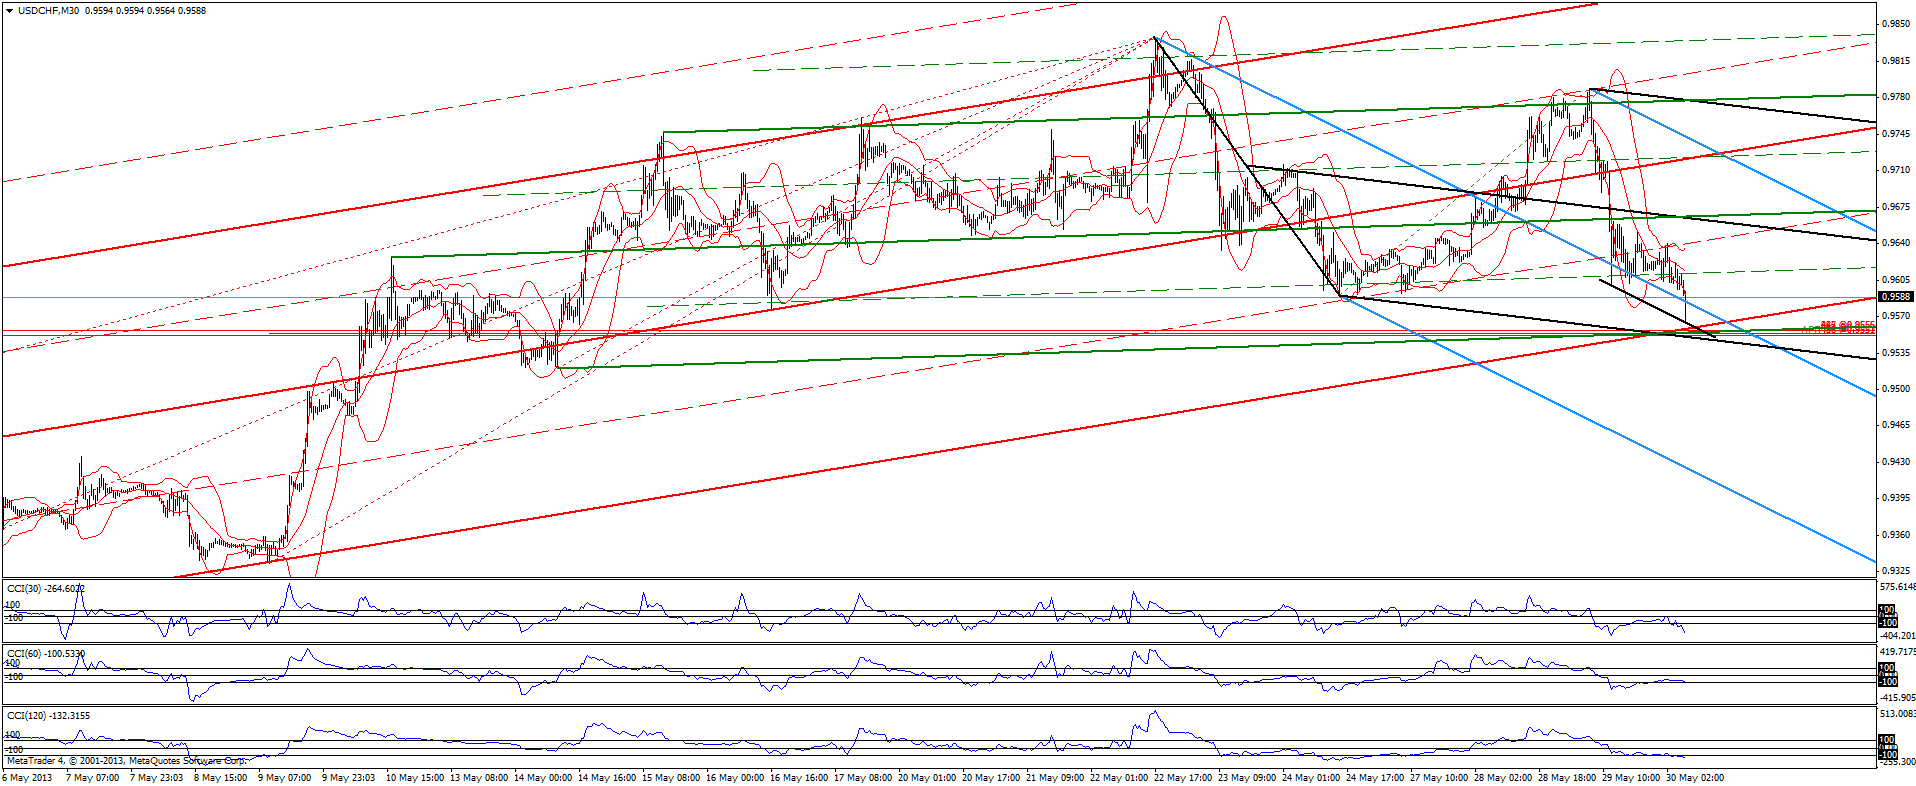
.768 and 1.27 at lower line with cci + divergence at S2

Click image for original size
RA
rat89
Rep: 0
Posts: 7,015
nope......going for downside targets after all
RA
rat89
Rep: 0
Posts: 7,015
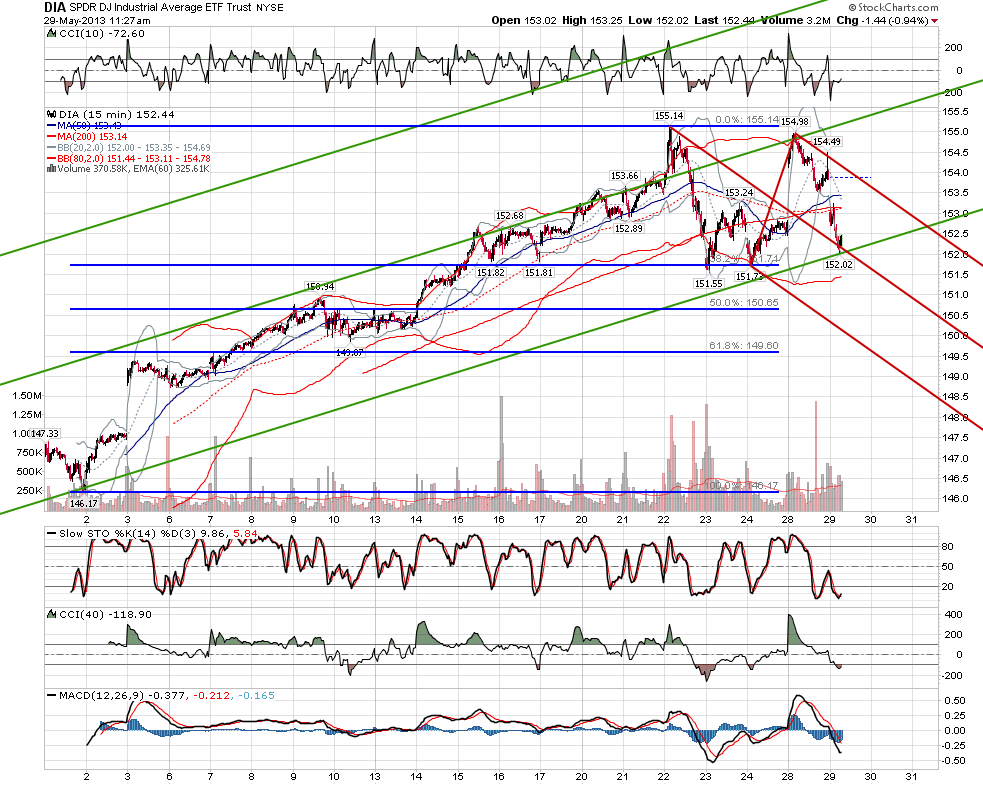
will they play off the .886 here?
Click image for original size
RA
rat89
Rep: 0
Posts: 7,015
if this is the trap that sends it back up, it's a beauty

Click image for original size
AL
albert
Rep: 99
Posts: 3,094
Originally posted by roofer

Click image for original size

Click image for original size


roofer,

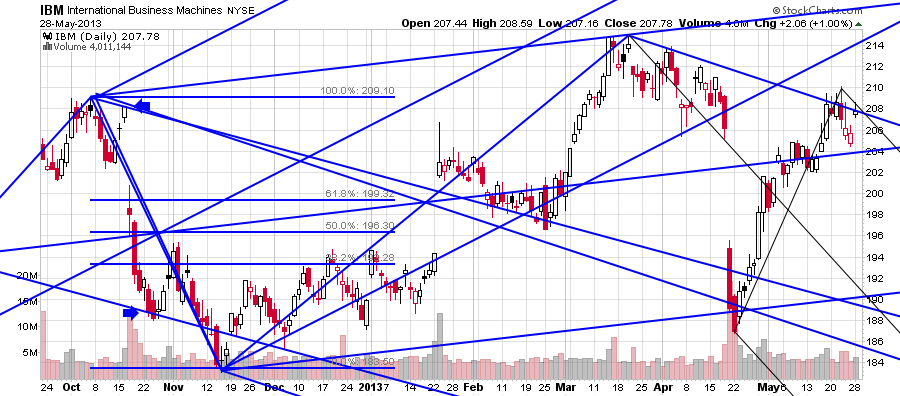
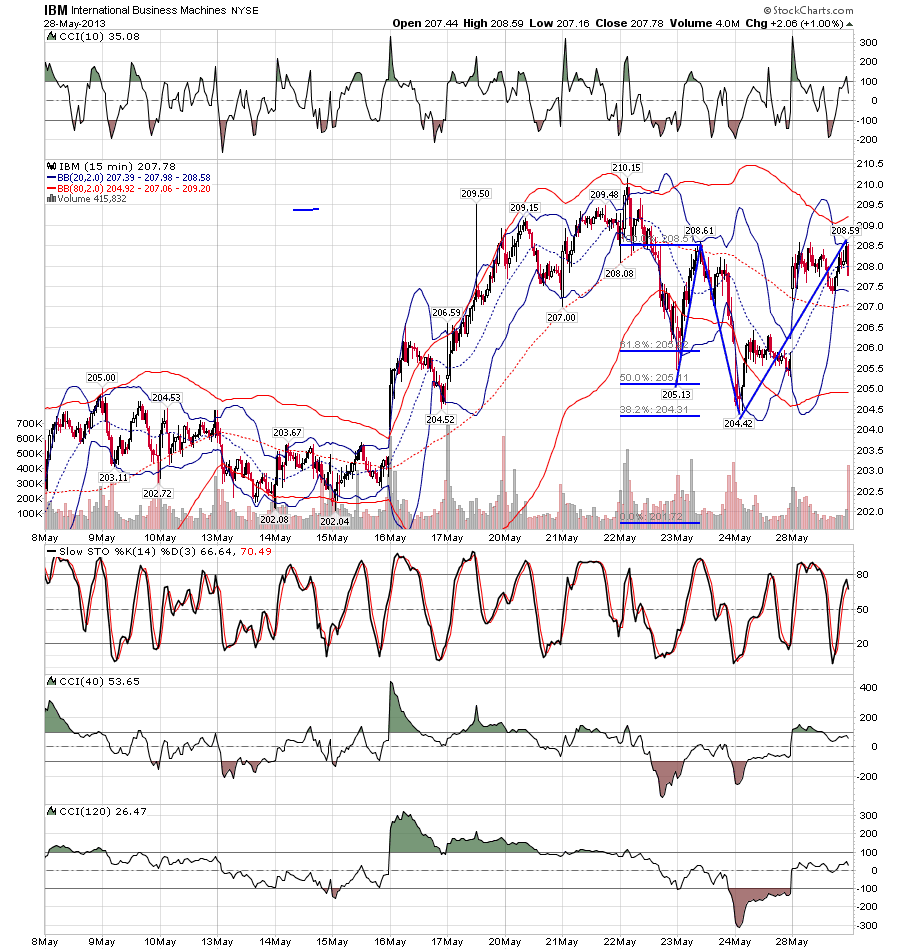
Very interesting IBM charts. Thanks for posting.

Al Kamego
MA
MarcinO
Rep: 67
Posts: 5,506
Click image for original size
RA
rat89
Rep: 0
Posts: 7,015
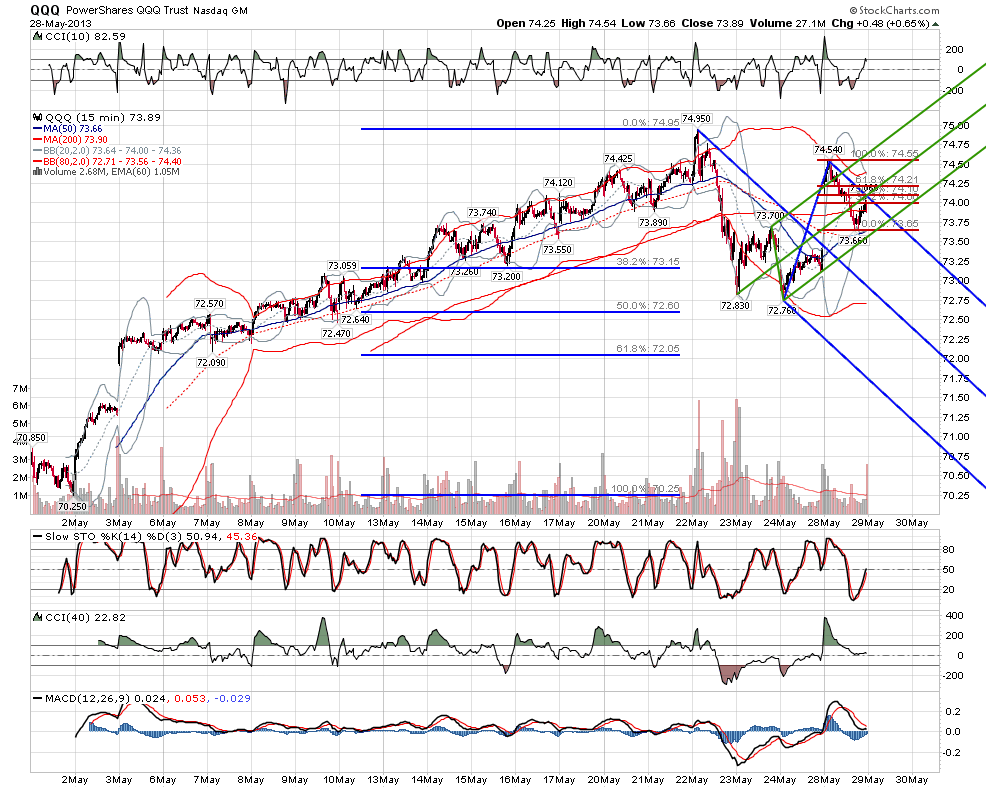
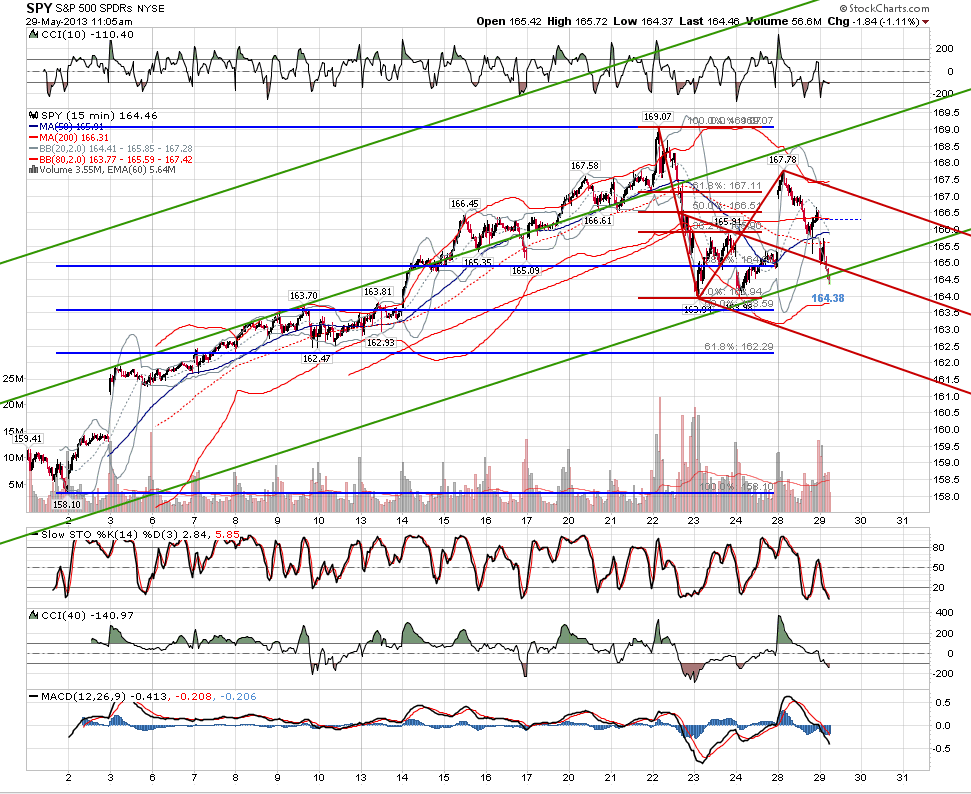
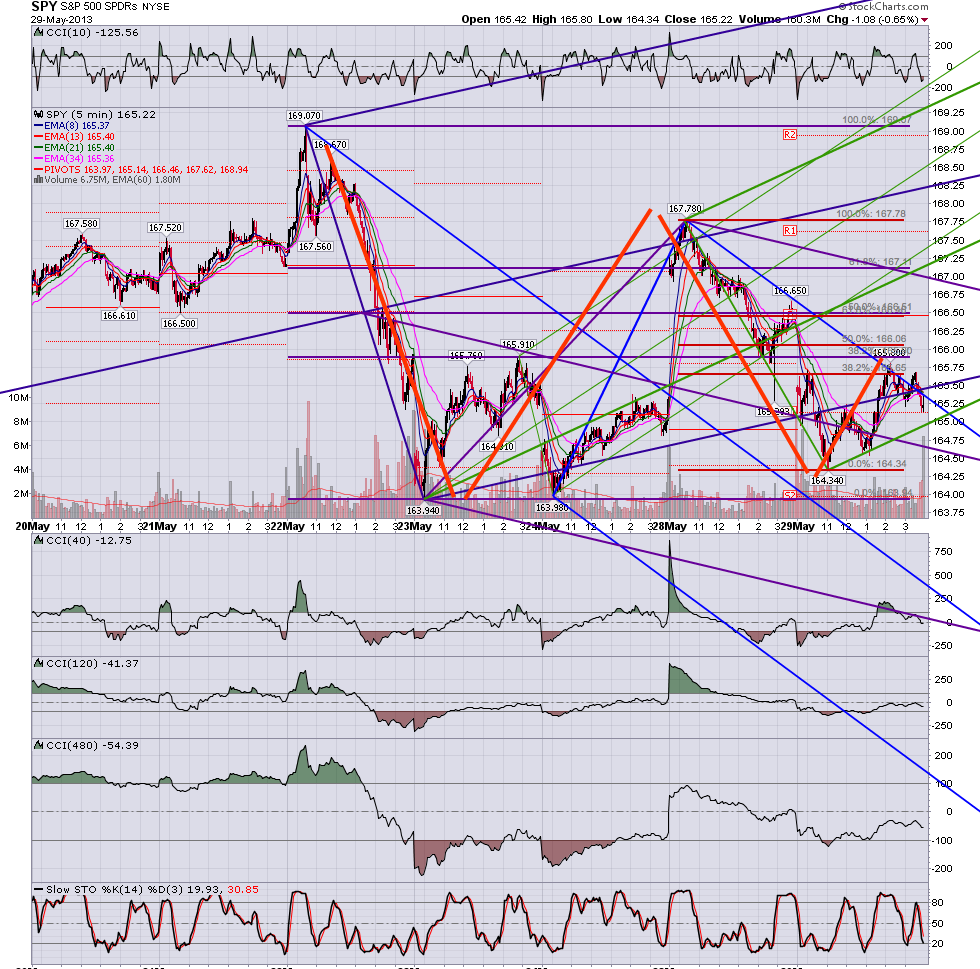
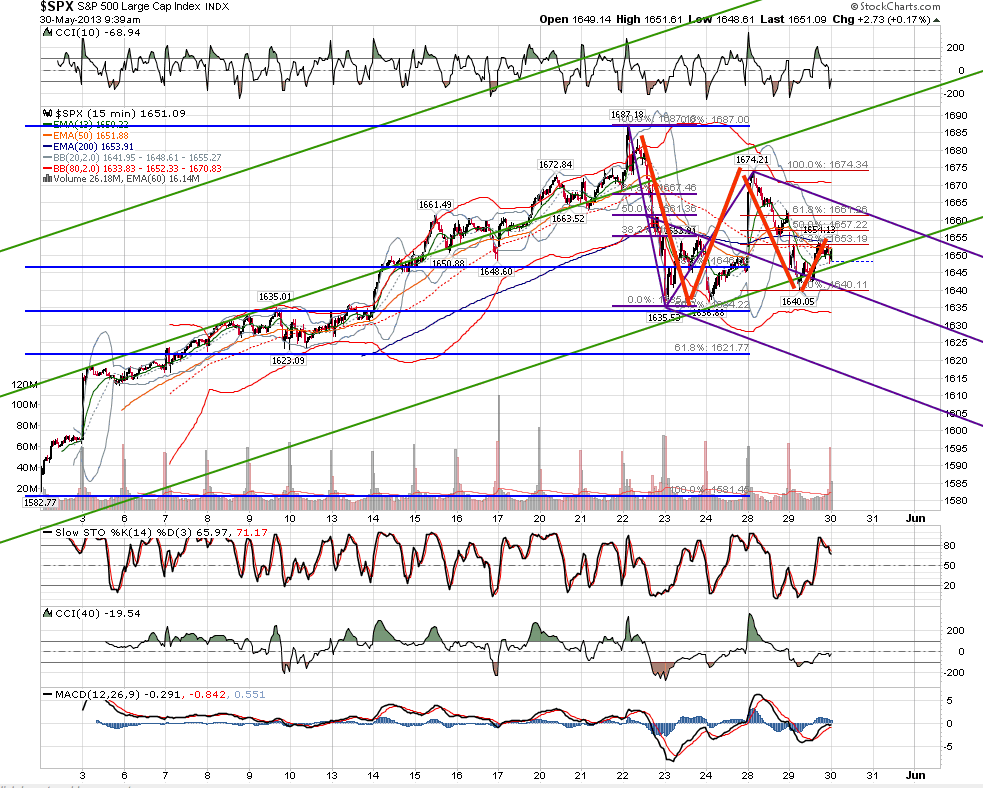
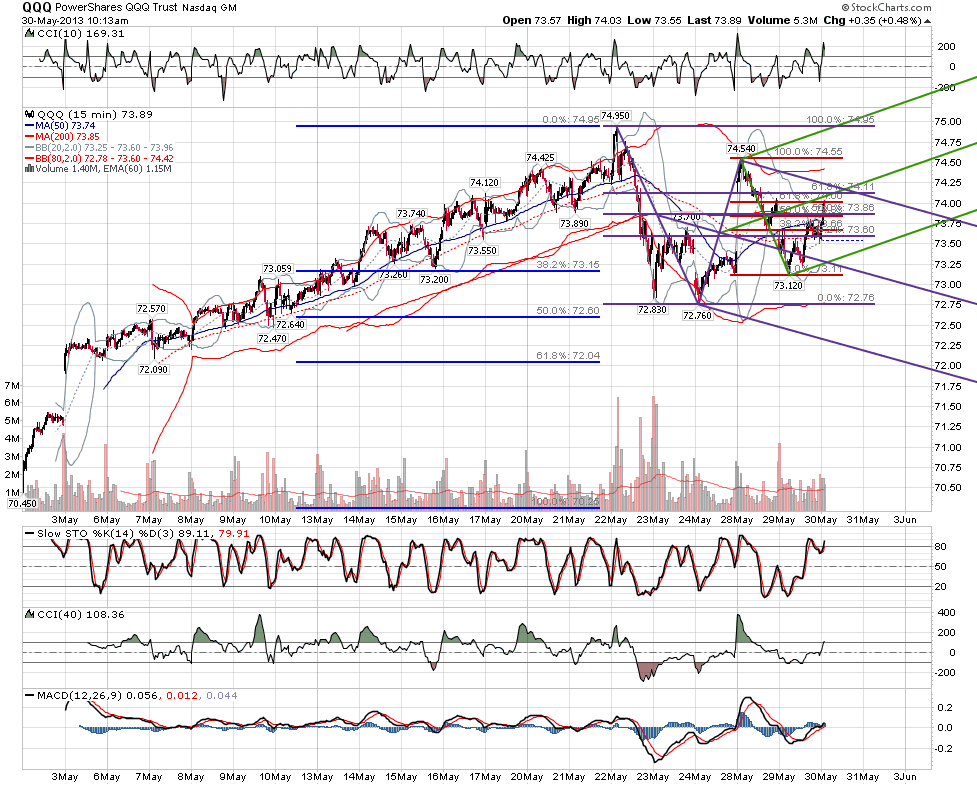
rule number one for me about managing a trade is to be very careful when an opposing trade sets up against your trade. there was a strong bull setup yesterday at the low, with support on the larger time frame.....what was troubling was that targets indicated by the short the day before weren't hit in a way that said trade over. so I am on my toes.....despite the explosive mini moves yesterday, there was not a deep well of energy.....and now here we are at an abcd into the zone around .382 which we know to be a most important area - as measured from BOTH prior highs.....a failure in this area could send it down to lower lines fast....


Click image for original size
MA
MarcinO
Rep: 67
Posts: 5,506
Thanks for this post, rat. It's very useful.
RA
rat89
Rep: 0
Posts: 7,015
good morning marcin


sorry, had wrong chart earlier


Click image for original size
Click image for original size
AL
albert
Rep: 99
Posts: 3,094
roofer,

sweet

Al Kamego