MA
MarcinO
Rep: 67
Posts: 5,506
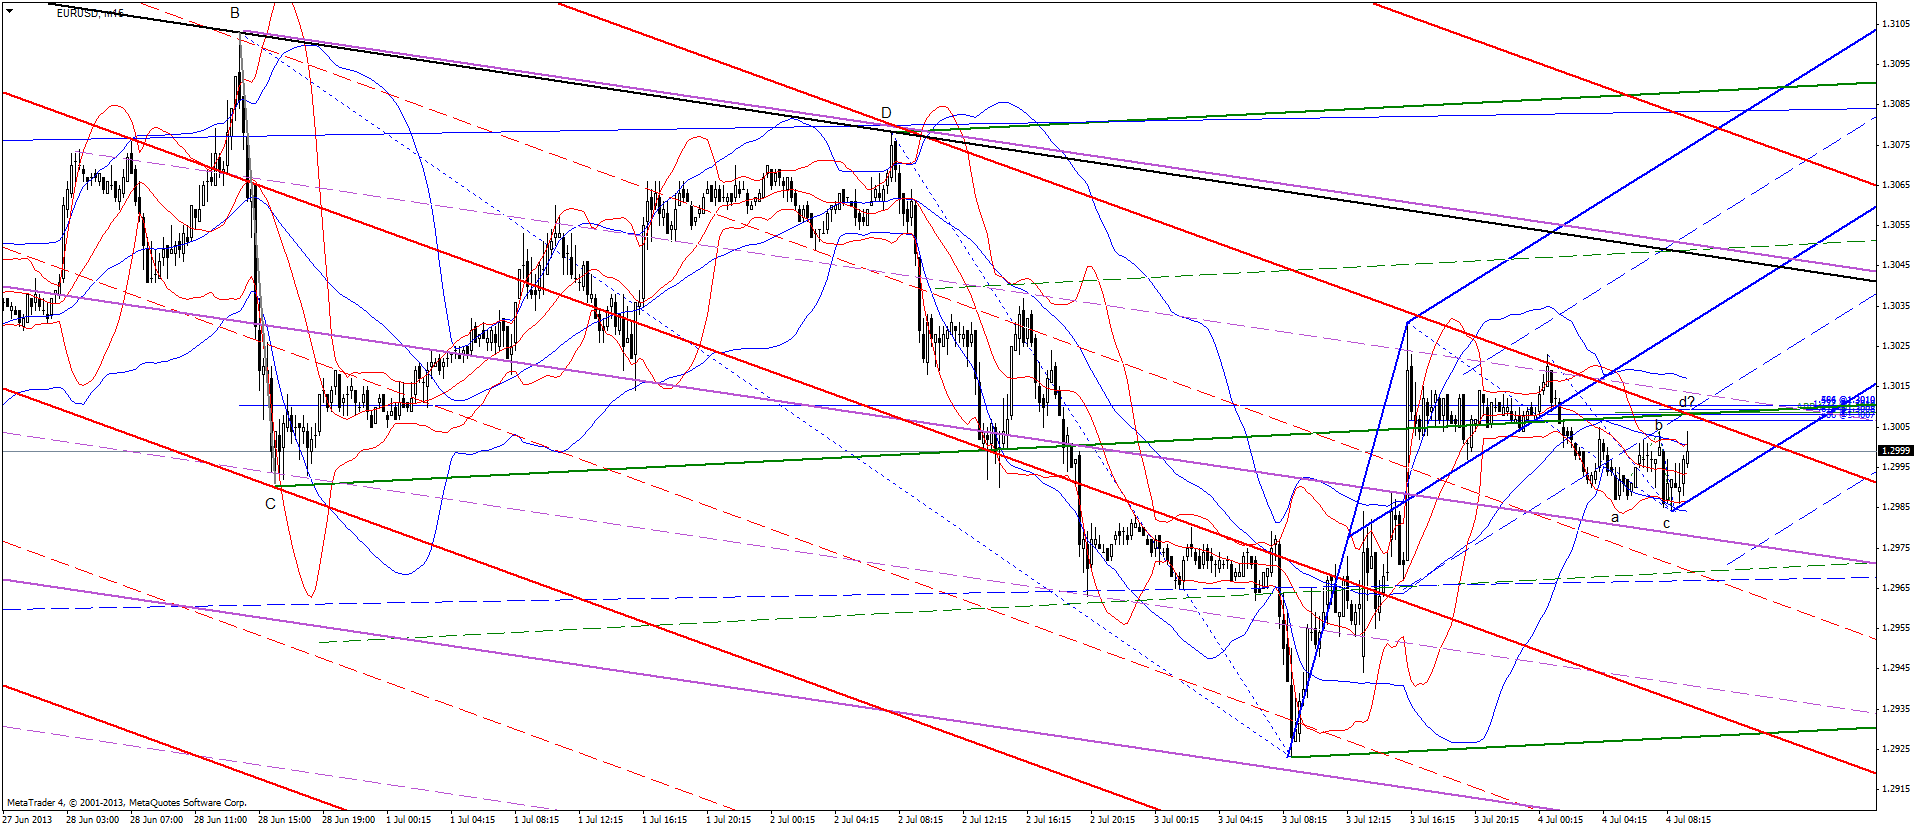
A set-up similar to the one in the previous chart.
Click image for original size
RO
roofer
Rep: 3,689
Posts: 3,574
re jim's bigger picture comments
all of what is going on is nothing new.re jim's reference to 1939.. read HITLER'S SECRET BANKERS....re the prep for civil unrest... am i the only one who noticed the lack of government response to katrina and sandy BUT in searching for two perpetrators after the boston bombimg WITHIN A DAY!!! the government was able to mobilize a massive police state civil liberty suspending presence.. it simply was an ideal practice situation for what is coming... i found myself asking where have all these people weapons uniforms vehicles been all along such that they could be mobilized so quickly?
i say to anyone who will listen that every day in every way we participate in the financial markets by trading and talking about it we are increasing the power of the elite... it makes me sick some days...but most of my reading and studying these past few years has been in response to a simple question.. why and how do people look, see a horror, then look away and allow that horror to continue? in that light i see the current horror as nothing new in human history. what is new, and what jim is pointing at is the infinite high speed computational and storage available to the elite to achieve their means...
if you think the brouhaha over paula deen is not part of this.. think again... i have spent my adult life in and around detroit... i have been called the N word so many times i lost count in 1978 i was even refused service at an all black restaurant because i was white..racism is not about race it is about power.. it is part of the fabric of our country.... but as a trial run, TO PRACTICE destroying someone who the common man might listen to, the elite has destroyed paula deen. i asked my german neighbors, who were oblivious to the paula deen situation and thought it was ridiculous when i exlained it, how might a similar thing happen in their country...they said that although it is a common thing to say well at least the nazis got that one small thing right... if someone recorded you saying that.. they could then destroy you by using the elite media to push the issue...
MA
MarcinO
Rep: 67
Posts: 5,506
It happens all over the world. In Poland you will be destroyed by main stream media, in vast majority leftists, if they allege you of antisemitism. Allegation itself is enough, the facts do not matter at all.
My favorite example is a famous journalist and writer, promoting traditional values and a free market without government interventions or privileges to any groups, e.g. banksters. Most of his books, some of them novels unrelated to politics, are bestsellers, but their reviews cannot be found in any top newspaper or magazine. The funniest thing about it is that they accuse him of antisemitism, although he publishes in a third consecutive magazine along with a former Israeli ambassador and Knesset (Jewish parliament) speaker, who has nothing against such a company.
The facts don't matter. They know that most people are unable to think on their own and therefore easy to manipulate.
The same media are useful in covering completely irrelevant issues, while the government introduces new law aimed at our money, freedom etc.
MA
MarcinO
Rep: 67
Posts: 5,506
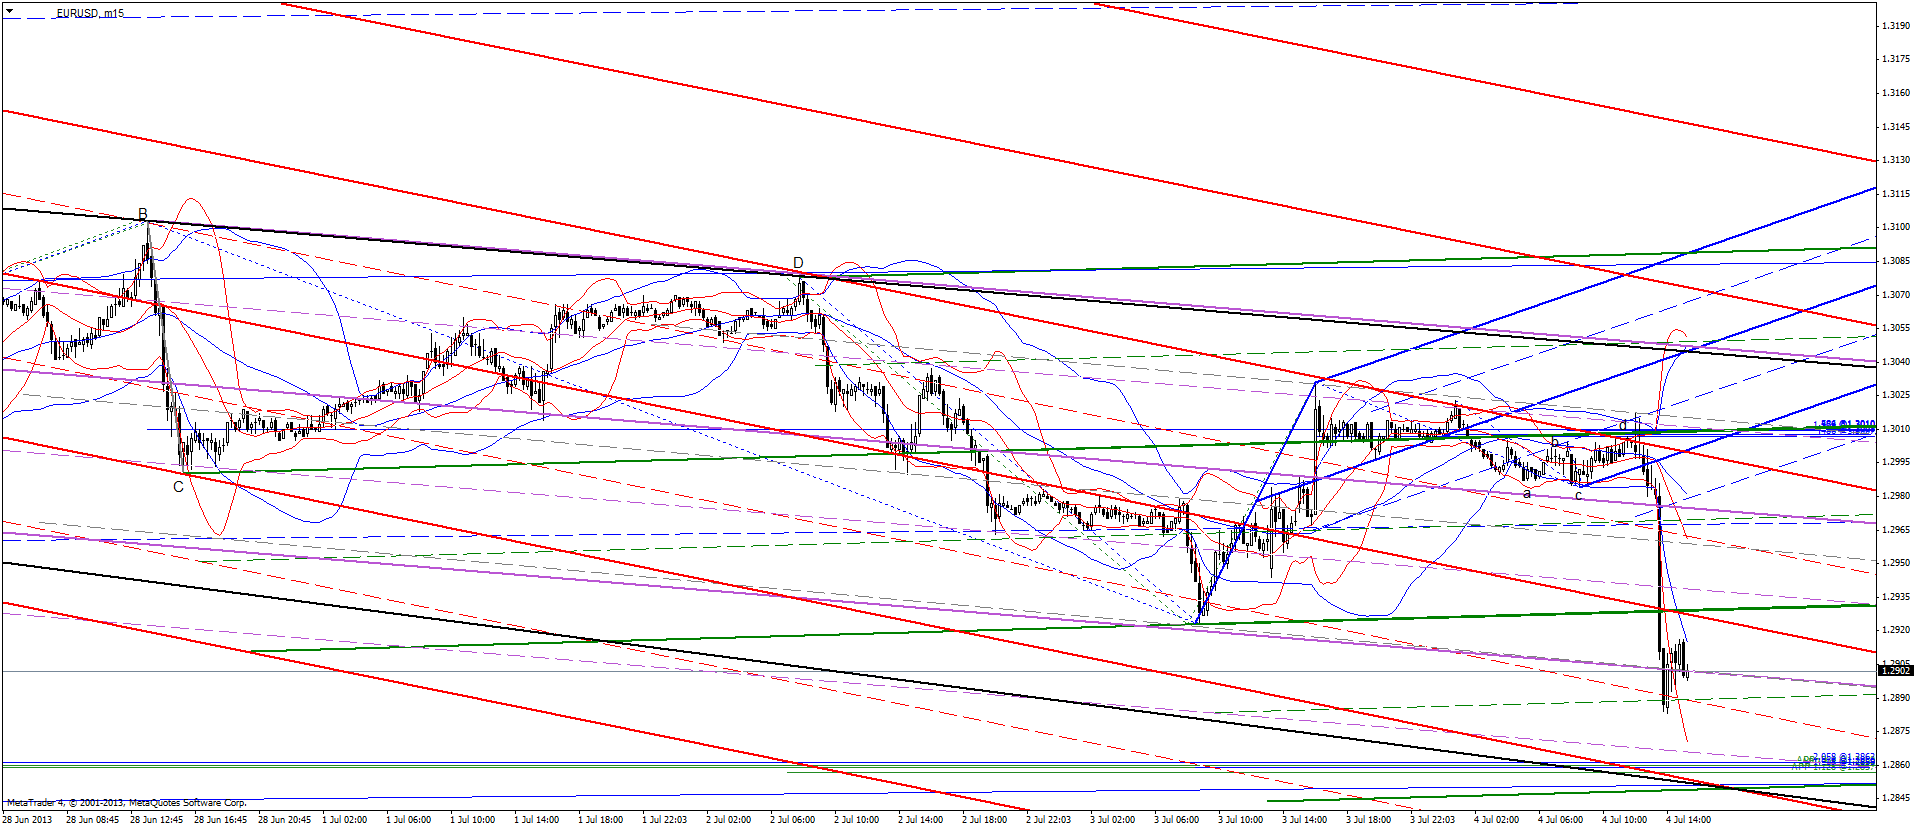
I have a 'target' area for the rest of my position in eursd, where Fibs grouping is about 10 pips over x-marks-the-spot. With a daily range well over 100 pips so far, looking for more accuracy would be hair splitting.
By 'target' I mean a price level where I would tighten SL.
By 'target' I mean a price level where I would tighten SL.
Click image for original size
MA
MarcinO
Rep: 67
Posts: 5,506
This is after the fact analysis, but may have some value, I believe.
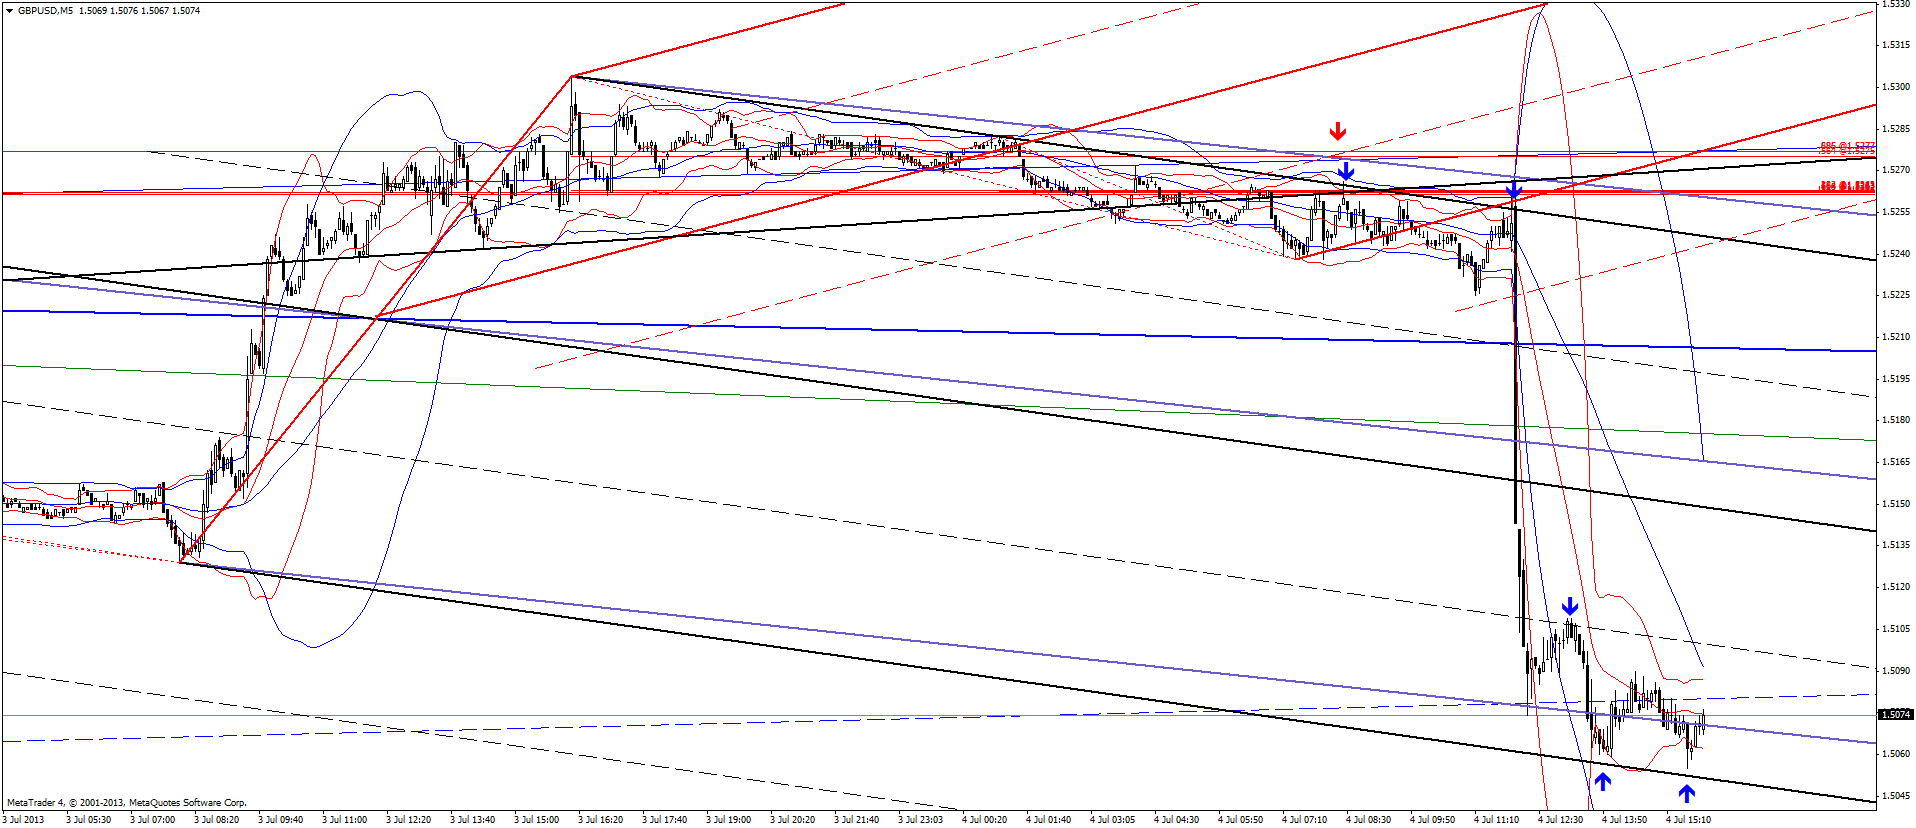
In the morning I was waiting for gdpusd to reach spot marked with a red arrow.
What I missed was an area 12 pips below (the first blue arrow), based on retest of ML set known to every Kane trader. When the price tested the line again (the second blue arrow) I was already aware of this ML set, but the price plunged so rapidly it was impossible to get on board.
Remaining arrows indicate points where price 'saw' the set.
Luckily, the eurusd trade comforted me a bit, but so far its range was about half what pound could give.
What's the lesson learnt? Once you have found a nice set-up, look for less obvious spots instead of admiring the chart you've created. It still happen to forget about it.
Click image for original size
JI
jimkane
Rep: 3,058
Posts: 33,089
Wow, okay, there are some others in here who do see what I am seeing for the country and the world. Good. All we can do is keep talking to everyone who will listen. At least we go down swinging in a sense, not just submitting. We go down trying to talk sense into people.
JI
jimkane
Rep: 3,058
Posts: 33,089
Here's what I have been saying. Look at that correlation. Just insane. If the S&P was valued 'fairly' like any small business in the community is valued, not with outrageous premiums... Seriously, go to the local pizza parlor or bookstore that's for sale and see if they value their business at a P/E of 15, 25, 50, 100, or even 1,000. Too funny. So, as I have said many times before, valued like a regular business, the S&P 'fair value' is around 400, based on my calculations. But the stock market has less than zero to do with 'fair value'. I just point it out for reference.
http://www.zerohedge.com/news/2013-07-04/guess-what-fair-value-sp
http://www.zerohedge.com/news/2013-07-04/guess-what-fair-value-sp
RA
rat89
Rep: 0
Posts: 7,015
one of the most valuable tools I learned from roofer....hopefully he won't mind if I try to show it here....
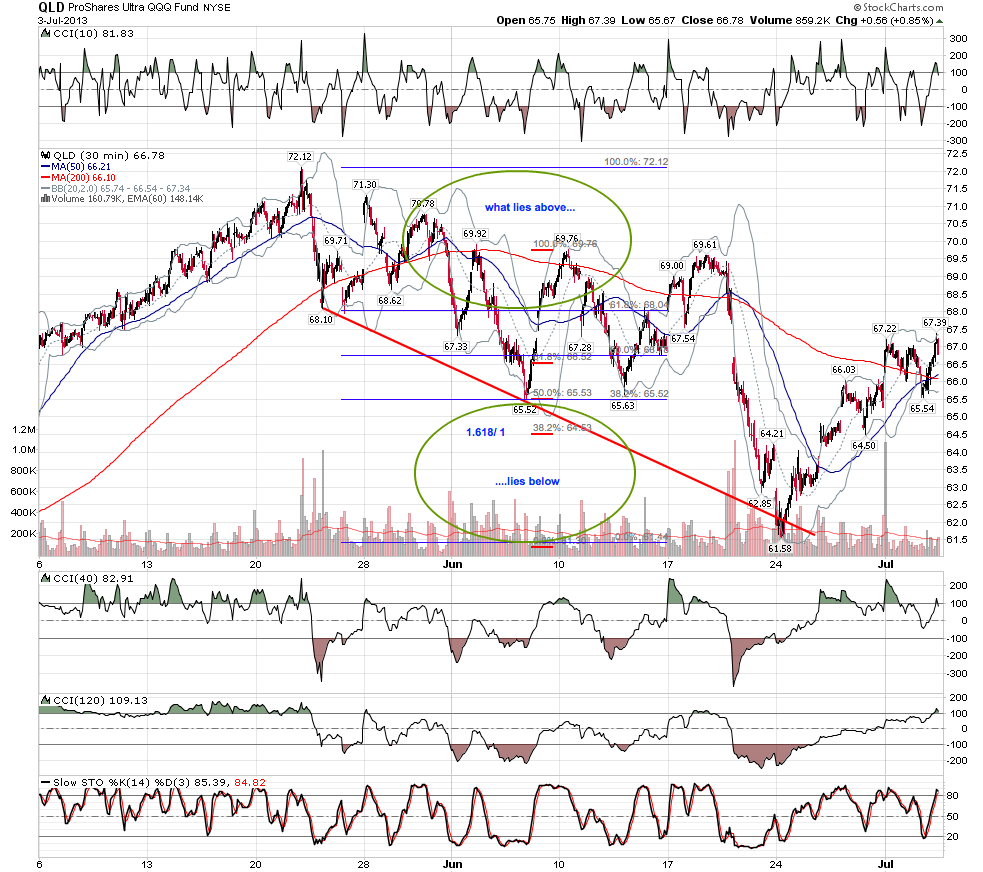
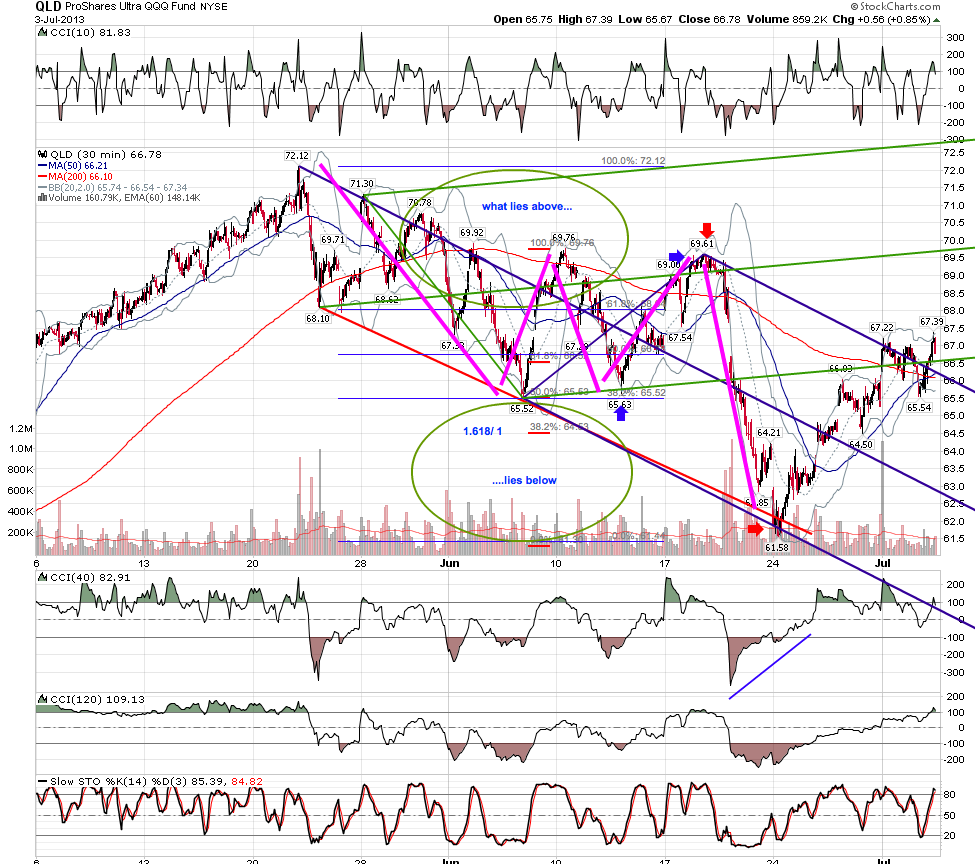
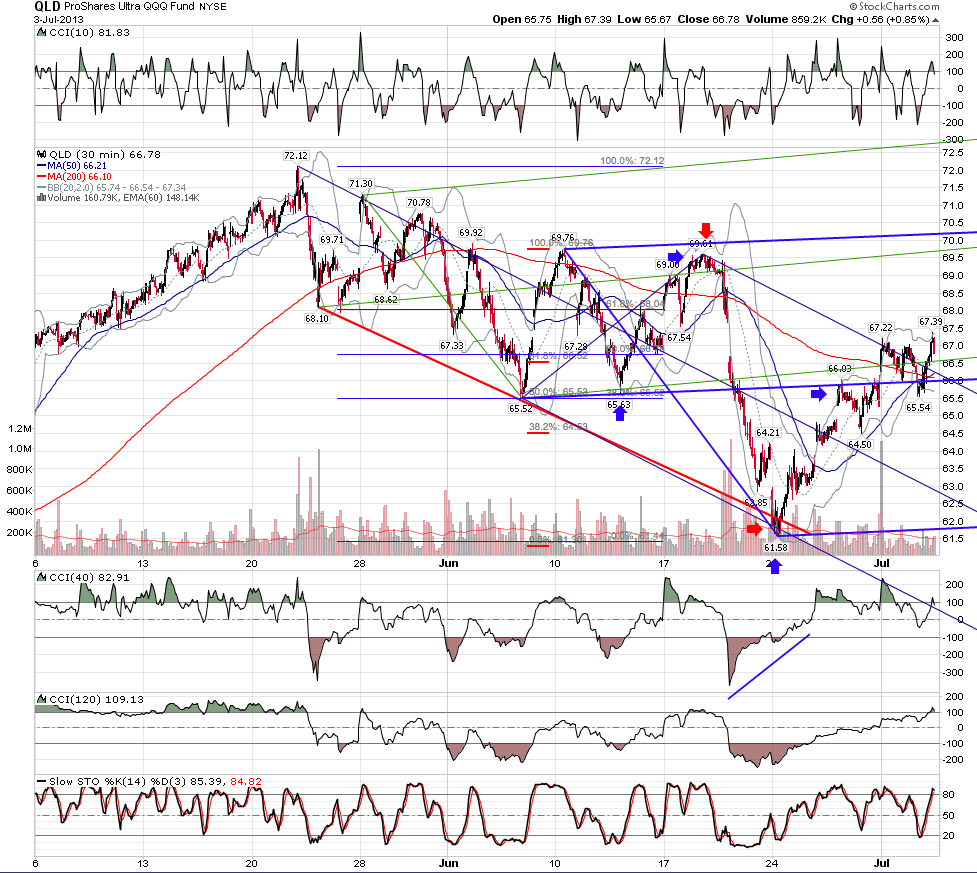
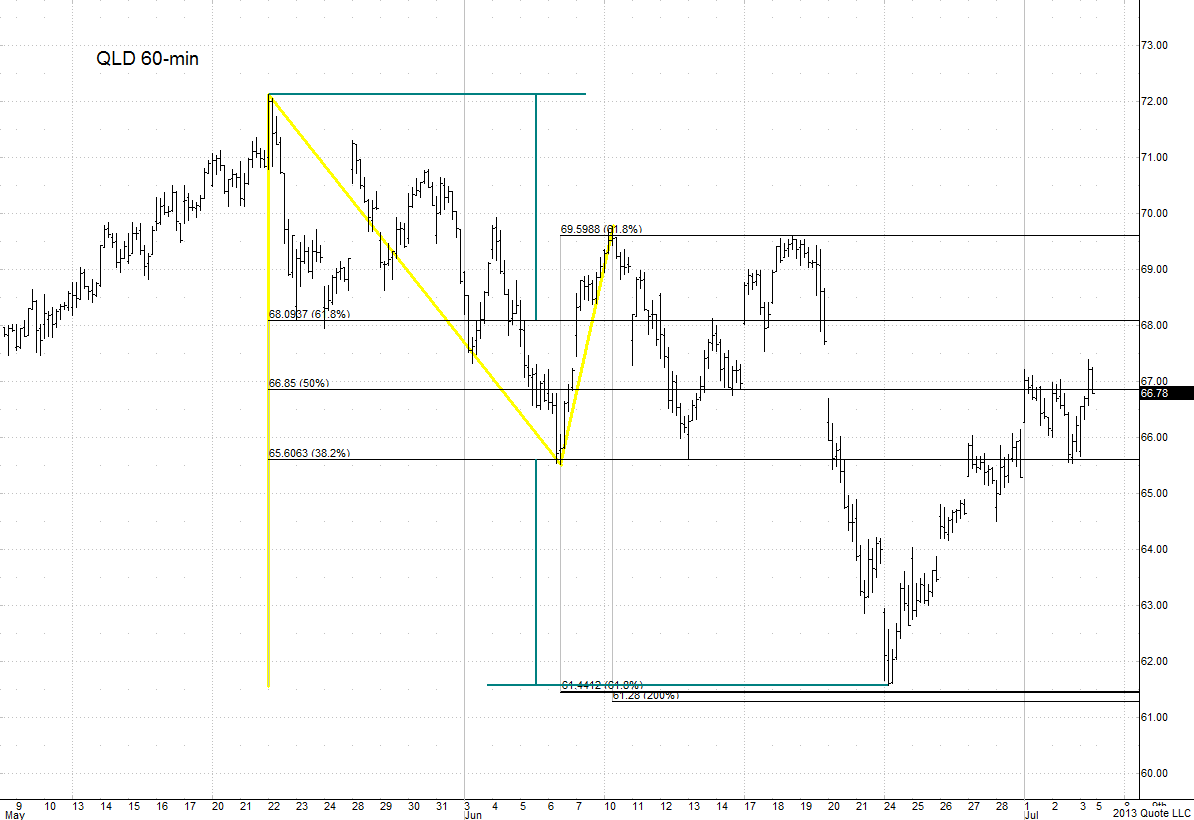
on a trend move, how do you look to find the possible end of the move? We all know how the abcd pattern into significant fib areas at lines with time against the d leg sets up a continuation move that reverses the d leg and heads to the b/c area if not further......here we have a move that accelerates and plays out to symmetry with the low being almost equally below the middle area as the high was above it......the abc mid area range is similar to the distance from the low that range to the low to come....I measure it with a double fib: blue measured from high to low of bc projects a 1.618......red from b or d high with .50 at a or c low projects an extension of 1.....hence 1.618:1
abcd is shown in magenta, one of the key lessons from Jim's work is the abcd continuation..... much to everyone's surprise, price appears to stop and turn in the middle of nowhere
Click image for original size
Click image for original size
Click image for original size
JI
jimkane
Rep: 3,058
Posts: 33,089
Yeah, that's cool, rat. At the risk of confusing the heck out of everyone, I'll do a little of what I did I think it was in Mar 2011 when I put together the diagram below and posted it in here to give my explanation of what roofer had posted at the time. Nothing against what you guys are doing, only that the way you have adapted the StockCharts tools to do this isn't the same as how I do it, and how most charting platforms (and my platform, QCharts) naturally do it, so I'll break this down for those that can't mentally adapt their platform (QCharts, eSignal, Ensign, Sierra Chart, etc.) to this.
Here's my diagram, showing what they are doing:
This is a very 'peculiar' alignment in that I don't see it too often (roofer likely sees it all this time). It's not so much that I don't see it, but that it requires an 'extended' ABCD, the 1.272 being closest geometrically. Although I trade 1.272 ABCD's, I prefer the less extended ones. It has a .618 expansion off the AB leg, and a 2.000 external retracement off the BC leg. These terms are consistent with what I presented in the books, and are consistent, basically, with Miner's work.
Let's look at this on the QLD chart. You'll have to mentally flip my diagram over for the bearish case here.
And here I've added rat's symmetry bracket to show it is, indeed, the same thing, done using the more conventional tools approach.
I hope this helps and doesn't offend anyone. It took me a long time to mentally translate this and apply it with my tools, even though I have seen it explained in here before and even did that diagram. I figured most readers would be lost, so I decided to add my two cents. What's important is the concept, one which I think roofer uses a lot, and how to apply it using the tools the readers are working with.
Charts created on QCharts, courtesy eSignal
Here's my diagram, showing what they are doing:
Click image for original size
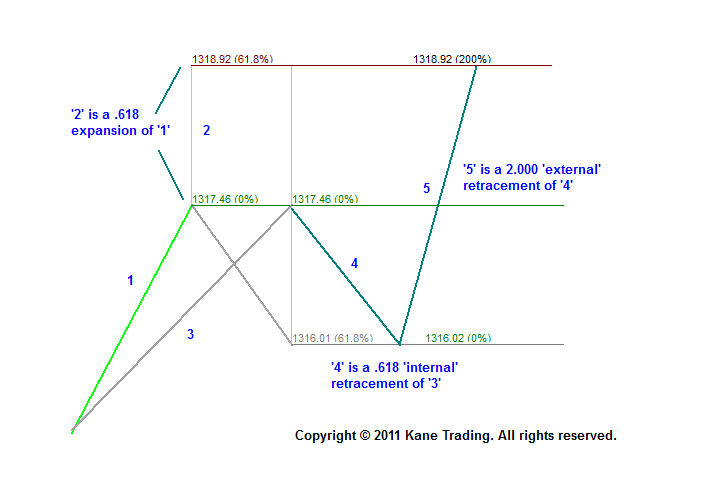
This is a very 'peculiar' alignment in that I don't see it too often (roofer likely sees it all this time). It's not so much that I don't see it, but that it requires an 'extended' ABCD, the 1.272 being closest geometrically. Although I trade 1.272 ABCD's, I prefer the less extended ones. It has a .618 expansion off the AB leg, and a 2.000 external retracement off the BC leg. These terms are consistent with what I presented in the books, and are consistent, basically, with Miner's work.
Let's look at this on the QLD chart. You'll have to mentally flip my diagram over for the bearish case here.
Click image for original size
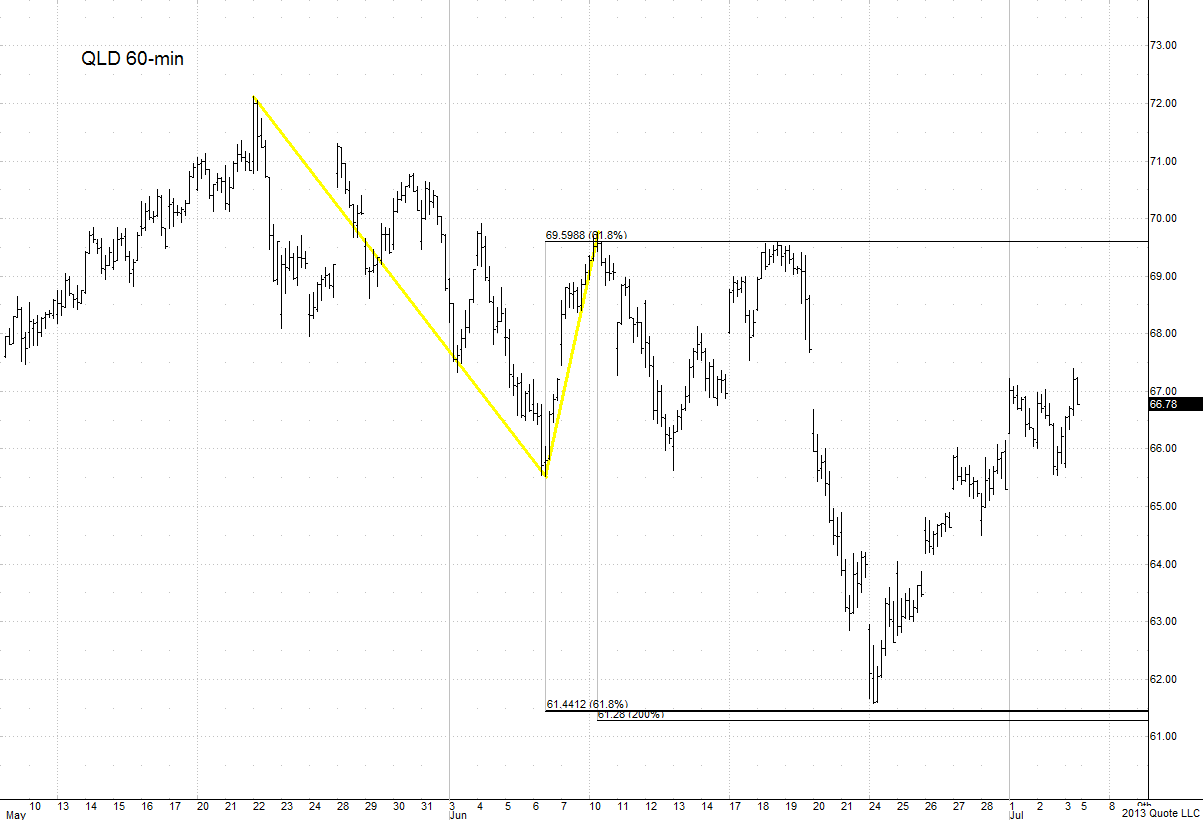
And here I've added rat's symmetry bracket to show it is, indeed, the same thing, done using the more conventional tools approach.
Click image for original size
I hope this helps and doesn't offend anyone. It took me a long time to mentally translate this and apply it with my tools, even though I have seen it explained in here before and even did that diagram. I figured most readers would be lost, so I decided to add my two cents. What's important is the concept, one which I think roofer uses a lot, and how to apply it using the tools the readers are working with.
Charts created on QCharts, courtesy eSignal