JI
jimkane
Rep: 3,058
Posts: 33,089
I would hope that you would.
Originally posted by MarcinO
I know which downsloping line is at 95.50 now
MA
MarcinO
Rep: 67
Posts: 5,506
I think I found it.
Back to June...
Back to June...
Originally posted by jimkane
Right, and that is valid logic, except that they have to have some TL's 'work' or all the suckers will stop using them. We had a lot of work lined up right on the TL that others would not see, so I thought they'd use it. There is also another line there from my 'proprietary' work that hits dead on, and that was what really convinced me that might be the spot. If you look long enough and hard enough you should be able to find it.
Originally posted by MarcinO
My thought was that they are going to fake out the TL at today's LOD and 92.25low form 29th of August.
This is why I expected that the correction wasn't over.
Originally posted by jimkane
I could show you exactly why I think it t reversed where it did. And it is almost all previous work.
Originally posted by MarcinO
Lot of lines around 1989
JI
jimkane
Rep: 3,058
Posts: 33,089
No, that's not the one I had in mind. I know which June one you mean, and it's a good one, but this is from August.
JI
jimkane
Rep: 3,058
Posts: 33,089
And it's a perfect example of what I call 'time drift', when viewed on say a 120-min or so.
MA
MarcinO
Rep: 67
Posts: 5,506
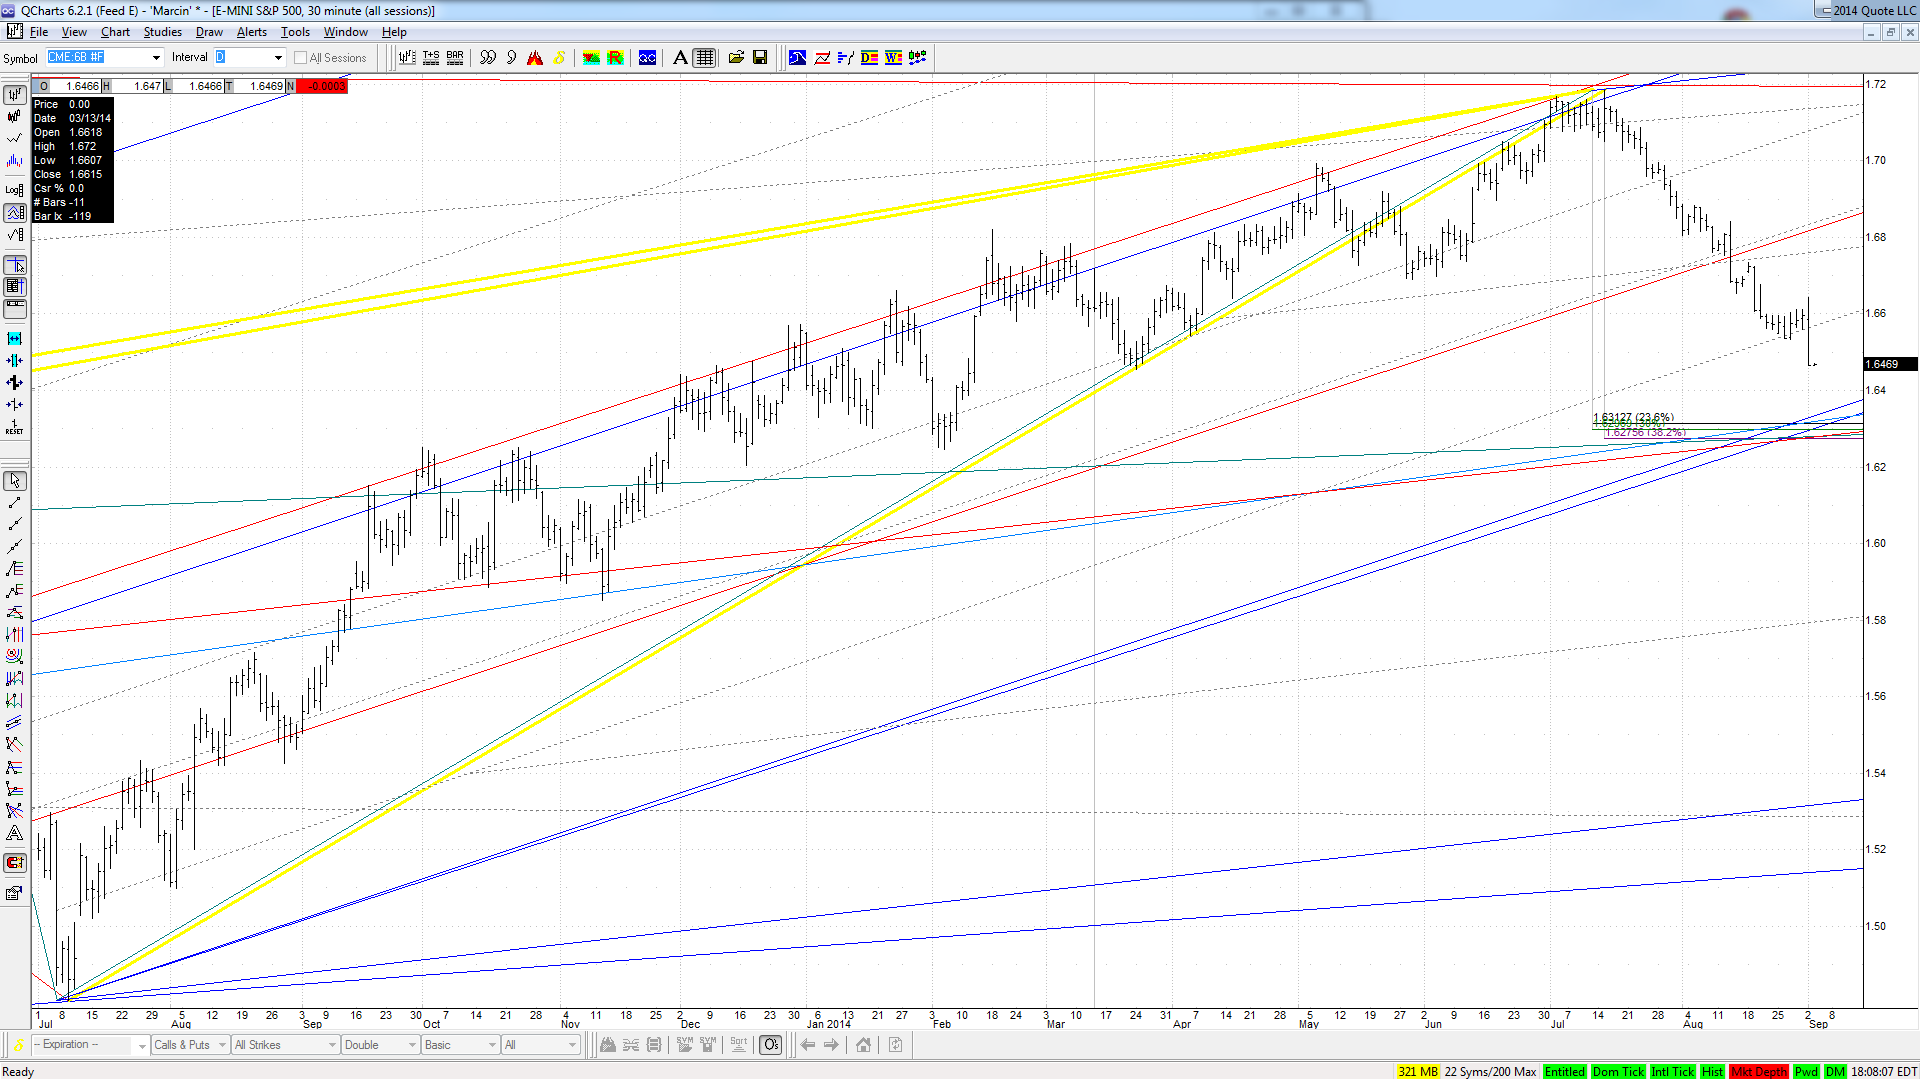
1.63 is enormous support area for the Pound.
The zoom here is shown on a daily time frame, but most of the lines were drawn and proven on a weekly chart.
I wouldn't be surprised to see it acting like a magnet.
The zoom here is shown on a daily time frame, but most of the lines were drawn and proven on a weekly chart.
I wouldn't be surprised to see it acting like a magnet.
Click image for original size
JI
jimkane
Rep: 3,058
Posts: 33,089
ES just grinding up to my area. How about a run there, bring it in off that for better prices in the AM, and then up and over to new all-time highs, again. I'm still watching for that possible fractal from the higher timeframe and a deeper pullback, but it probably isn't what is unfolding.
JI
jimkane
Rep: 3,058
Posts: 33,089
2003.25 hit. It's 'in there', just as I suspected. Now we see. Otherwise, it's just 'management mode'. Same old, same old for the KT methodology.
Originally posted by jimkane
Now, where would I like this to go? 3.00-4.50 area. What's hidden there, too? The RTH all-time high. Even if it hits it in the all-sessions, it still is a known point. My main stuff are lines and some other proprietary things. Why wouldn't I expect just another new all-time high 'automatically'? It just did a 3D (that's why I suspected as low as we got today). Go to the higher timeframe and look back at the previous pattern. 3D, then a flat ABCD, then a nominal new all-time high, then a dump that shook out the entire 3D. I'm not saying it will follow the exact same pattern, only that it might, or it might do something similar. Usually a reaction to a 3D isn't a tiny dip and new highs. Just some thoughts.