I'll kick it off, since Marcin isn't back yet. Here's an article for those that think all this stuff I post won't have any effect (eventually) on the market, or our trading. I've been saying for years and years the EU will break up, the Euro will go into the dustbin of history, and that they are in worse shape than the U.S. I strongly stand by all that. It is just taking longer than I assumed for all the things I expected to happen to unfold. I underestimated just how much they would do to prevent it, how many people they would throw under the bus (essentially all of us), and how they would be able to justify, in their own minds, sacrificing every last one of us so they can keep their power and position. They are all sociopaths, so in that regard I missed that factor, which is now all so clear. In one way or another we are all cannon fodder to them, all disposable.
http://armstrongeconomics.com/2014/09/21/french-farmers-set-tax-office-on-fire-demise-of-europe/
JI
jimkane
Rep: 3,058
Posts: 33,089
I feel like it's time for another 'That's how ya do it, son!' Charlie Daniels video clip. Anyway, I try to be very, very cautious in how I present these 'countertrend' short setups, since I don't want anyone to ever use them to make their own actual plays. This is not a 'picking service' in here, I make no calls. This forum is for educational purposes only. This type of play is for the very, very advanced trader, but it is based completely on the tools. Hence, all the caveats I always try to include.
I can explain the aspects of this, in great detail, to any of my students (you know, the ones I can count on one hand and have a slew of fingers left...), if they want. It's fascinating. But, honestly, it's way more detail than I could ever get in a forum. Here's a chart for some perspective. Understand, too, I had to pay attention to what I was doing myself, and then post this, so what I saw happened before I made the post. Take that into account, too.
Chart created on QCharts, courtesy eSignal
I can explain the aspects of this, in great detail, to any of my students (you know, the ones I can count on one hand and have a slew of fingers left...), if they want. It's fascinating. But, honestly, it's way more detail than I could ever get in a forum. Here's a chart for some perspective. Understand, too, I had to pay attention to what I was doing myself, and then post this, so what I saw happened before I made the post. Take that into account, too.
Click image for original size
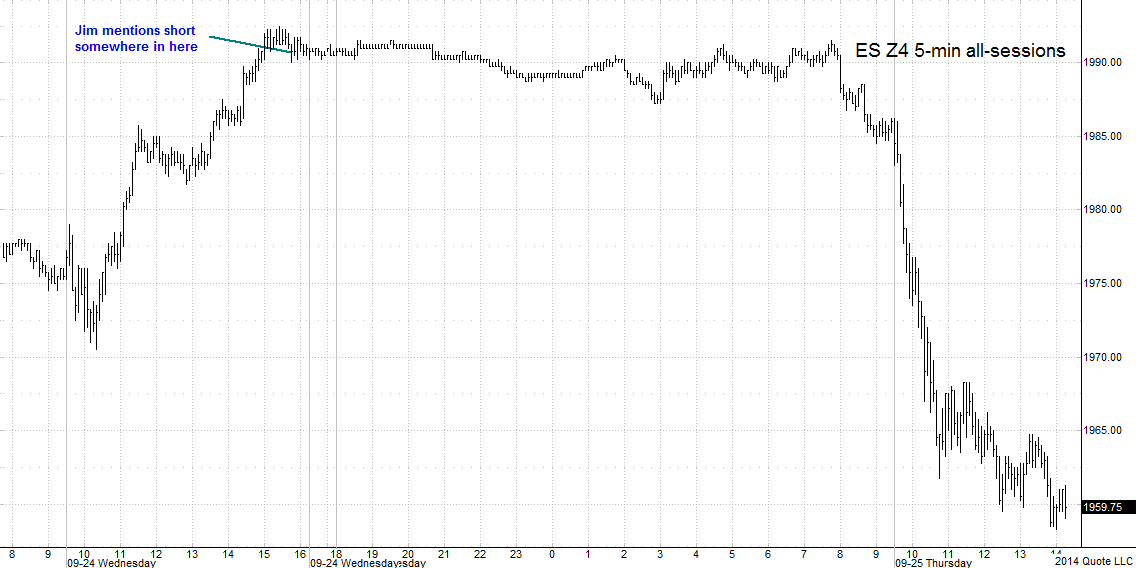
Chart created on QCharts, courtesy eSignal
24-Sep-2014 at 3:46 PM
Originally posted by jimkane
This short here doesn't look 'high probability' to me, not at this time of day, after a 20+ point frenzy day. But, there is a key area here...
24-Sep-2014 at 4:01 PM
Originally posted by jimkane
But, if this is just a sucker rally, this may be the spot, And it 'should' come in here a bit (the old 'get better prices in the AM' thing they like to do), even if it intends to run right up to new all-time highs. Hence, for some traders, this area is a worthwhile premise. The day play long was a monster, that one has reached its objective, and if one wants to be very sensitive to the price action clues, I can see a short shot in here...
JI
jimkane
Rep: 3,058
Posts: 33,089
And yes, the timing of it, right before the open, it followed my timing factor. So, this was not even slightly 'unexpected'.
JI
jimkane
Rep: 3,058
Posts: 33,089
But, but, but... They said on TV this market was massively underpriced right now. Imagine what it would be if they doubled it from here, as many say will happen. Imagine if it about doubles by next year at this time, like Armstrong thinks...
http://www.zerohedge.com/news/2014-09-25/most-expensive-market-ever
http://www.zerohedge.com/news/2014-09-25/most-expensive-market-ever
JI
jimkane
Rep: 3,058
Posts: 33,089
My best area on the downside is from 14-29. It's a higher timeframe area, so that width is reasonable, but I'm including everything in there, from the .382 to the .447. The 'best heart of the heart' of it is from say 17-23ish. It depends on when it gets there, and on what else it shows on the way, as far as pinpointing the area better. That is, assuming it even goes down any more. There is another key area before that, and we are sitting on one right now, which it obviously 'sees', and it has reacted to it a little bit. So, we'll see.
JI
jimkane
Rep: 3,058
Posts: 33,089
Did you see that after-cash closing 1-min bar on the ES? They blasted it up to 63.50, and then at the last moment dropped it down hard to 60.75, 2.75 points in a blink. Really goofy stuff, but typical.
JI
jimkane
Rep: 3,058
Posts: 33,089
Call me crazy (in that essentially no one else on planet earth would take this view), but if you told me someone was going to kill me, with certainty, at some unknown time sometime in the next say two years, or five years, my attitude is 'Just kill me now, I don't want to sit around and wait for it.' Same thing with the financial situation. They say, correctly in my opinion, when the Too Big To Fail fail, we'll all go under, the entire system will go under. And that is, in my opinion, a 100% certainty event. So, instead of quaking in my boots, I'd just as soon get it over with.
If I were in charge, I'd pull the plug right now, this very second (aren't you all glad I'm not in charge, and you can wait for the inevitable for the next however long period of time?). Flush the whole thing. Yes, I'd be done for, but at least before I was consumed in riots and violence, I'd have the biggest ear to ear grin any human has ever had, knowing at least I got to see them go under. To feel some justice for what they've done to this world. Like I said, it's a good thing I'm not in charge...
BTW, this article uses the BIS figure of $710 trillion in derivatives. The BIS is comprised of central bankers and other bankster types. When was the last time they told the truth? Uh... never? The real figure is much more likely $1,600 trillion, or thereabouts. So, you can probably safely assume the figures they give for the top five banks here are more than double what they say.
http://www.zerohedge.com/news/2014-09-25/5-us-banks-each-have-more-40-trillion-dollars-exposure-derivatives
JI
jimkane
Rep: 3,058
Posts: 33,089
Here's a couple of interesting charts:


I can't get over how the market follows the Fed balance sheet i.e. how the money really does flow right into the market, not the economy.
Source: http://www.zerohedge.com/news/2014-09-26/high-yield-credits-worst-week-15-months-sends-stocks-sliding
I can't get over how the market follows the Fed balance sheet i.e. how the money really does flow right into the market, not the economy.
Source: http://www.zerohedge.com/news/2014-09-26/high-yield-credits-worst-week-15-months-sends-stocks-sliding