Pivot point study
I did a study for the Dec 14 contract to see how many of the pivot points we hit in a day. I computed R4, R3, R2, R1, PP, S1, S2, S3, S4
The statistical study was to see how many of these points would we hit in a day. I compiled the day by number of hits. For example if we hit R1 and PP, I call it as a 2-hit day. If we hit only R1, I call it as a 1-hit day, if we hit PP, S1 and S2 I call it a 3-hit day, etc.
Keep in mind that there were some holidays within this time period so some data points might be outliers. The study was done only on RTH data.
The data collected was over 100 trading days so the numbers below can also be read as percentages
0-hit 4
1-hit 21
2-hit 49
3-hit 15
4-hit 9
5-hit 1
6-hit 1
7-hit 0
8-hit 0
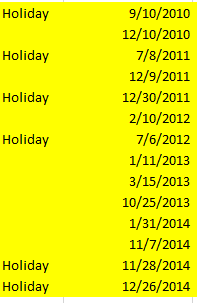
Below is a picture of the 0-hit days. Of the 14 misses, 6 of them are on holidays. So in truth, there are only 8 misses out of 259. I tried looking at range and ATR but there is no good way to filter out these misses. I see some weeks where the range is >2x the ATR and the subsequent week we still hit multiple pivot numbers due to a large range. The misses were just narrow range weeks.
I think after removing the holidays, there is a ~97% chance of hitting at least one weekly pivot number and that is pretty darn good so we shall go with that!
I think after removing the holidays, there is a ~97% chance of hitting at least one weekly pivot number and that is pretty darn good so we shall go with that!
Click image for original size
Emini Day Trading /
Daily Notes /
Forecast /
Economic Events /
Search /
Terms and Conditions /
Disclaimer /
Books /
Online Books /
Site Map /
Contact /
Privacy Policy /
Links /
About /
Day Trading Forum /
Investment Calculators /
Pivot Point Calculator /
Market Profile Generator /
Fibonacci Calculator /
Mailing List /
Advertise Here /
Articles /
Financial Terms /
Brokers /
Software /
Holidays /
Stock Split Calendar /
Mortgage Calculator /
Donate
Copyright © 2004-2023, MyPivots. All rights reserved.
Copyright © 2004-2023, MyPivots. All rights reserved.