JI
jimkane
Rep: 3,058
Posts: 33,089
Kickin' it off. Should be another crazy week. Each week seems crazier than the last, and not as crazy as the upcoming week will be...
RA
rat89
Rep: 0
Posts: 7,015
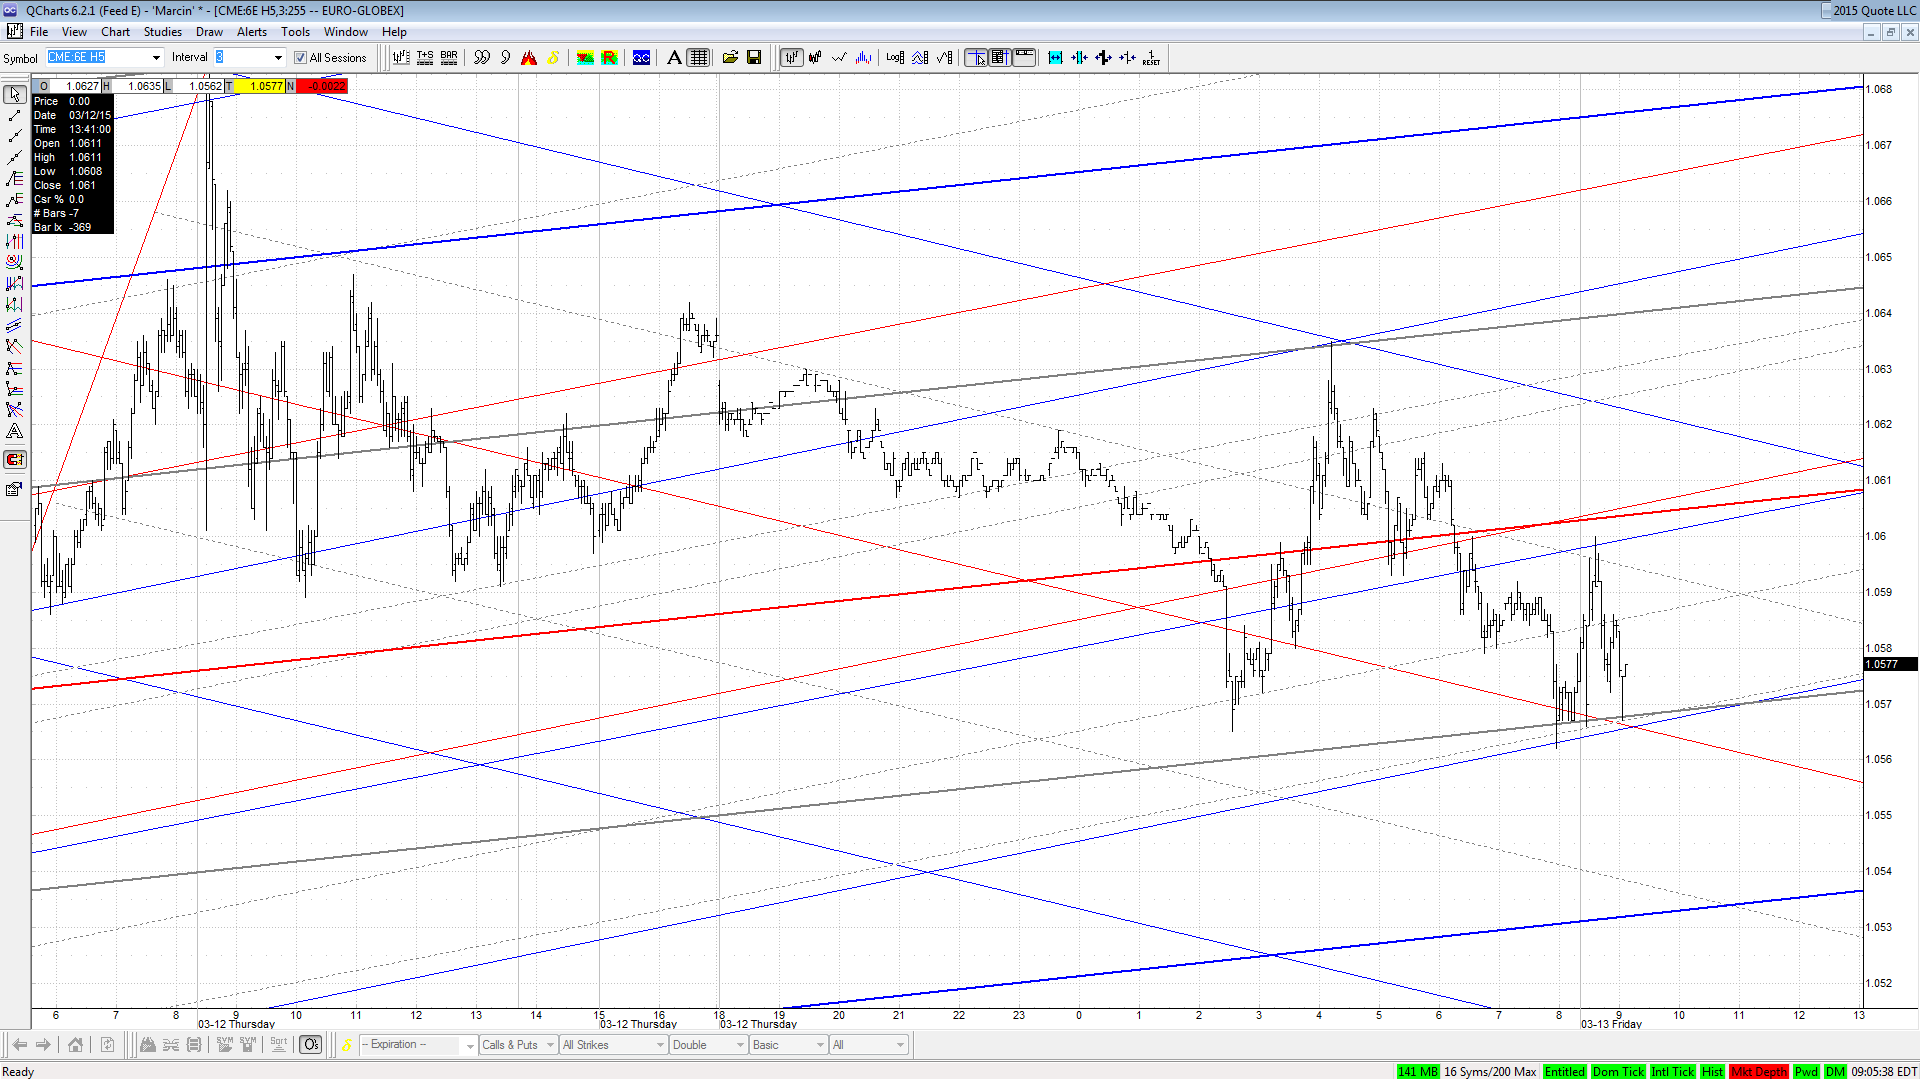
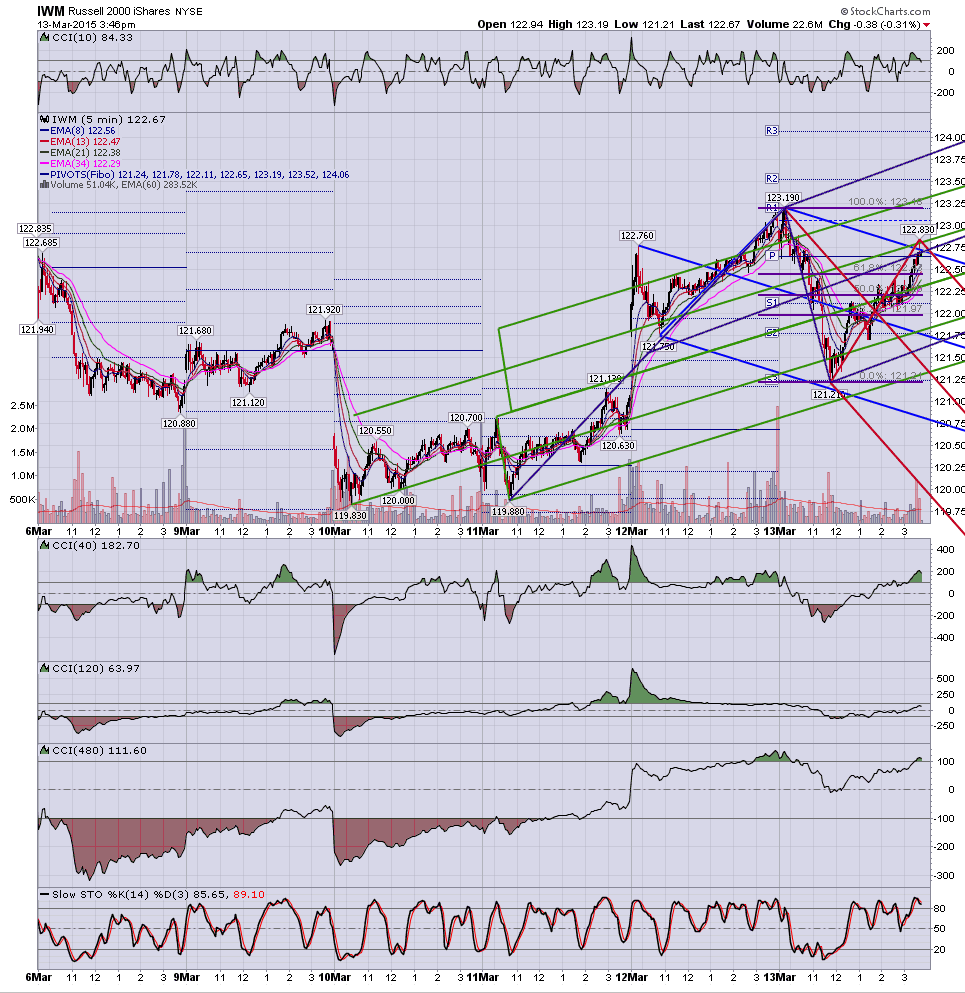
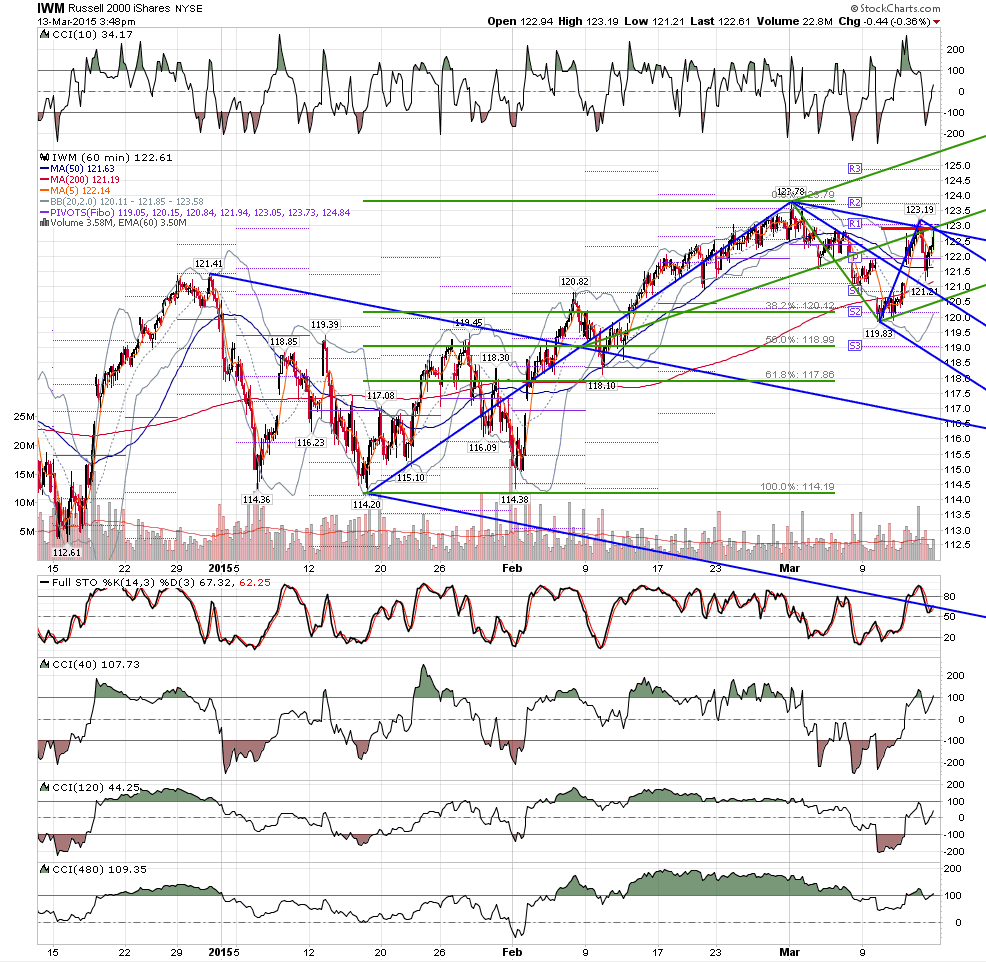
target basically hit - look for 1.46 at 88.16 later today
Click image for original size
RA
rat89
Rep: 0
Posts: 7,015
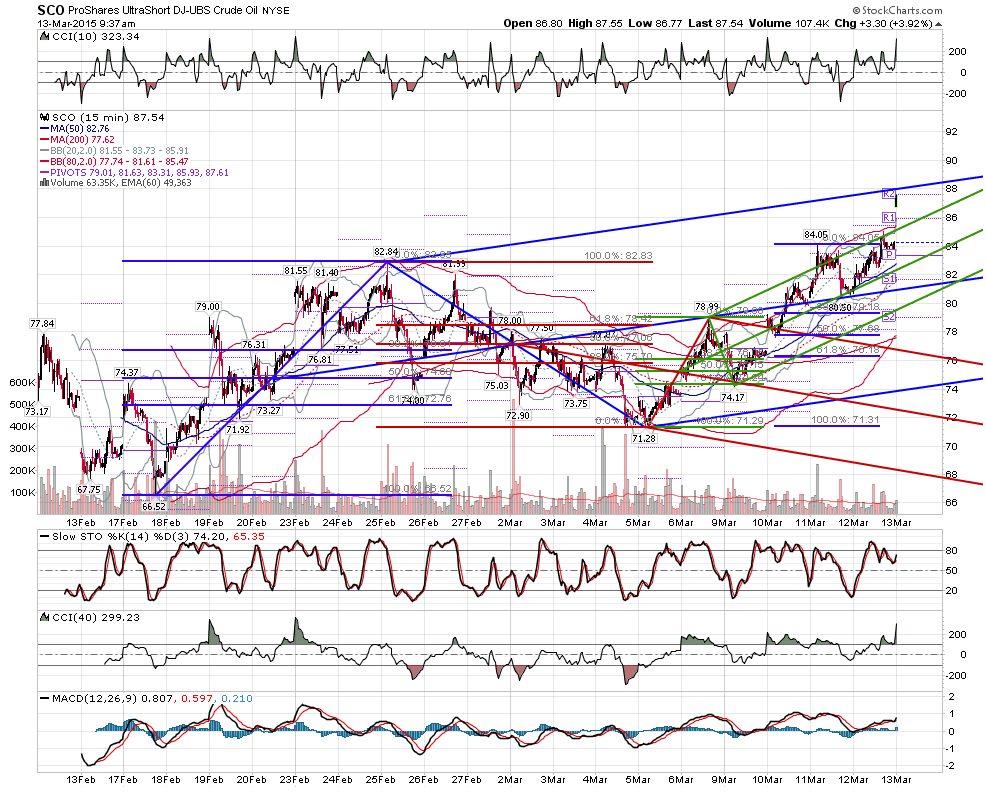
they wouldn't do that, would they?
Click image for original size
Click image for original size
RA
rat89
Rep: 0
Posts: 7,015
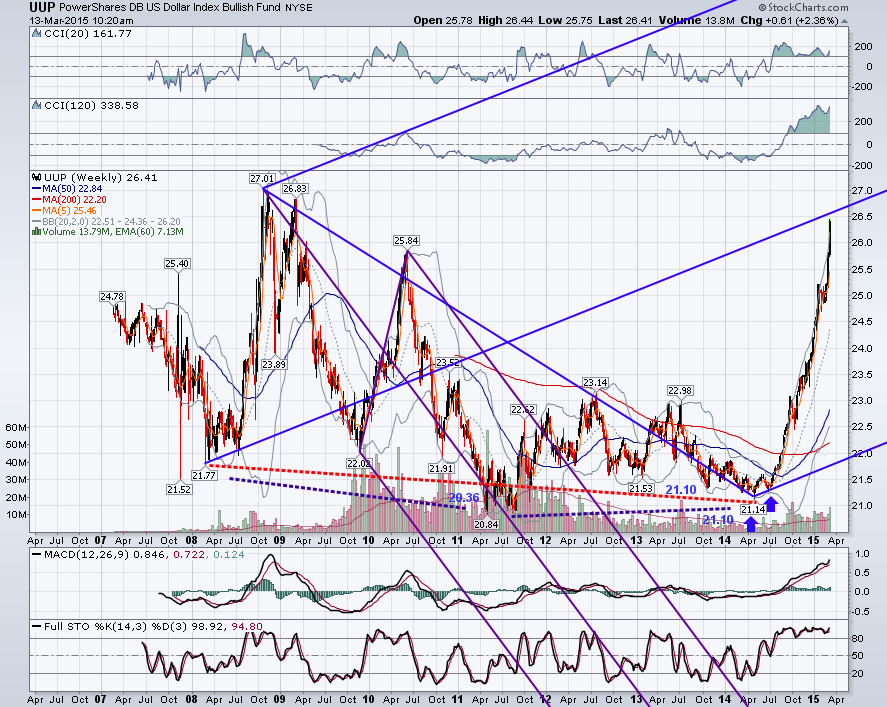
uup bigger picture - swing from 21.77 - 27.01 targeted 21.10 - 20.36 .... price went to 20.84, then bounced, taking three years to come back to key area where 21.77 - 27.01 = 1.128 a 21.10, and 20.84 - 23.14 = .886 at 21.10. Now you price is heading to the median line, where 27.01 - 20.84 = .886 at 26.31. Keep in mind this set is drawn in a way I would not on an index, crossing through the lower low in early 2011. Also keep in mind that the median line is the first target. Price could turn back, coil there, or slice through, and there are targets at 27.80, 28.68, 29.85, 30.82, and 33.18. The main takeaway is that this helps illustrate that none of these moves we see that seem so surprising really are.....they all make sense within the parameters of the bigger context
Click image for original size
JI
jimkane
Rep: 3,058
Posts: 33,089
Nice work, rat. I think it's headed to that upper parallel area as the Euro winds down and ceases to exist, but likely not without some dips.
Originally posted by rat89
uup bigger picture - swing from 21.77 - 27.01 targeted 21.10 - 20.36 .... price went to 20.84, then bounced, taking three years to come back to key area where 21.77 - 27.01 = 1.128 a 21.10, and 20.84 - 23.14 = .886 at 21.10. Now you price is heading to the median line, where 27.01 - 20.84 = .886 at 26.31. Keep in mind this set is drawn in a way I would not on an index, crossing through the lower low in early 2011. Also keep in mind that the median line is the first target. Price could turn back, coil there, or slice through, and there are targets at 27.80, 28.68, 29.85, 30.82, and 33.18. The main takeaway is that this helps illustrate that none of these moves we see that seem so surprising really are.....they all make sense within the parameters of the bigger context
Click image for original size