MyPivots
Sign In
MA
MarcinO
Rep: 67
Posts: 5,506
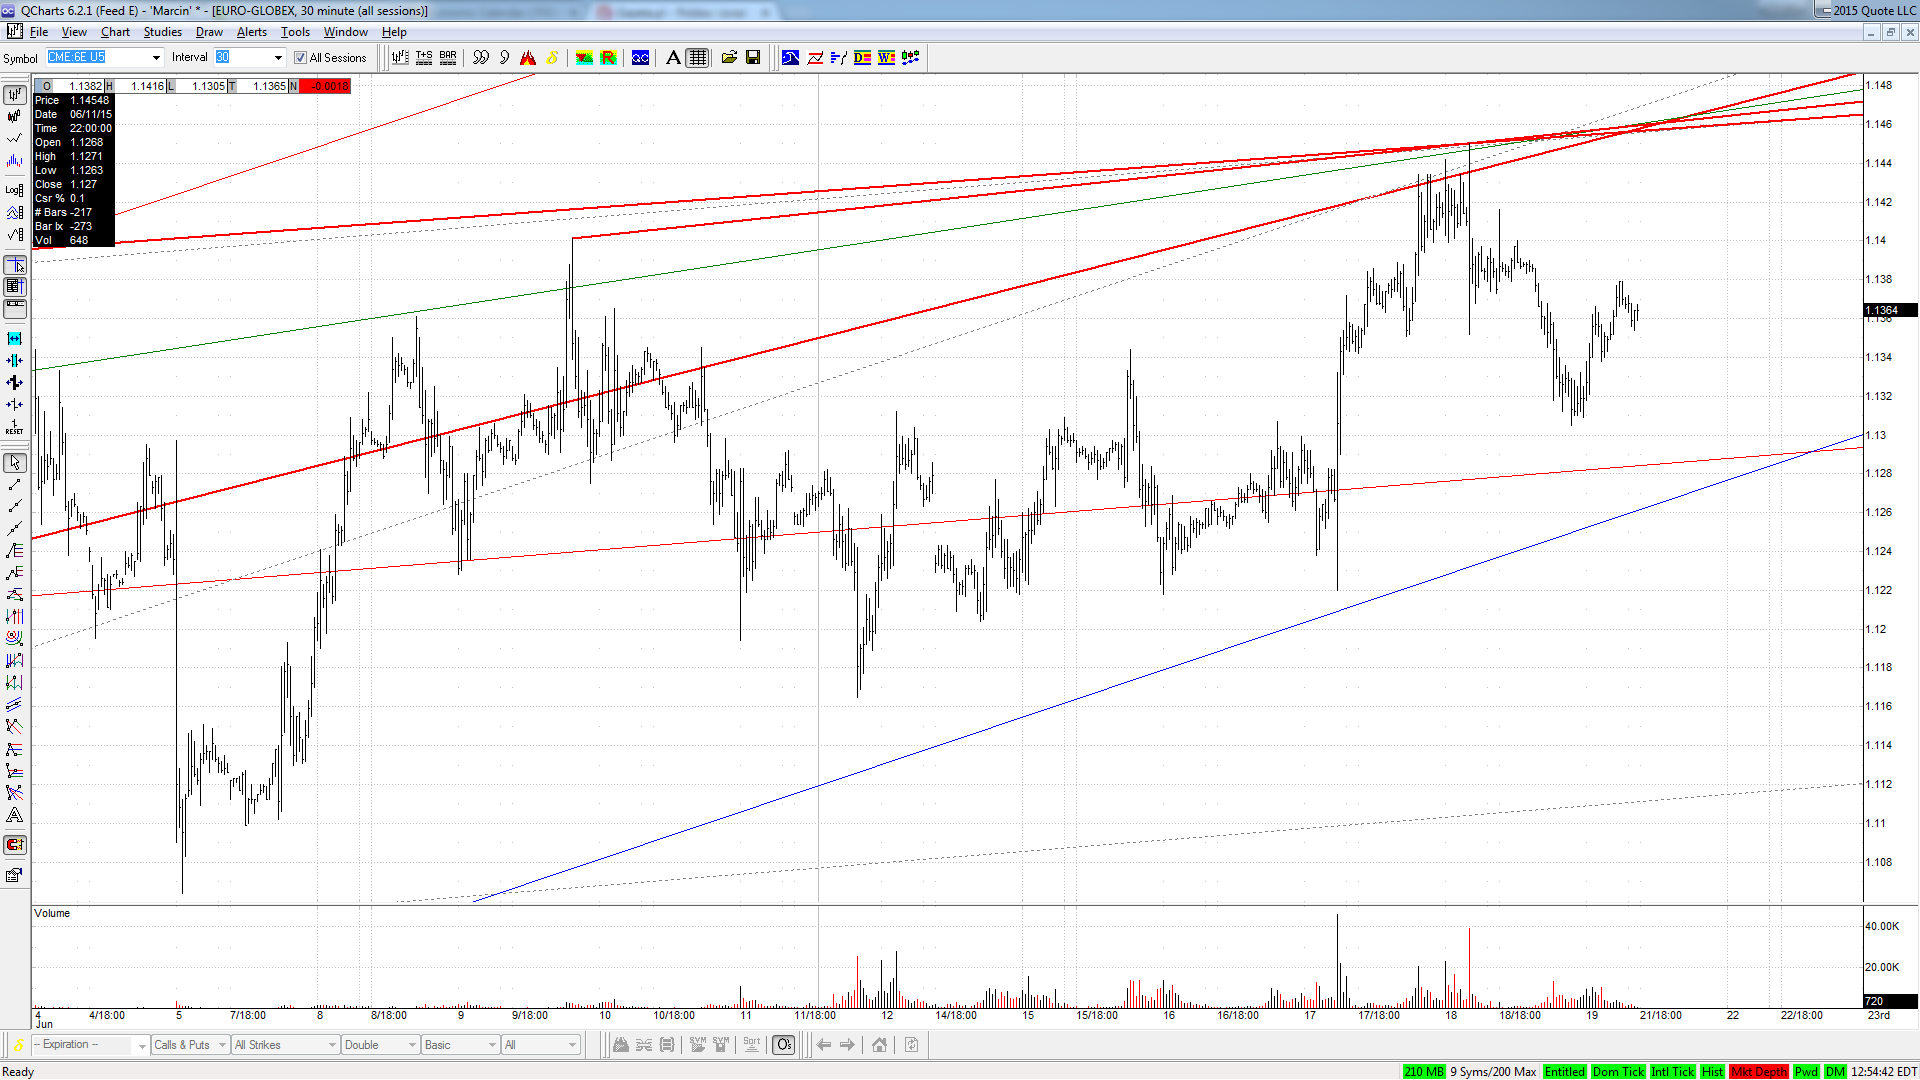
My most preferable scenario is one more fake move up to 1.1450-80 and then serious correction.
If it didn't respect that area I would expect it to reach 1.1750 very fast.


Click image for original size
6e 2015 06 21 png
JI
jimkane
Rep: 3,058
Posts: 33,089
Yeah, Marcin, I was/am watching that area you posted quite closely. I wonder if this is going to take a dump here. I doubt it because they will surely do a 'bailout extension' or some other utter nonsense, and 'Greece and the Euro will be saved' again. But some day it's not going to happen, and then the Euro can move to 'intrinsic value', which to me is just over 60. They'll fold before they'll allow that, I think.
JI
jimkane
Rep: 3,058
Posts: 33,089
JI
jimkane
Rep: 3,058
Posts: 33,089
With Fu#$book at new all-time highs, and since we are having some fun, here's one:

http://www.zerohedge.com/news/2015-06-23/spot-difference
JI
jimkane
Rep: 3,058
Posts: 33,089
My thoughts exactly, finally summed up perfectly in an image. I'd like to see a second version, too, with a drain.


Source: http://www.zerohedge.com/news/2015-06-23/artists-impression-week-every-week-europe
RA
rat89
Rep: 0
Posts: 7,015
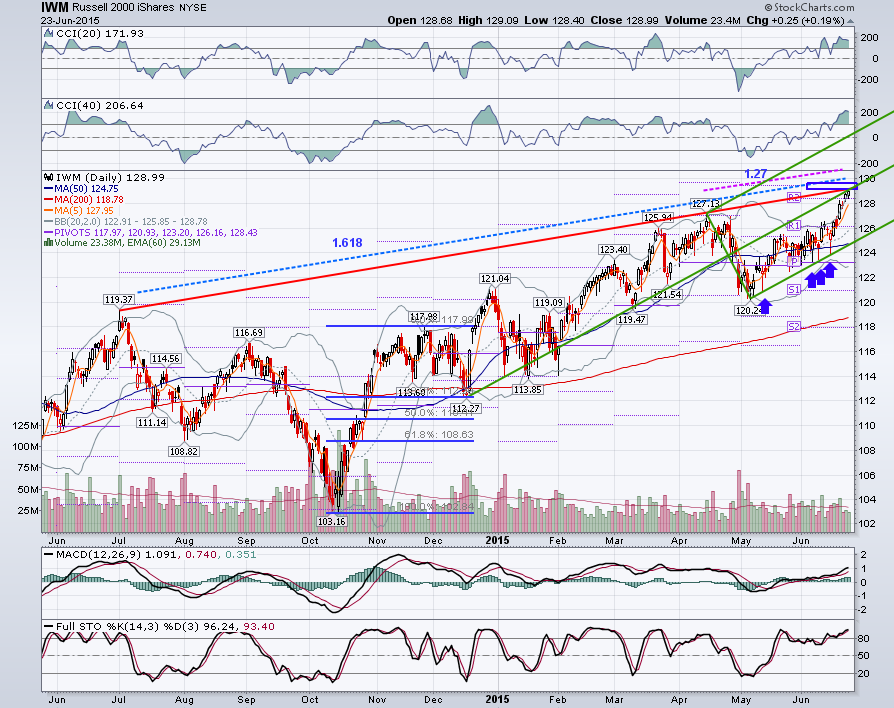
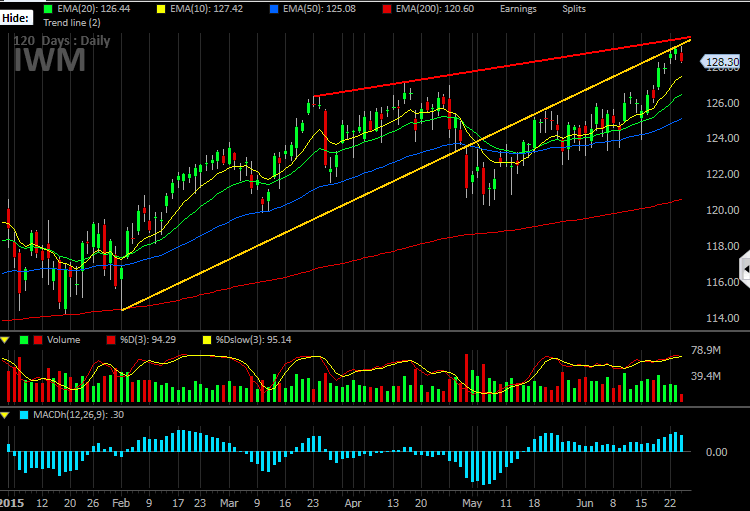
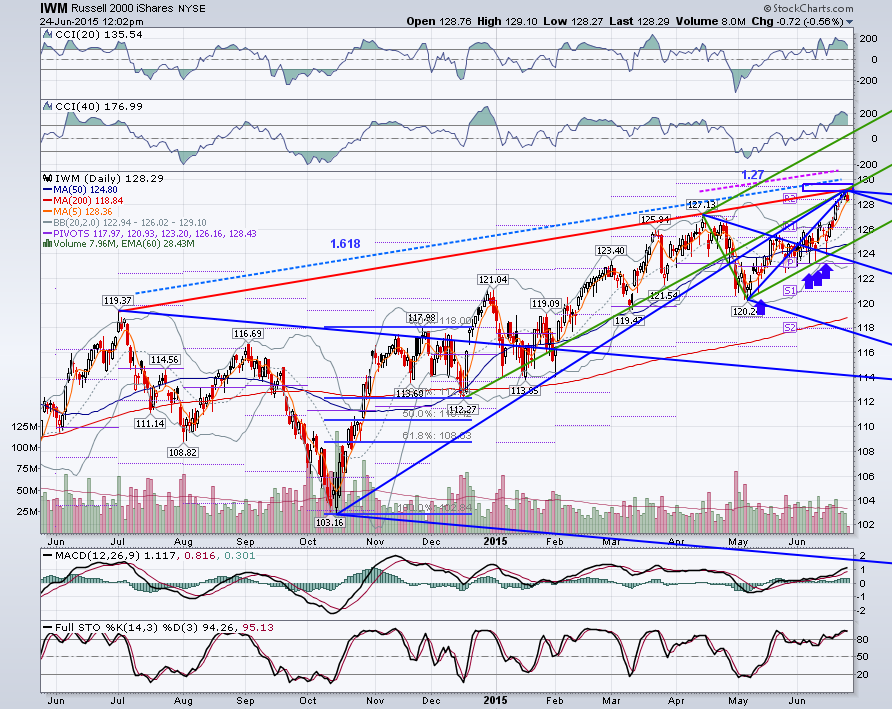
The more I look at the indexes the more I am fascinated by iwm and what Denali would call its relentless bid. It behaves as though it has a place it has to get to before time runs out, and the intraday action today, with spy and dia hanging around the first hour low, while iwm shot up for a second new ath for the day in the afternoon after making one in the morning plays into that. The green set has been tested 4 times, and is anchored at a prior pullback to .382 made last December. Price is now in a small range (blue box) where two external fib retracements come into play:

119.37 – 102.84 = 1.618 at 129.59
127.13 – 120.24 = 1.27 at 128.99

Click image for original size
screen shot 2015 06 23 at 7 53 28 pm png
MA
MarcinO
Rep: 67
Posts: 5,506
Right.They need to prolong all those games so that there is still place for manipulation on FX.
Now I'm looking at 1.1260 and 1.1350-70.


Originally posted by jimkane

Yeah, Marcin, I was/am watching that area you posted quite closely. I wonder if this is going to take a dump here. I doubt it because they will surely do a 'bailout extension' or some other utter nonsense, and 'Greece and the Euro will be saved' again. But some day it's not going to happen, and then the Euro can move to 'intrinsic value', which to me is just over 60. They'll fold before they'll allow that, I think.
RA
rat89
Rep: 0
Posts: 7,015
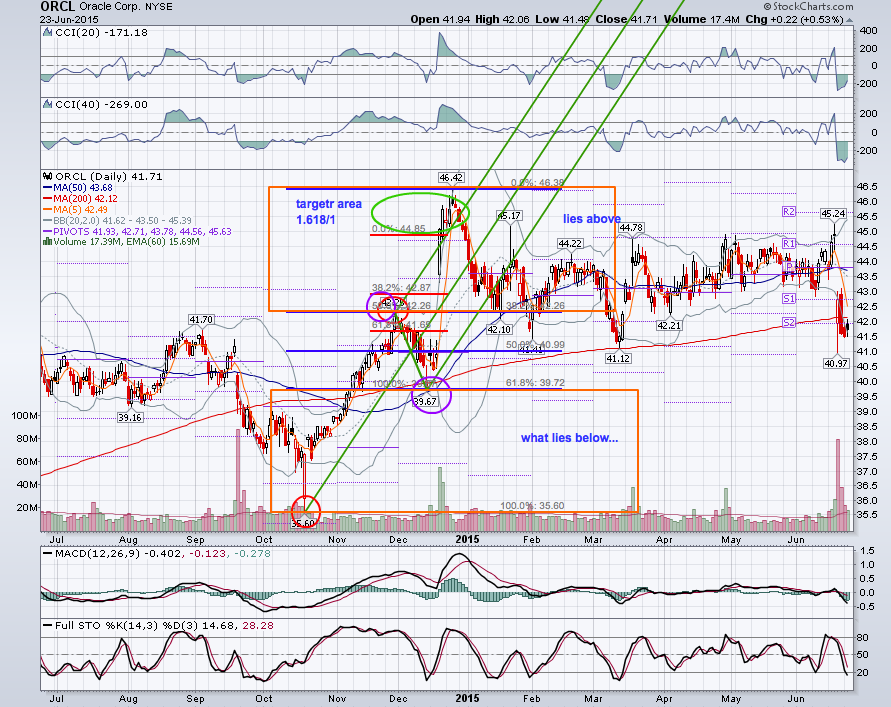
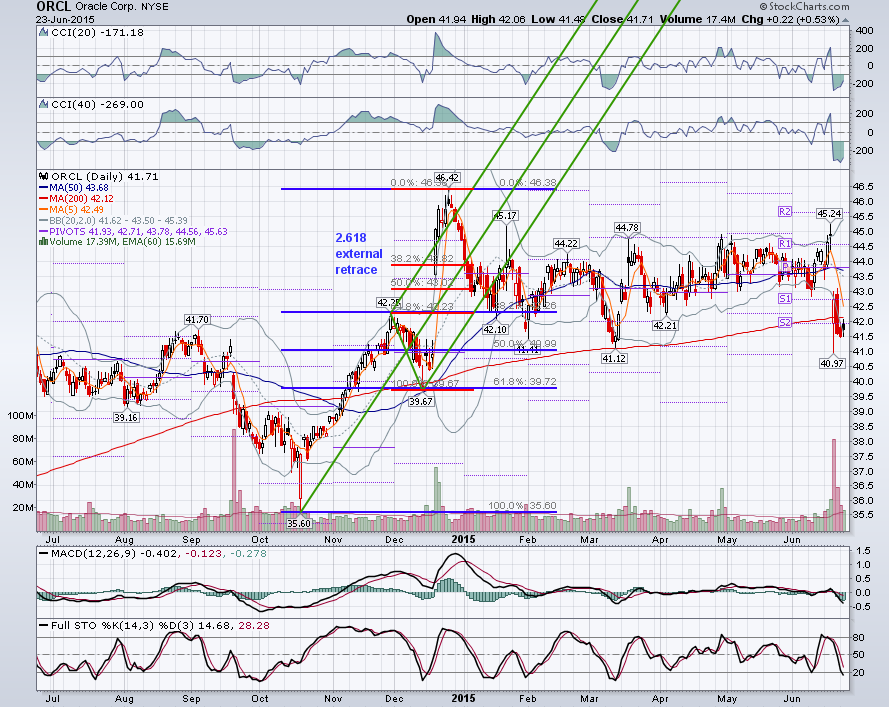
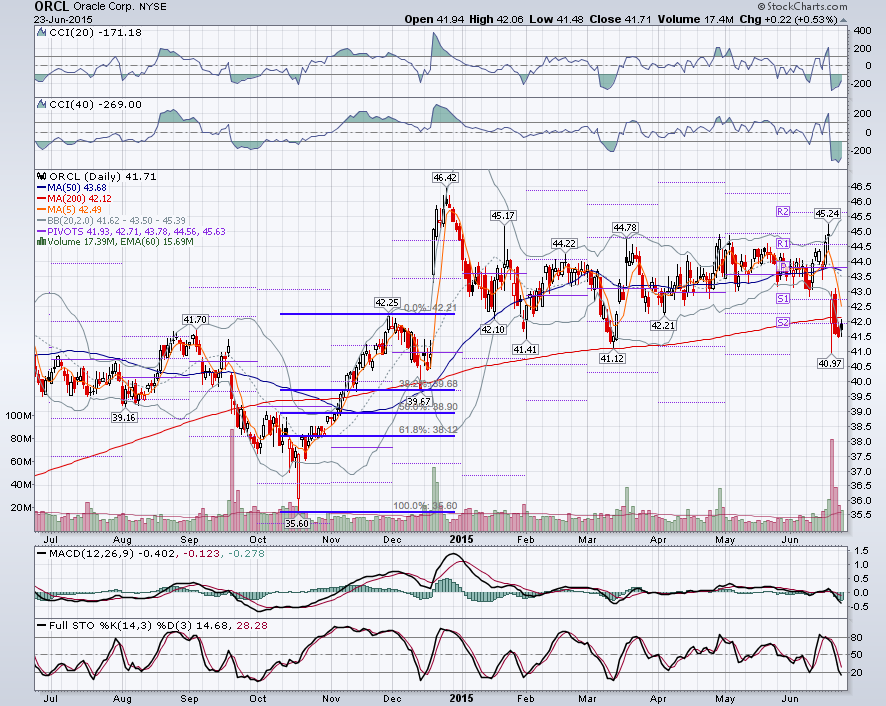
1.618/1 a setup taught to me by roofer - on orcl, in a more extreme case

chart 1: shows simply that price pulled back to the .382 in december....I would have looked for a more complex pattern, an abcd, whereas this was just ab

chart 2: simple green median line set looks for a continuation with the upper line as extreme target area. Fib tool - blue fib set starting at the low and set the 1.618 at the prior high (small red circles) - this projects 1.618 of that first move at the 0 line. Note how it captures the pullback right in the center area. Red fib - start at the pullback low and set .50 at prior high (small purple circles) - the 0 line will give you a 2.0 for a move up that is double the pullback. Green oval shows target area between the two 0 lines. Orange boxes show a roughly equal move into and out of the congestion area - also known as a measured move.....what lies below, lies above!

chart 3: what really happened? overshoot of the upper line of the green median line set with price reversing at the 1.618. Note adjusted red fibs, this time setting the .618 at the prior high for a more extreme projection - putting your 0 line up at a 2.618 external retracement of the pullback move down. Note how the two fib projections land in the same area, and how price turned right there.

The basic point of all these projected setups is that certain patterns with fibs in place project moves a good percentage of the time, and in all time frames. Once you start collecting many samples of how they played out in real time, you can see which ones are more reliable, and under what circumstances. It's amazing stuff, really.

Click image for original size
screen shot 2015 06 24 at 8 22 28 am png

Click image for original size
screen shot 2015 06 24 at 8 27 49 am png

Click image for original size
screen shot 2015 06 24 at 8 29 50 am png
RA
rat89
Rep: 0
Posts: 7,015
Click image for original size
screen shot 2015 06 24 at 12 32 41 pm png

Click image for original size
screen shot 2015 06 24 at 12 02 34 pm png
JI
jimkane
Rep: 3,058
Posts: 33,089
Will this 'retest' at a key area here hold and send this up a bit? Or does it want that critical 'backtest' area down lower at say 95? I can't imagine no second attempt at a bounce here...
JI
jimkane
Rep: 3,058
Posts: 33,089
Plus that 95 area would sweep out Friday's LOD and key swing point.
JI
jimkane
Rep: 3,058
Posts: 33,089
What I can't get over, no matter how many tens and tens of thousands of hours I have watching this thing, is how it keeps doing pretty much the same thing, year after year, bull, bear, manipulated, and so on. Yes, there are minor variations, but the basic playbook just stays the same. Quite amazing, in my opinion.