ES Thursday 8-6-15
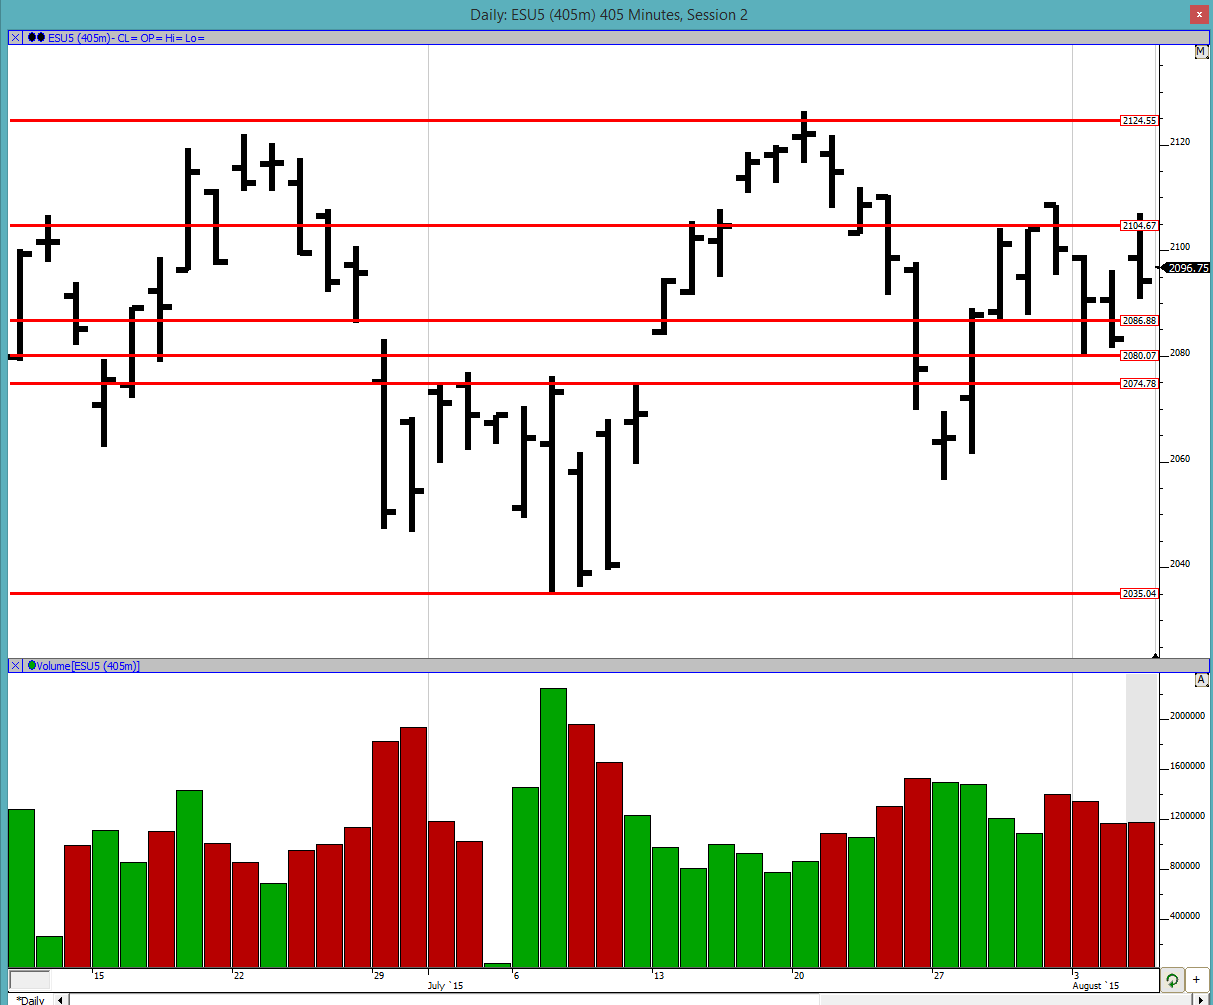
Good morning to all. We are back in the previous 3-day balance area of 2104.75 to 2087. We looked above it failed, we looked below it and failed and now we are back in it. Wednesday we again looked above it but closed inside of it. The market continues to go back and forth in this range and the eventual move out of it could be pretty large. So this is something that definitely needs to be monitored. Wednesday when we broke out of it to the upside there was absolutely no momentum with it and that is no way to break a balance area. This continues to be on the radar.
Greenies: 2123.5, 2118.75, 2112.75, 2104.25, 2094.5 2086.75 and 2066.75
Profile:
Wednesday was again almost a double distribution day but that got closed. We can see that there are 2 bells to the profile with the bottom one being wider. The high and the low look fairly secure with excess on both of them. For markets to continue upwards they would have to get to the upper bell and then continue else there is a possibility of a liquidation break which would take the market lower. Again we need to focus on the market's ability to break out of this balance.
The split profile shows how the market opened gapping up and moved up fairly quickly in A period. This was a pretty bullish sign but the momentum wore out in C period, balanced in D period and then the liquidation came in E period when the market could not go further up beyond the greenie. The market overcorrected until the H period and then bounced back up. Notice how the L period high matched 8/3's high to the tick. This is an indication of weak selling. By the end of the day there was almost a feel like the auction was not complete so we shall see what today brings us.
The O/N trade is fairly balanced but a little skewed to the downside. It is contained almost completely inside Wednesday's value area. As of now we would open within Wednesday's value area.
I will keep posting through the day. Good luck to all.
Greenies: 2123.5, 2118.75, 2112.75, 2104.25, 2094.5 2086.75 and 2066.75
Click image for original size
Profile:
Wednesday was again almost a double distribution day but that got closed. We can see that there are 2 bells to the profile with the bottom one being wider. The high and the low look fairly secure with excess on both of them. For markets to continue upwards they would have to get to the upper bell and then continue else there is a possibility of a liquidation break which would take the market lower. Again we need to focus on the market's ability to break out of this balance.
Click image for original size
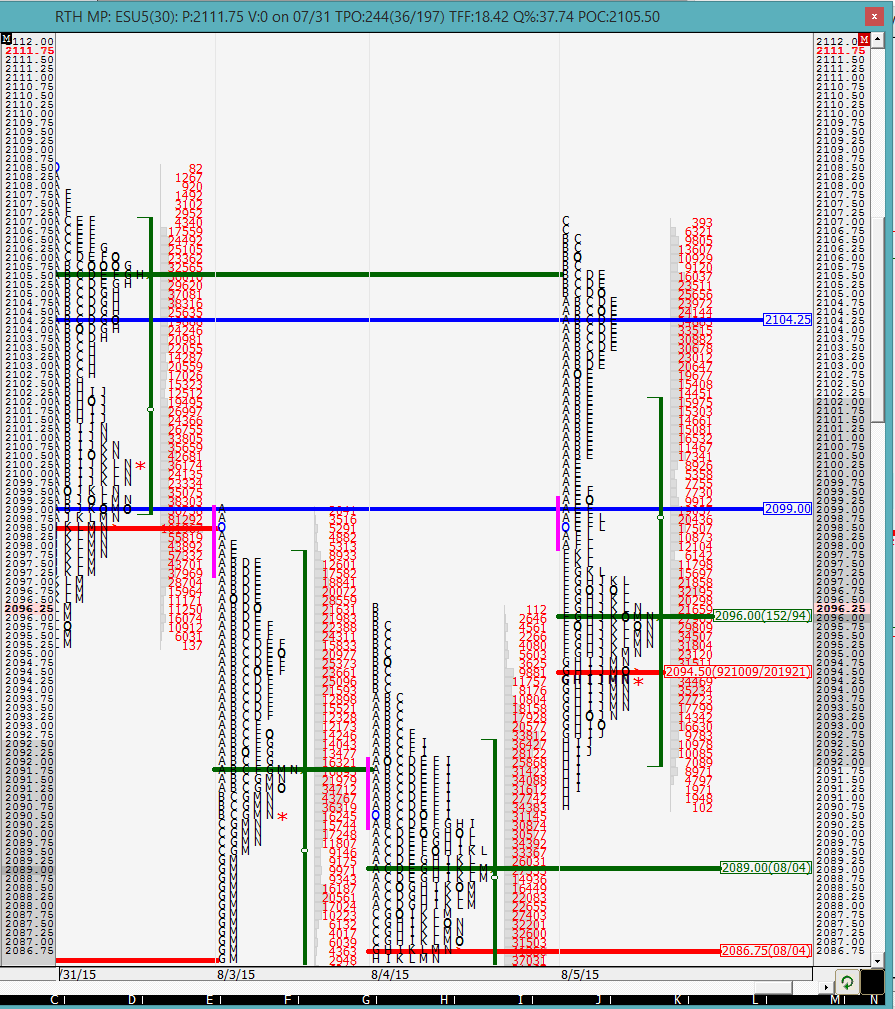
The split profile shows how the market opened gapping up and moved up fairly quickly in A period. This was a pretty bullish sign but the momentum wore out in C period, balanced in D period and then the liquidation came in E period when the market could not go further up beyond the greenie. The market overcorrected until the H period and then bounced back up. Notice how the L period high matched 8/3's high to the tick. This is an indication of weak selling. By the end of the day there was almost a feel like the auction was not complete so we shall see what today brings us.
Click image for original size
The O/N trade is fairly balanced but a little skewed to the downside. It is contained almost completely inside Wednesday's value area. As of now we would open within Wednesday's value area.
I will keep posting through the day. Good luck to all.
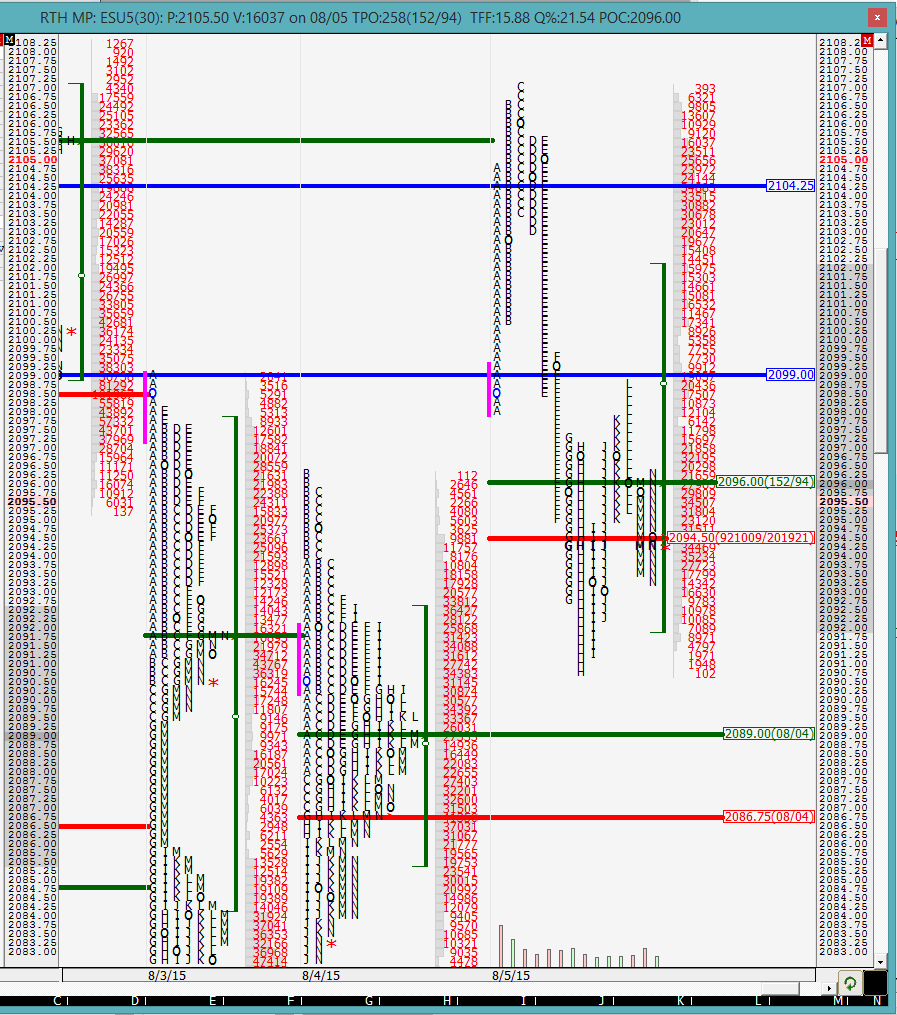
approaching YD's low and O/N low... lets see if we bounce back or break down
fighting it out at YD's low... market trying to see if there is anything left in YD's range
so far the market has been unable to break back into YD's range
also this is a lot of prints in the A period. conventional knowledge says that at least some of them should be covered some time today. if not, that is a sign of a weak market.
30 min VPOC @ 2090
Good morning. I have noticed that almost religiously you mention the 30' VPOC of A period. May I ask why? For example, today, in what seems a down day, would one initiate shorts at the 30' VPOC ? Thank you !
we (it was originally BruceM's idea) that the 30 min VPOC gets revisited very often. I think I did a study on it (you might be able to find it) but there is a high probability of the market revisiting this value subsequently in the day. Now whether you use it as a target or as a place to enter the market is upto you. I personally like the idea of using it as a destination especially when the market has moved away from it substantially. On a trend day, one could use it as a pull-back point to enter the market as well.
you can see how i mentioned that there were a lot of prints in the A period and the 30-min VPOC was relatively far away. So one would have to take the scary trade to go long and get to it. The tricky part is where do you enter the trade.
you can see how i mentioned that there were a lot of prints in the A period and the 30-min VPOC was relatively far away. So one would have to take the scary trade to go long and get to it. The tricky part is where do you enter the trade.
Similar situation as yesterday (on the opposite side): C period failed range extention. Theory says you buy when D breaks high of C. I wouldnt go long but ...
that is a reasonable approach as long as you know where you stop out. today it feels like the momentum is stronger than YD though
almost identical session to 7/24
Emini Day Trading /
Daily Notes /
Forecast /
Economic Events /
Search /
Terms and Conditions /
Disclaimer /
Books /
Online Books /
Site Map /
Contact /
Privacy Policy /
Links /
About /
Day Trading Forum /
Investment Calculators /
Pivot Point Calculator /
Market Profile Generator /
Fibonacci Calculator /
Mailing List /
Advertise Here /
Articles /
Financial Terms /
Brokers /
Software /
Holidays /
Stock Split Calendar /
Mortgage Calculator /
Donate
Copyright © 2004-2023, MyPivots. All rights reserved.
Copyright © 2004-2023, MyPivots. All rights reserved.