MyPivots
Sign In
MA
MarcinO
Rep: 67
Posts: 5,506
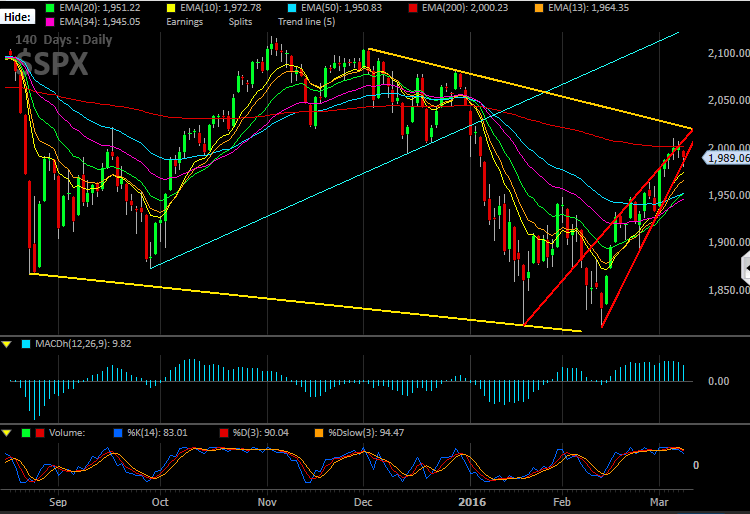
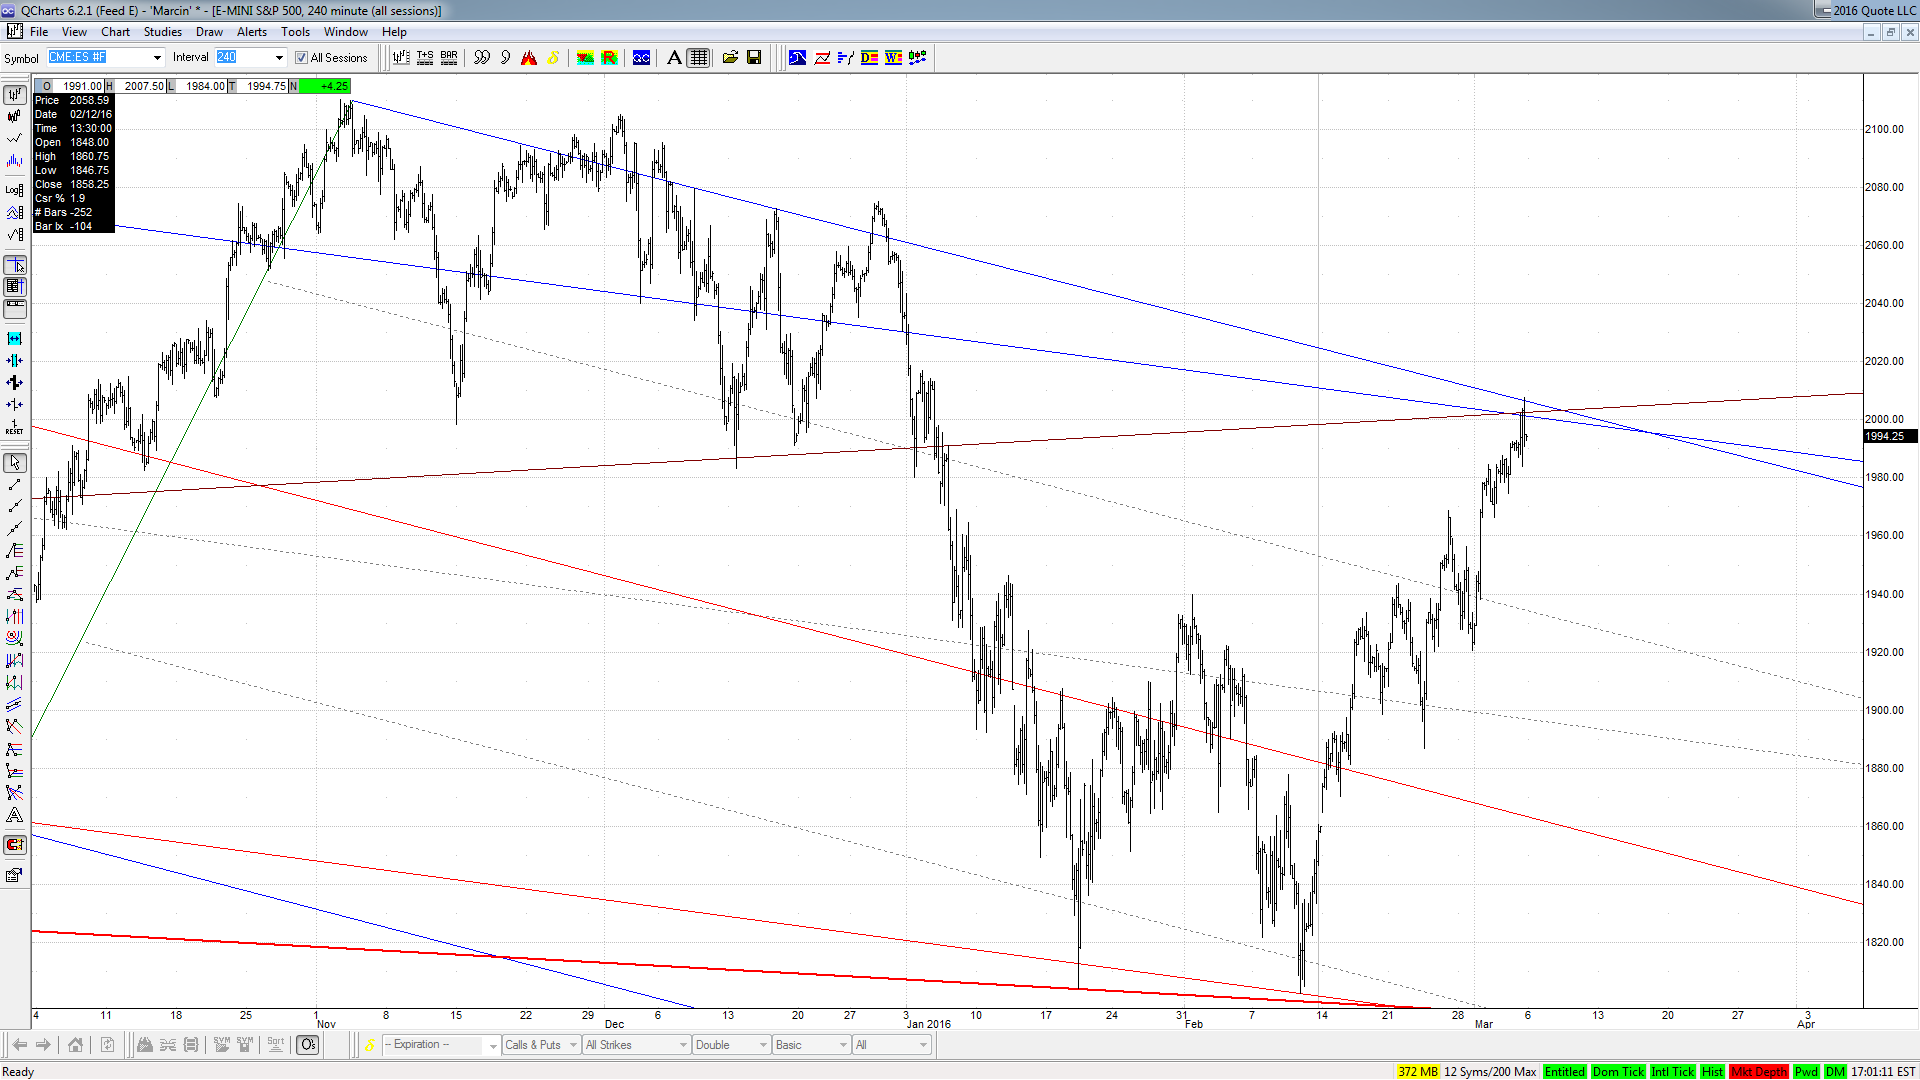
The ES stopped at 2007 doing a great job hitting stop loss orders.
Click image for original size
es 2016 03 06 png


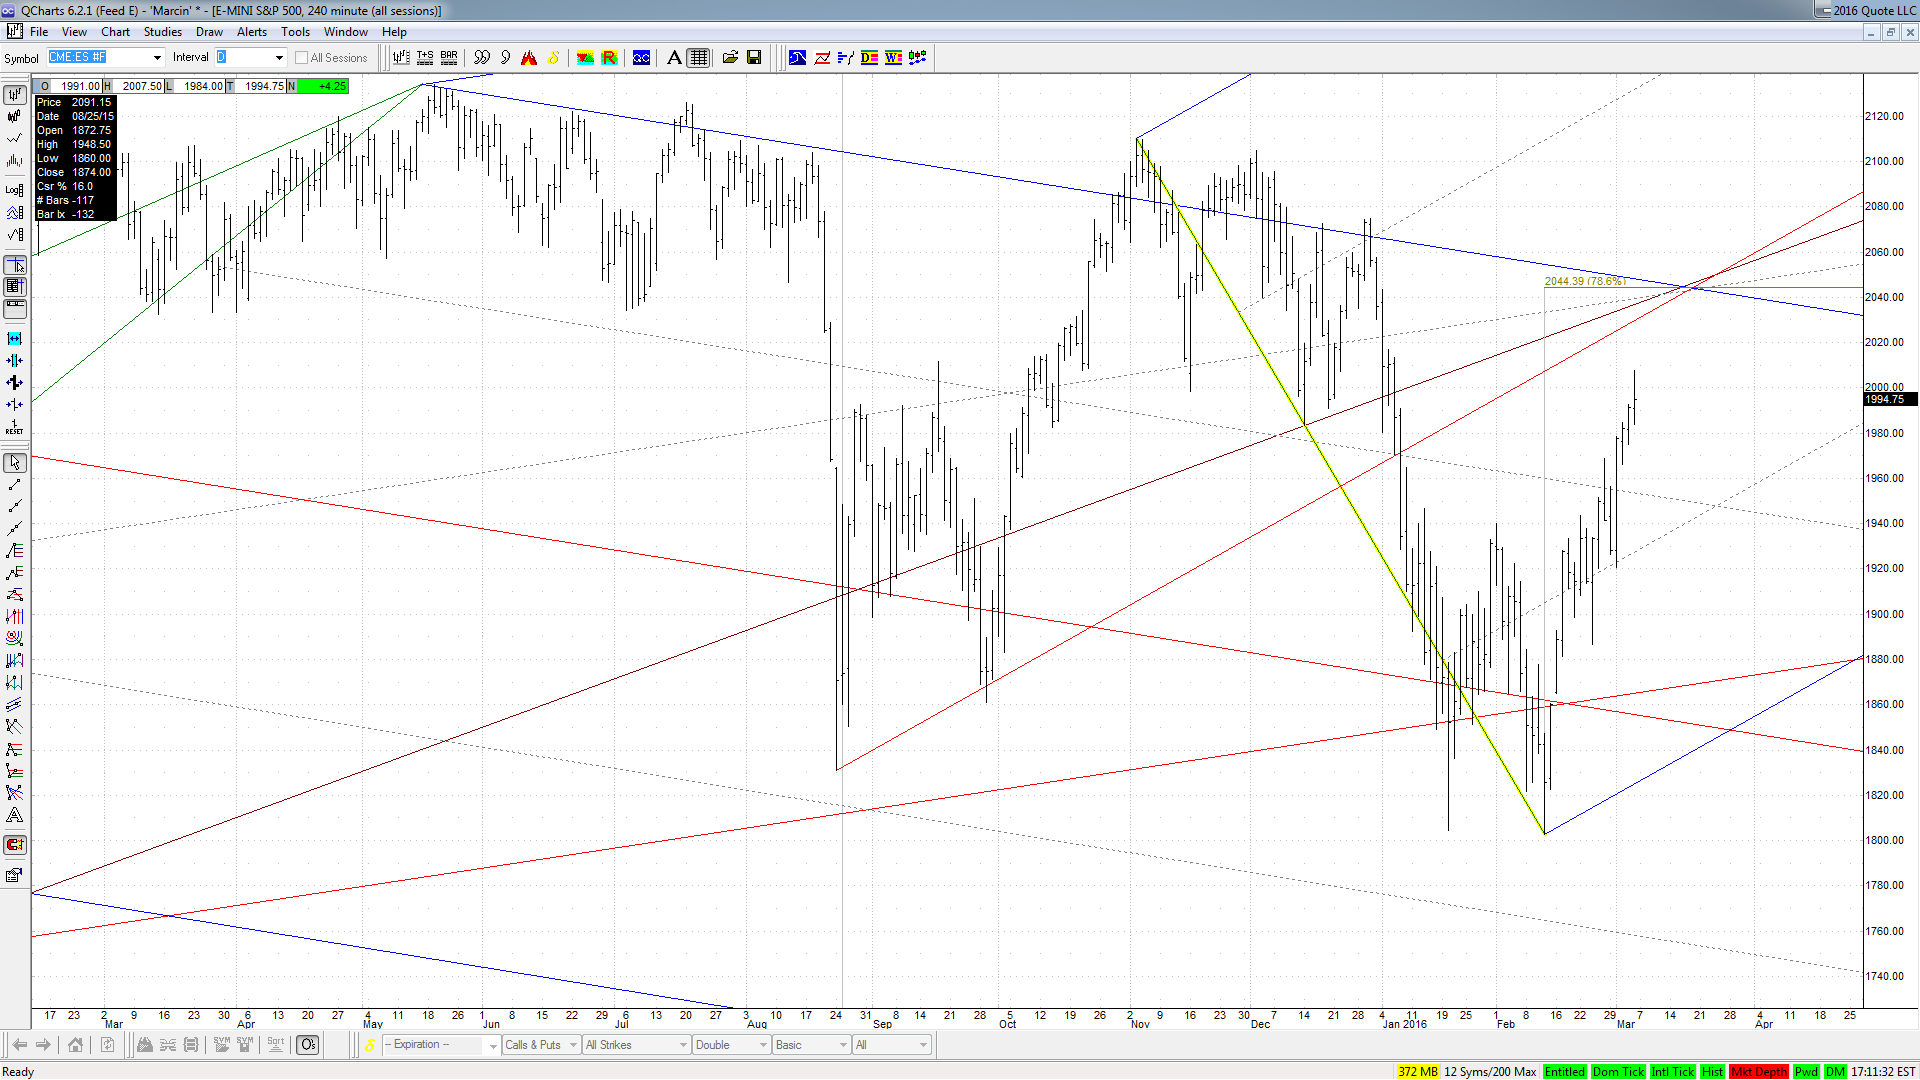
A stronger resistance is between 32 and 44, I guess.
Click image for original size
es 2016 03 06 2 png


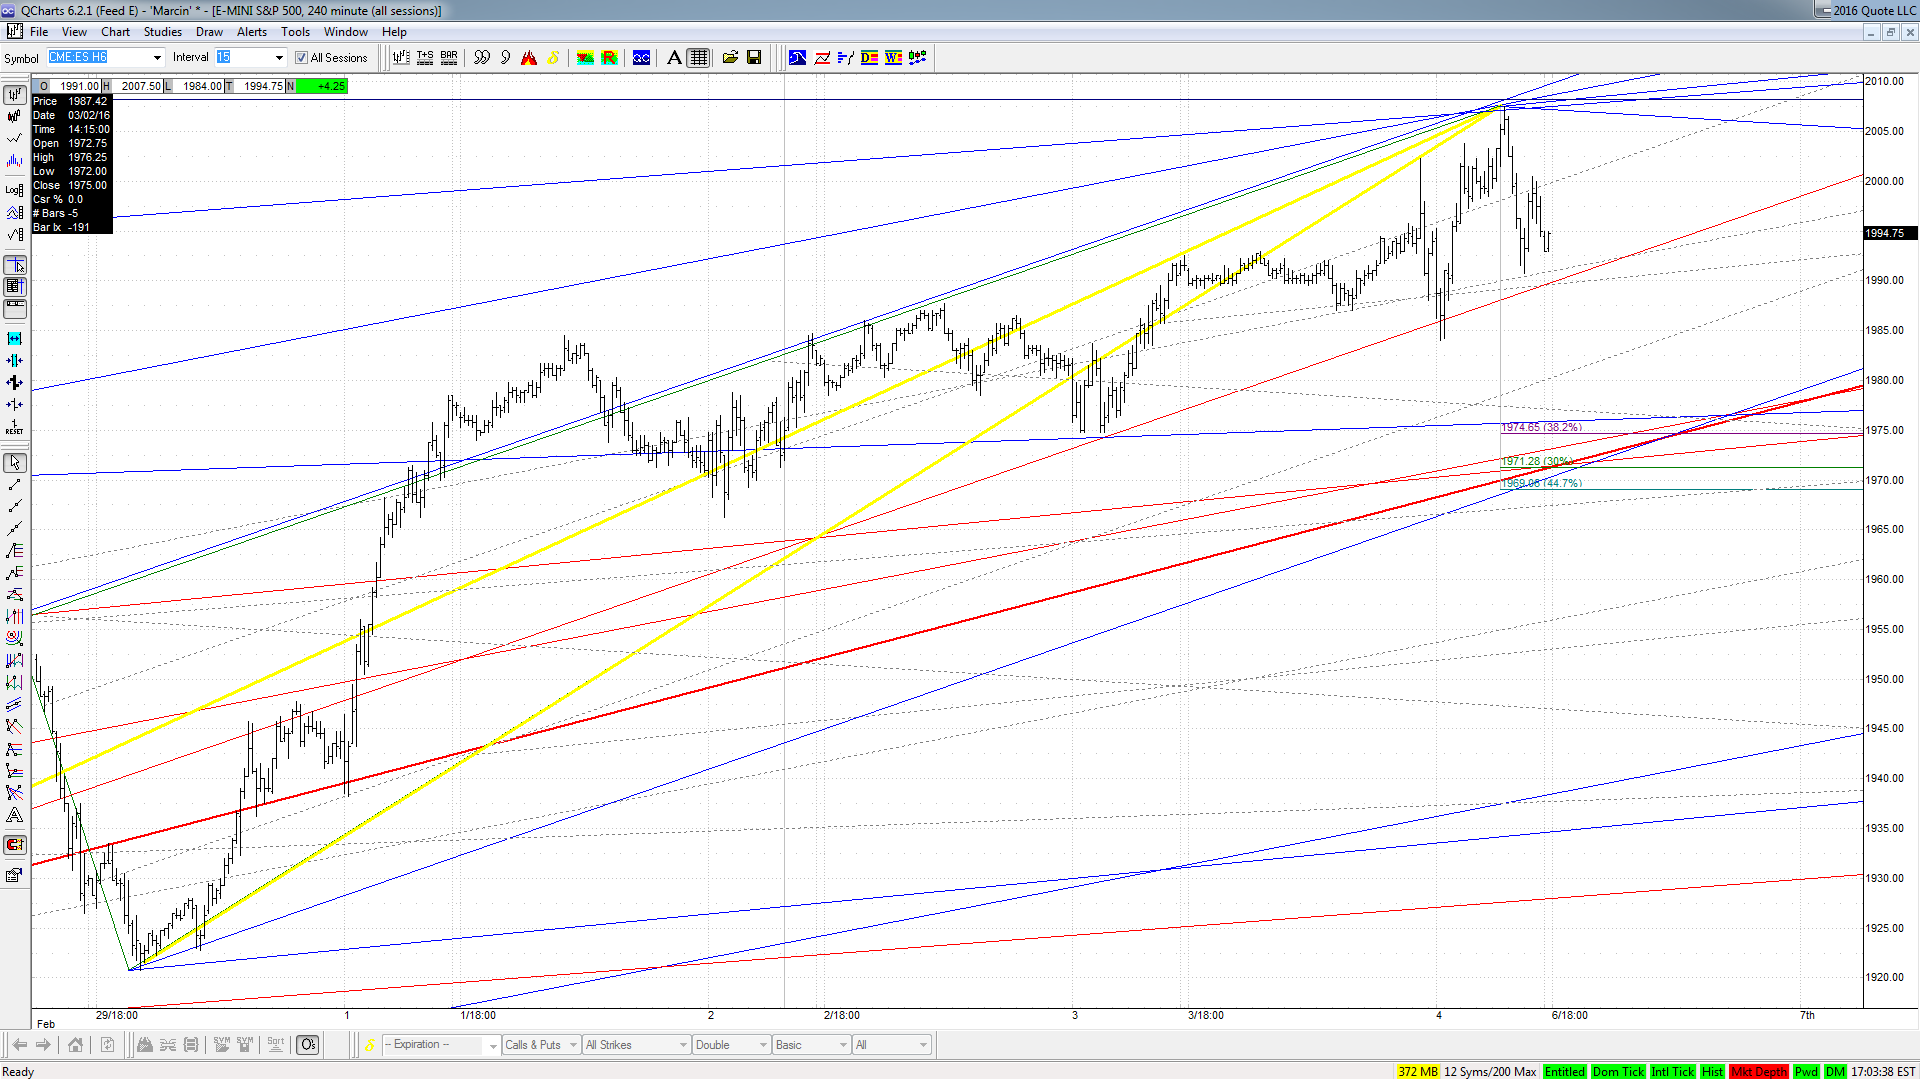
But before that, I would suppose a correction to low 70s.
Click image for original size
es 2016 03 06 3 png
JI
jimkane
Rep: 3,058
Posts: 33,089
But, it poked its head over the TL, so it could be a snap trap.
JI
jimkane
Rep: 3,058
Posts: 33,089
Anyway, my bet is on the upside here, off that pullback, so we'll see.
JI
jimkane
Rep: 3,058
Posts: 33,089
96-97 and 2004-05 are my areas, if it proves it is more than a fake to the very high end of the area, which it is at right now.
JI
jimkane
Rep: 3,058
Posts: 33,089
It would be curious if it pushed the top of the area here, broke the TL, and then they cratered it.
RA
rat89
Rep: 0
Posts: 7,015
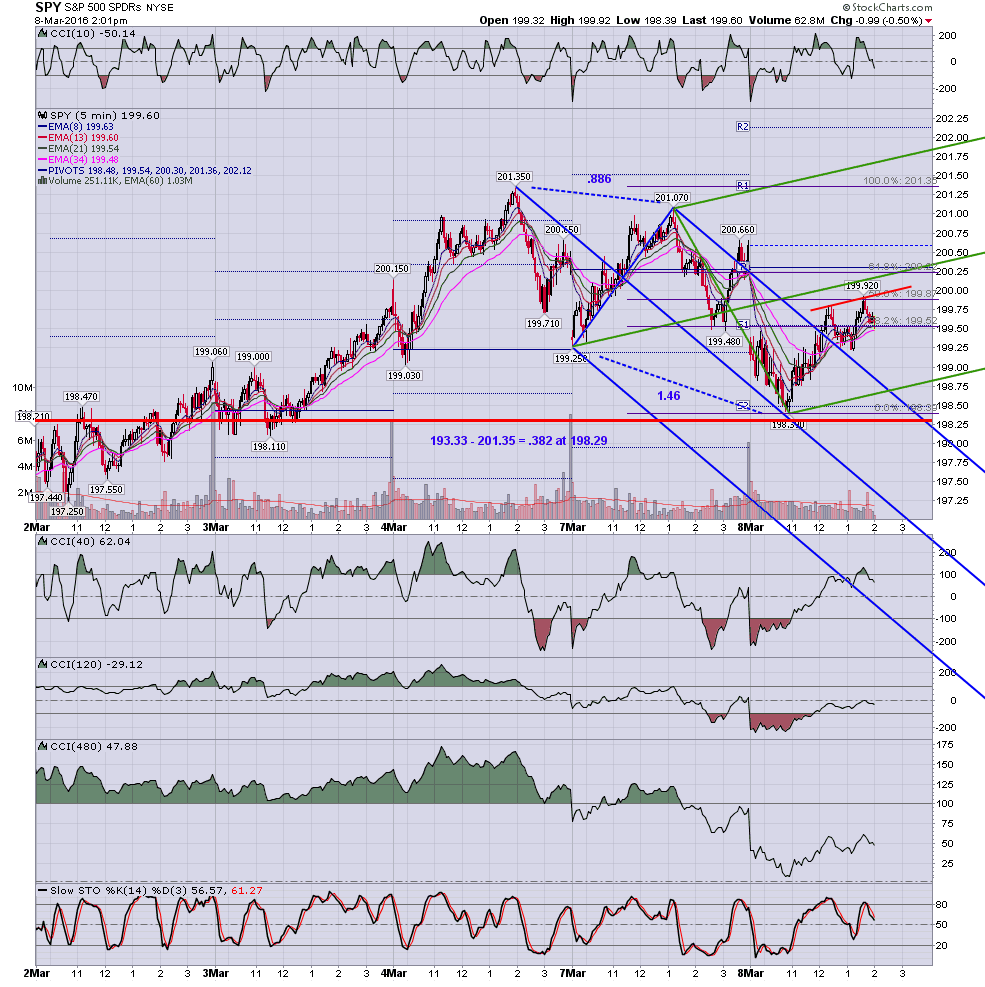
Click image for original size
screen shot 2016 03 08 at 2 01 52 pm png
JI
jimkane
Rep: 3,058
Posts: 33,089
Is it finally time, or just more BS?
JI
jimkane
Rep: 3,058
Posts: 33,089
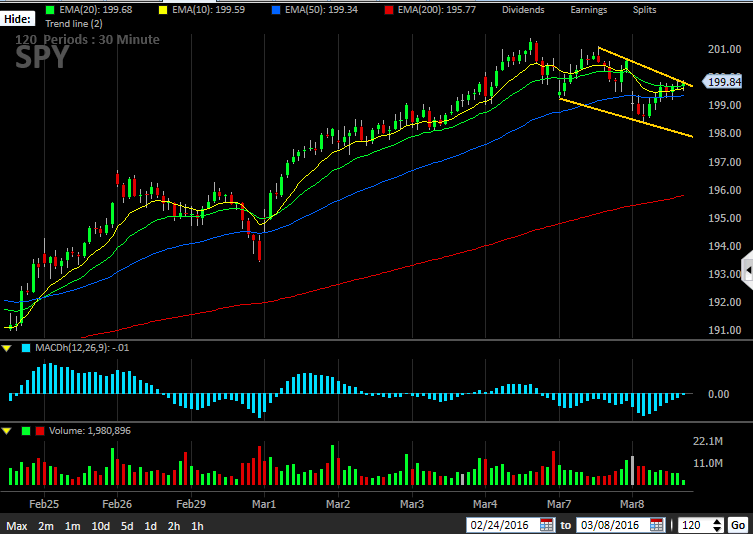
If this breaks free, rat, look at that 202 area line magnet...


Originally posted by rat89

Click image for original size
screen shot 2016 03 08 at 2 01 52 pm png

RA
rat89
Rep: 0
Posts: 7,015
thought I posted these....forgive me if it's a double post
Click image for original size
screen shot 2016 03 08 at 2 09 12 pm png


From earlier:
Click image for original size
screen shot 2016 03 08 at 11 56 14 am png
JI
jimkane
Rep: 3,058
Posts: 33,089
This is the most tired of 'overlapping swings' I can recall being in a long, long time.
JI
jimkane
Rep: 3,058
Posts: 33,089
Okay, the big sell now?
RA
rat89
Rep: 0
Posts: 7,015
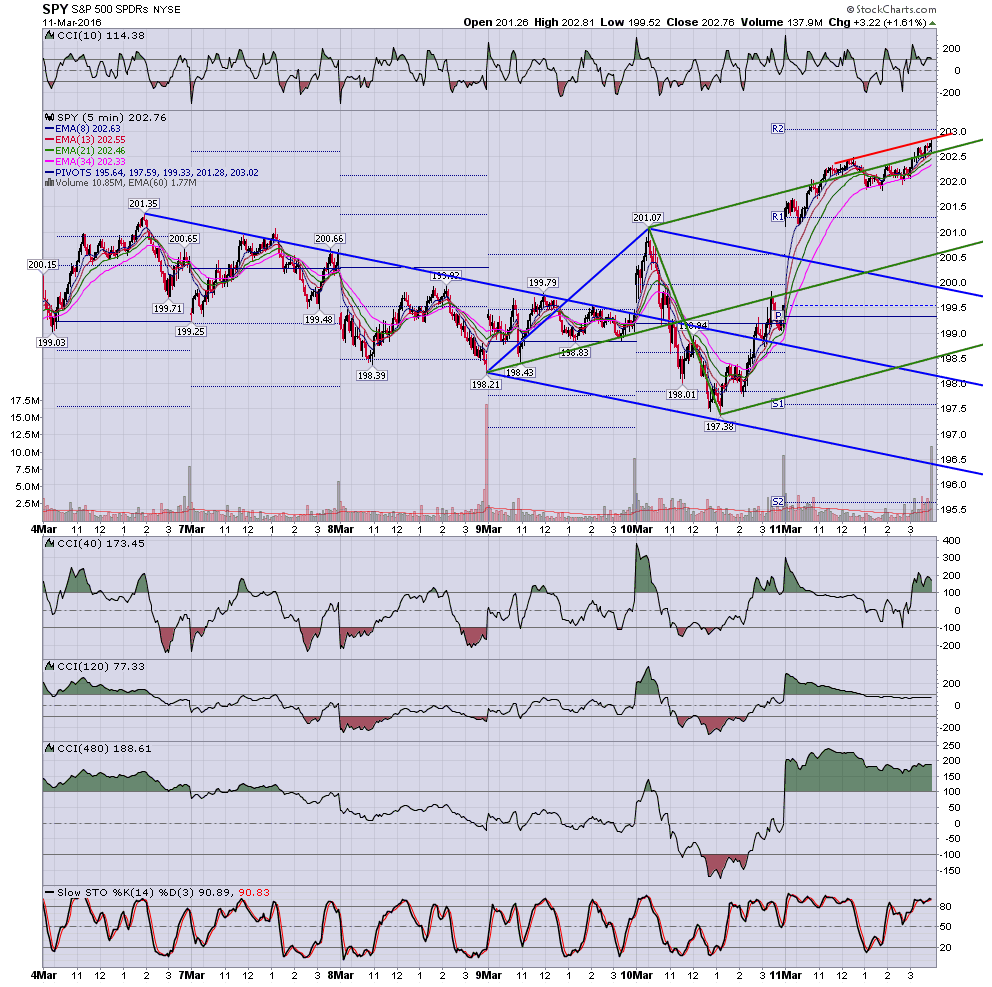
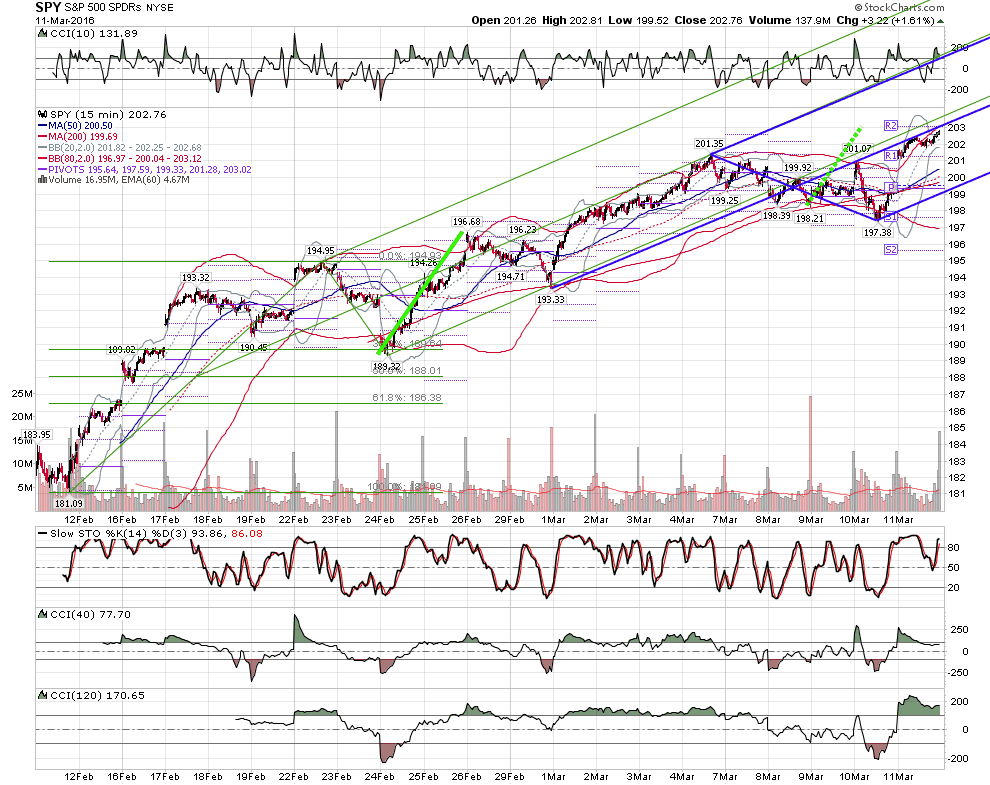
they put it exactly where they had to put it into the close, where (5)=(1) at 2022 spx and 202.77 spy


Click image for original size
screen shot 2016 03 11 at 6 43 34 pm png

Click image for original size
screen shot 2016 03 11 at 6 43 46 pm png