Kicking it off.
I hope to be more active here this week.
AL
albert
Rep: 99
Posts: 3,094
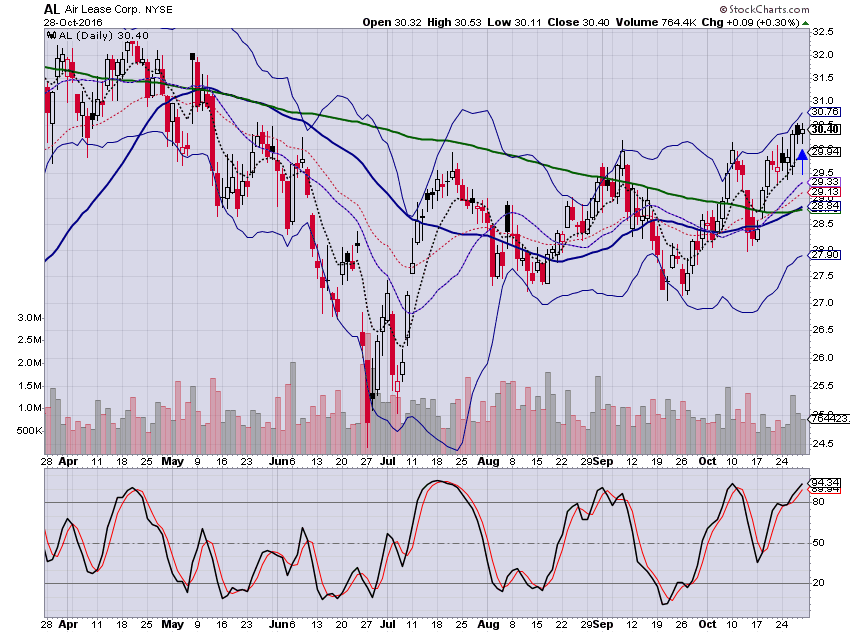
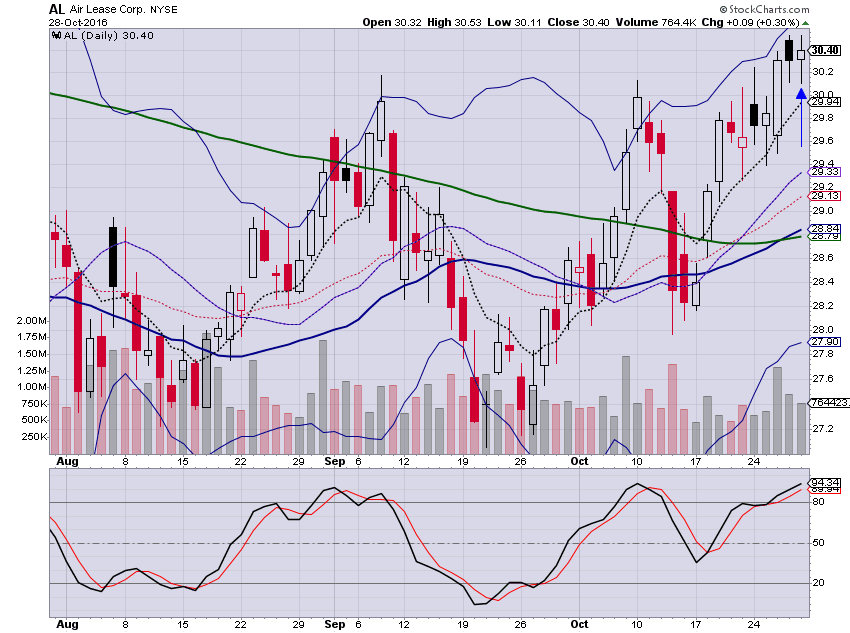
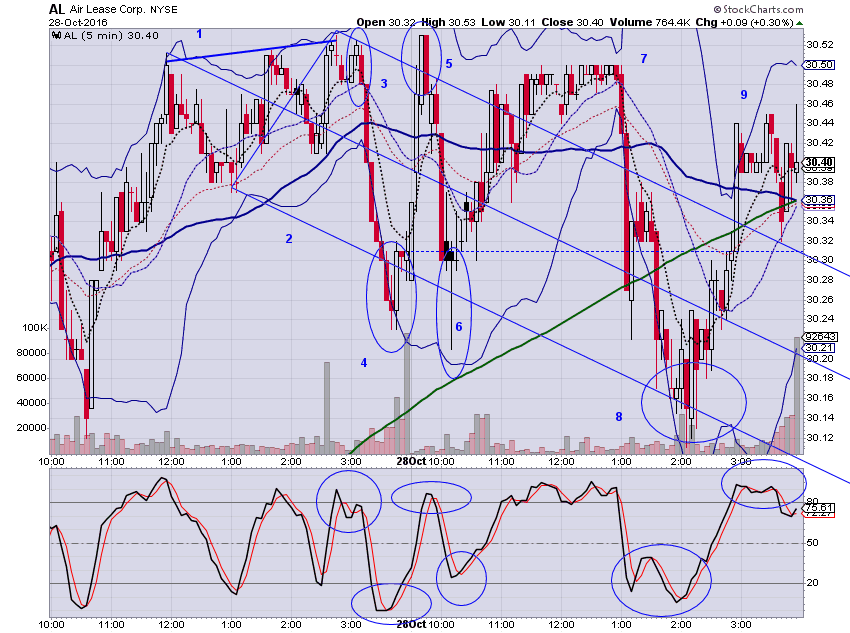
Daily Chart is Stockchart.com's Predefined "Bullish 50/200-Day MA Crossover" Scan based on 10/27/16 EOD Daily data. Next chart is same data on a 3 month span. Please note arrow pointing at Doji, showing today's price action. Next is same data on a 5 minute chart, showing price action.
1 3D-Based Trendline, 1.128 DBS 10/27/16
2 1.128 DBS-based ML Set
3 0.886 ML Upper// Touch with Price Drop
4 Price reversal near ML Lower//. Fibo call it 0.707, STO OS
5 Price Reversal at Upper ML //. Fibo 1, STO OB
6 Price reversal near ML Lower// and 200 Area. Fibo 0.786, STO OS
7 Price Reversal at Upper ML //. Fibo 0.886, STO OB
8 Price reversal near ML Lower//. STO OS, 5 Point Pattern
XABCD
XAB = 0.886
ABC = Between 0.5 and 0.618
BCD = Overshot 1.688
Y*AB=CD, Y = 1
XAD = 1.618 Plus
9 STO OB
Hope I got it right!
I was at the Doctor's office for part of the day.
Kane Trading rocks.
Simply Awesome
Al
Click image for original size
Click image for original size
Click image for original size
1 3D-Based Trendline, 1.128 DBS 10/27/16
2 1.128 DBS-based ML Set
3 0.886 ML Upper// Touch with Price Drop
4 Price reversal near ML Lower//. Fibo call it 0.707, STO OS
5 Price Reversal at Upper ML //. Fibo 1, STO OB
6 Price reversal near ML Lower// and 200 Area. Fibo 0.786, STO OS
7 Price Reversal at Upper ML //. Fibo 0.886, STO OB
8 Price reversal near ML Lower//. STO OS, 5 Point Pattern
XABCD
XAB = 0.886
ABC = Between 0.5 and 0.618
BCD = Overshot 1.688
Y*AB=CD, Y = 1
XAD = 1.618 Plus
9 STO OB
Hope I got it right!
I was at the Doctor's office for part of the day.
Kane Trading rocks.
Simply Awesome
Al