MA
MarcinO
Rep: 67
Posts: 5,506
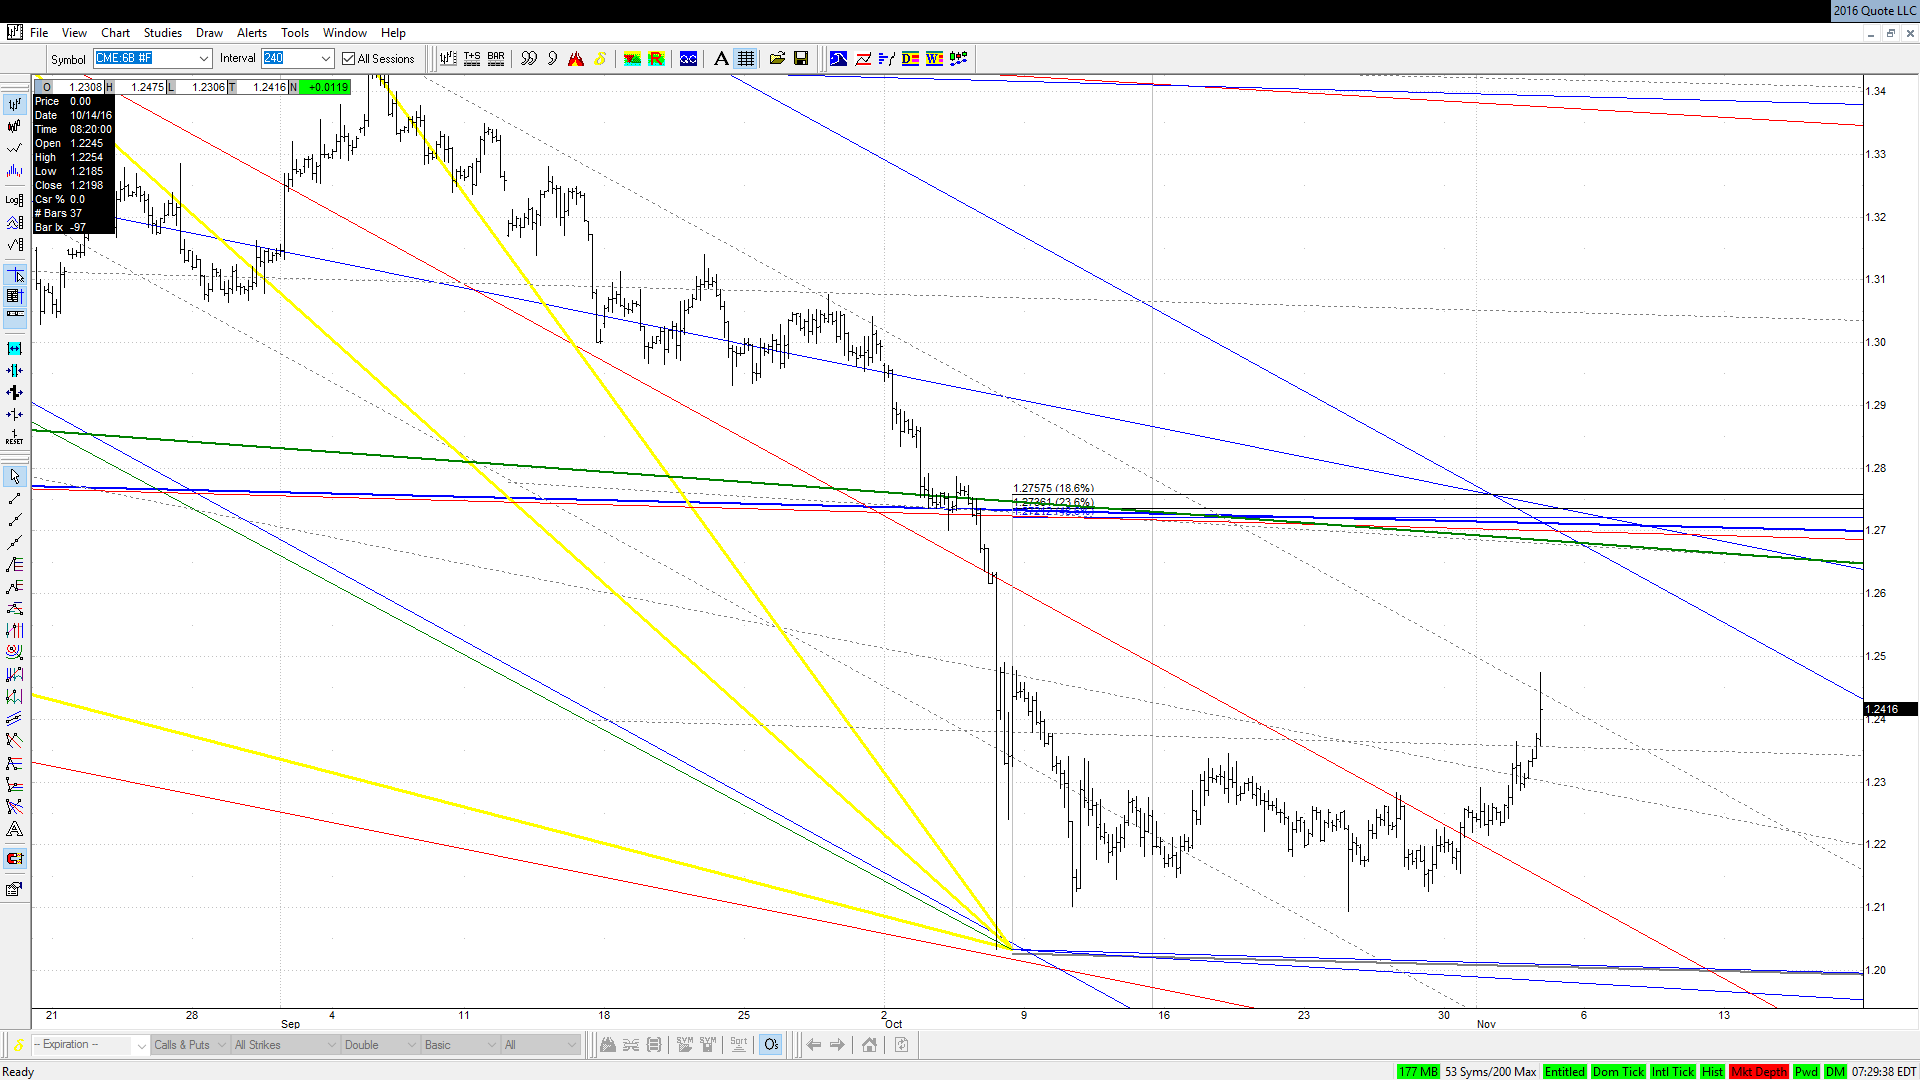
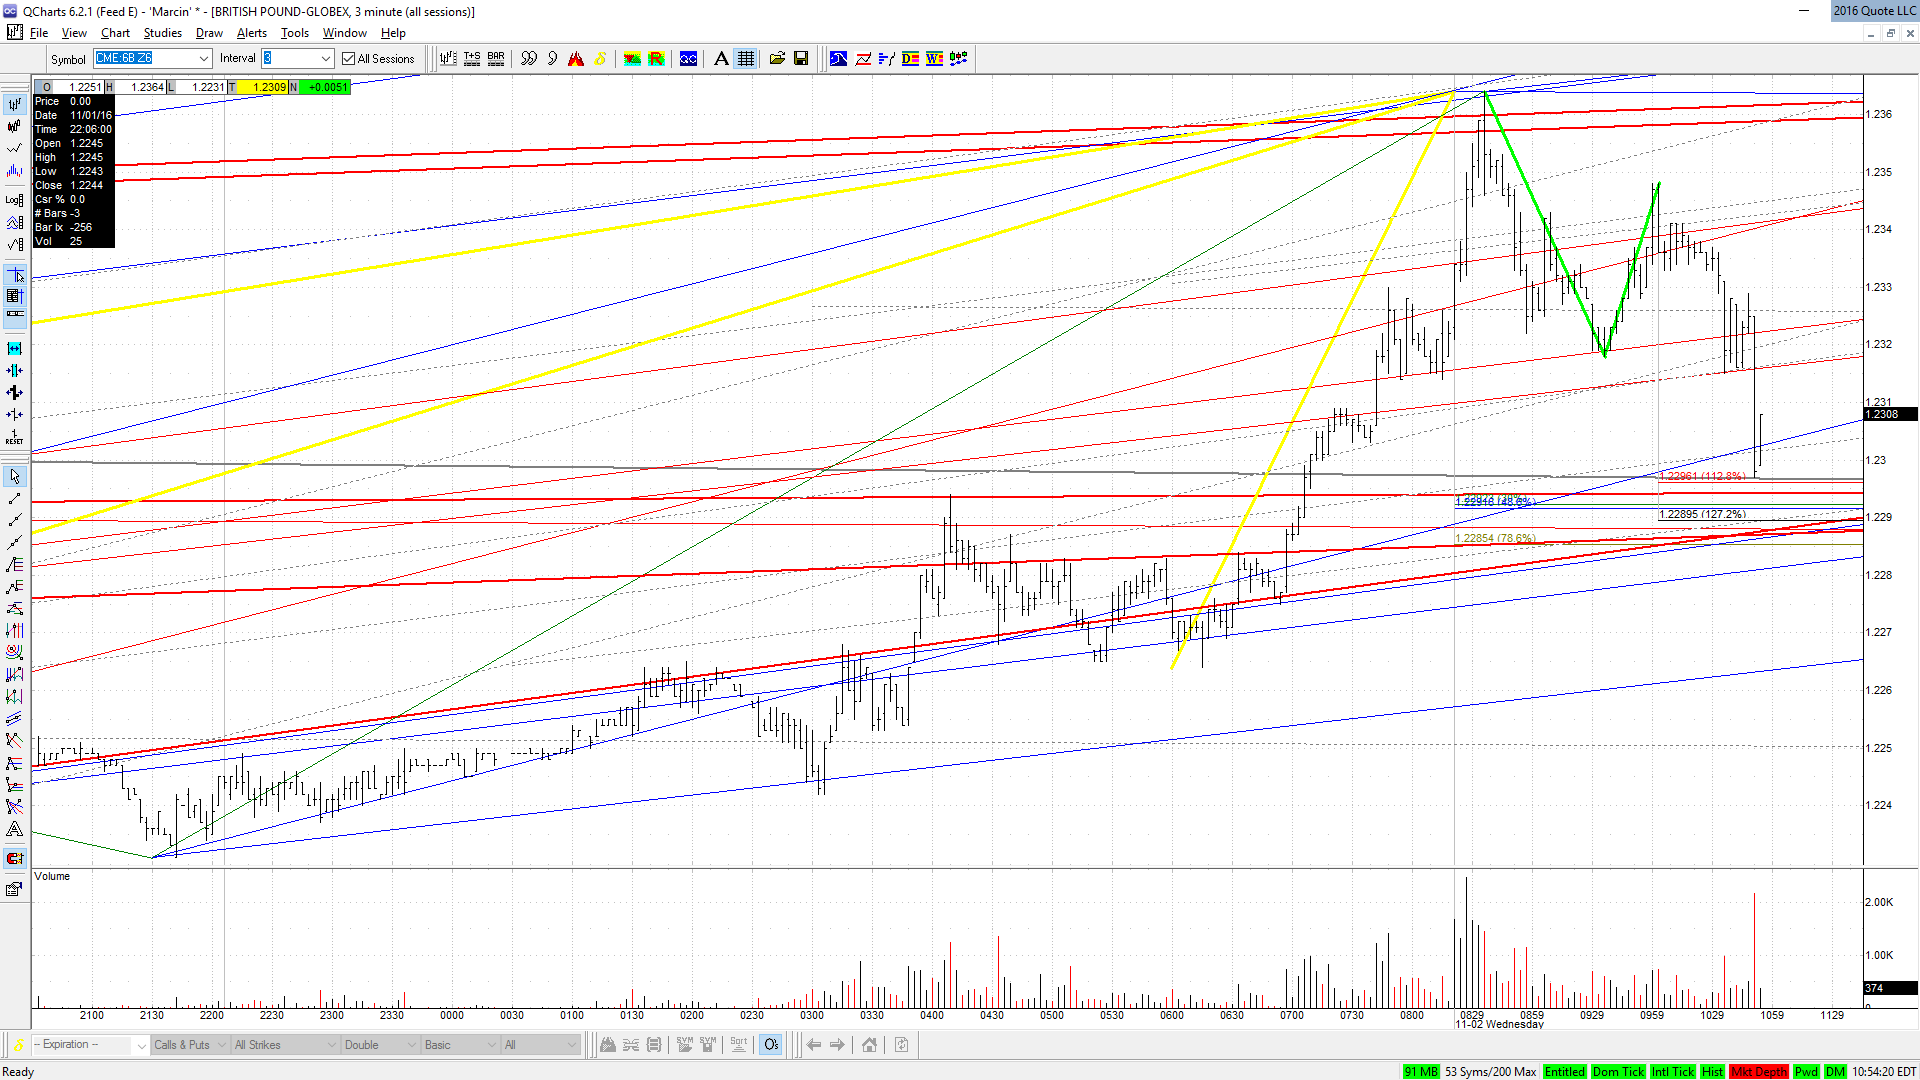
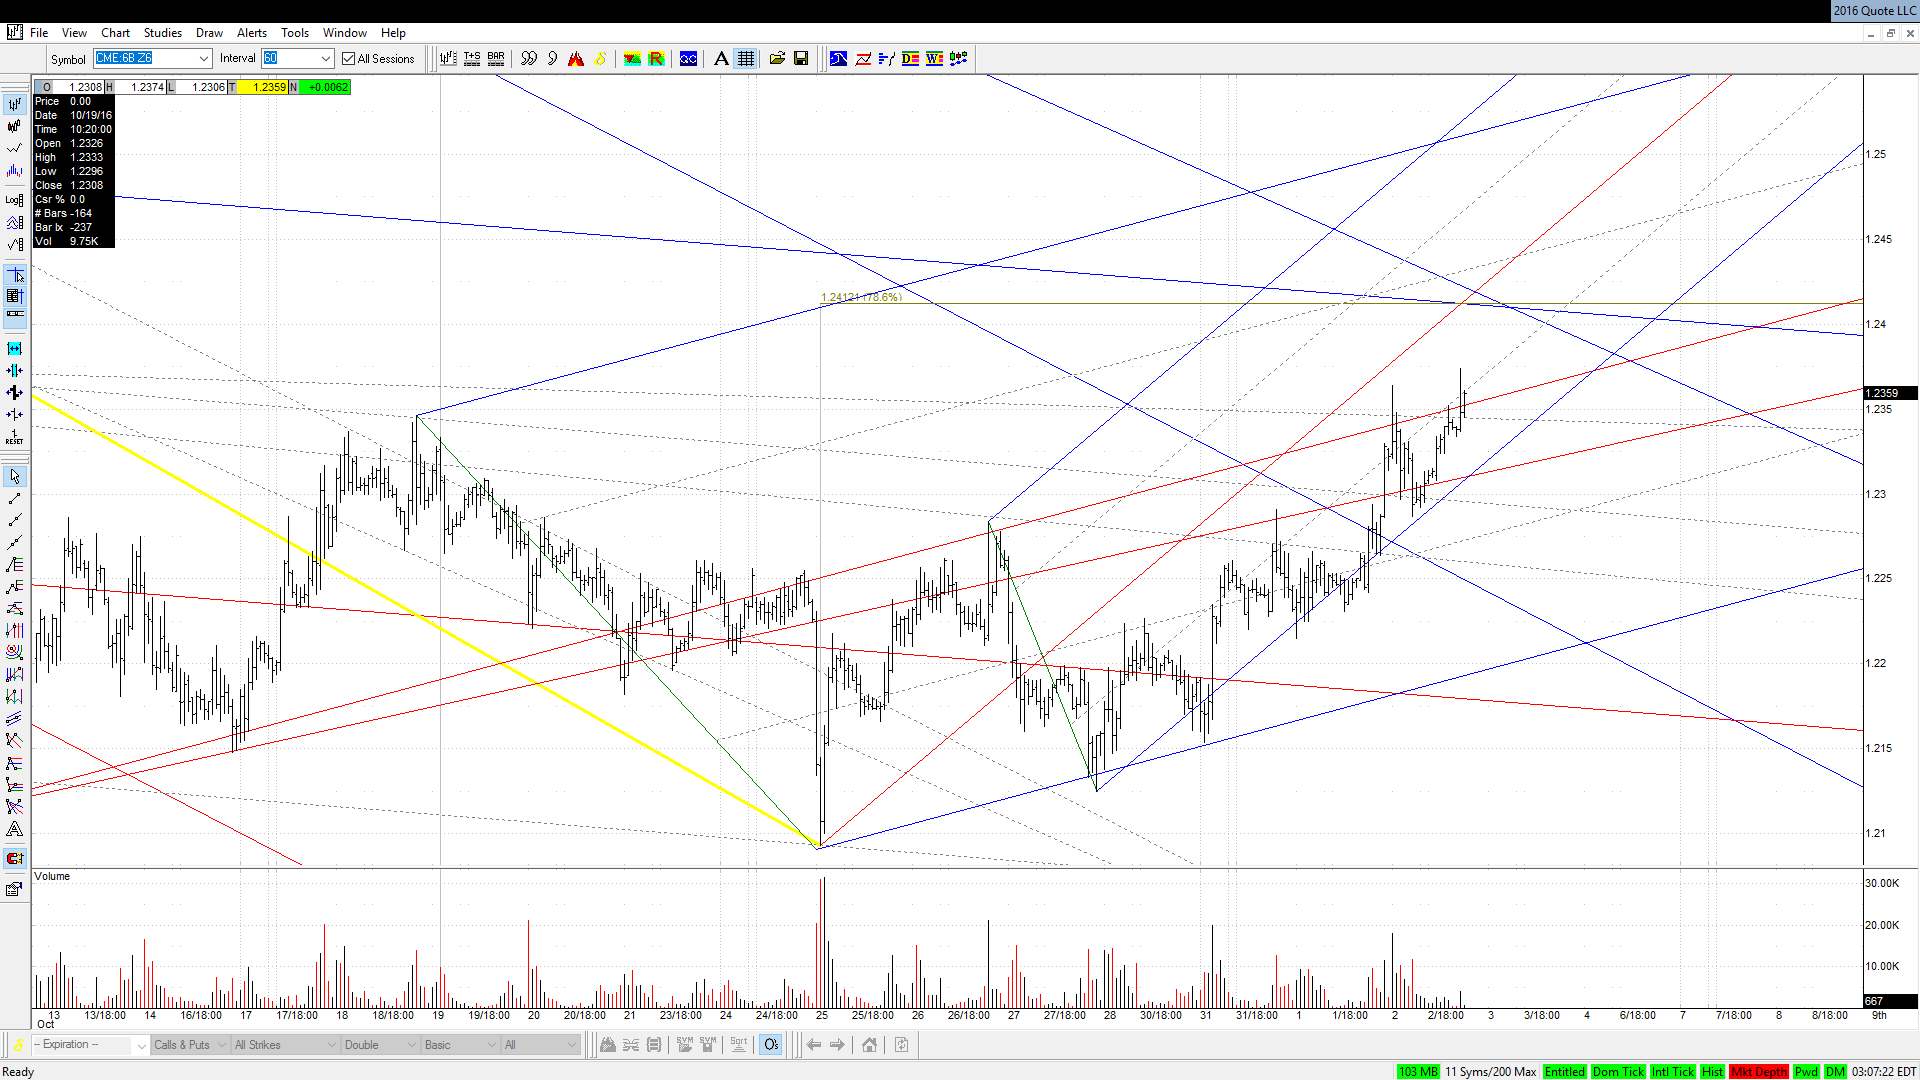
Cable is on fire today. I wonder if they will send it to 1.24 from here.
Click image for original size
AL
albert
Rep: 99
Posts: 3,094
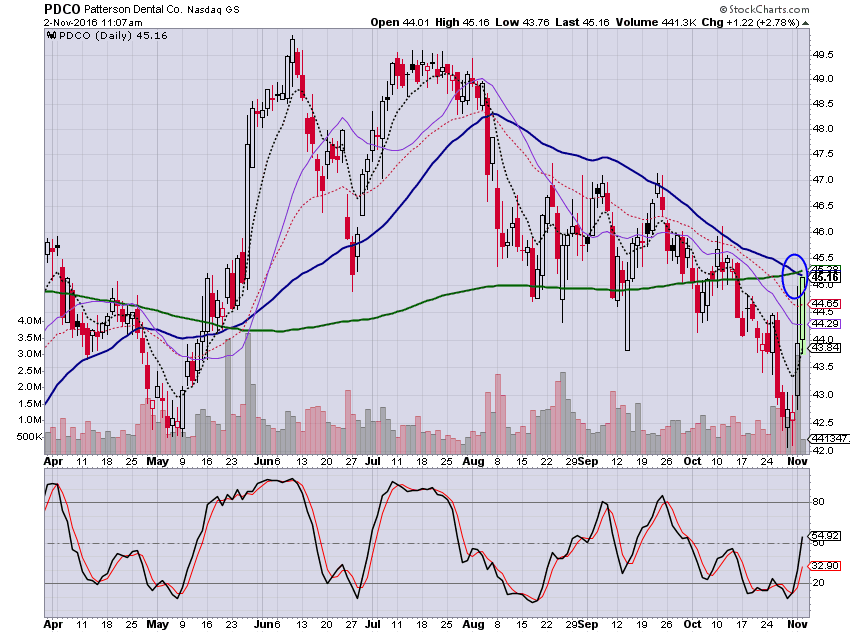
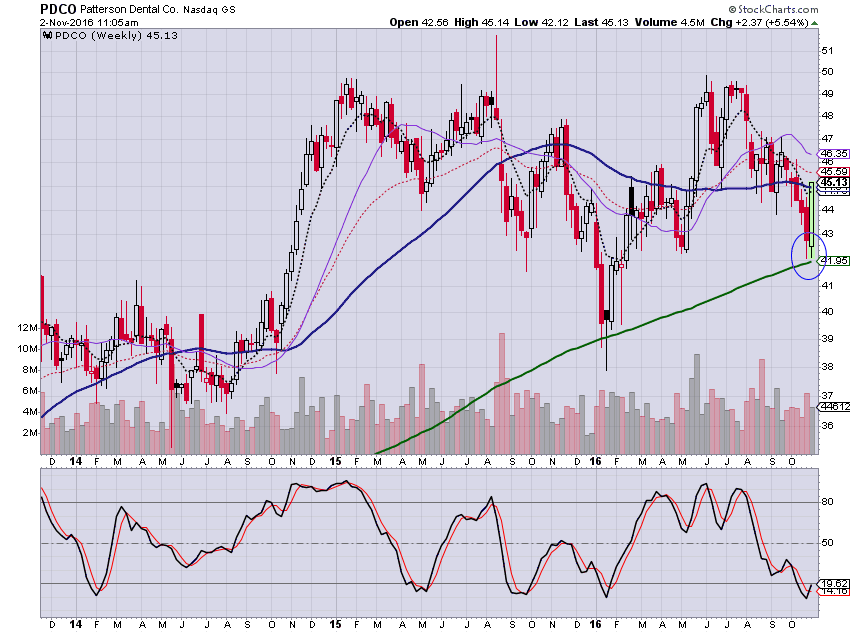
Found PDCO with StockChart.com's "BEARISH 50/200-DAY MA CROSSOVERS" Predefined Scan.
Noticed PDCO price was rising. Higher TF PDCO Weekly showed price contacting - and reacting to- the 200.
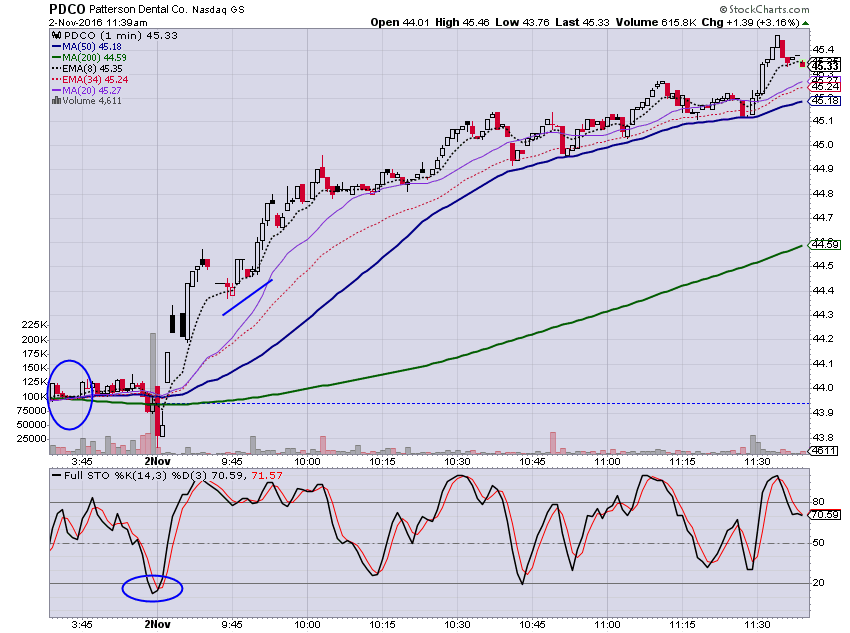
Lower TF PDCO on 1 min chart shows 50 crossing above 200 and with STO OS at the CLOSE. Today's PDCO price action showed good support at 8ema.
Click image for original size
Noticed PDCO price was rising. Higher TF PDCO Weekly showed price contacting - and reacting to- the 200.
Click image for original size
Lower TF PDCO on 1 min chart shows 50 crossing above 200 and with STO OS at the CLOSE. Today's PDCO price action showed good support at 8ema.
Click image for original size
RA
rat89
Rep: 0
Posts: 7,015
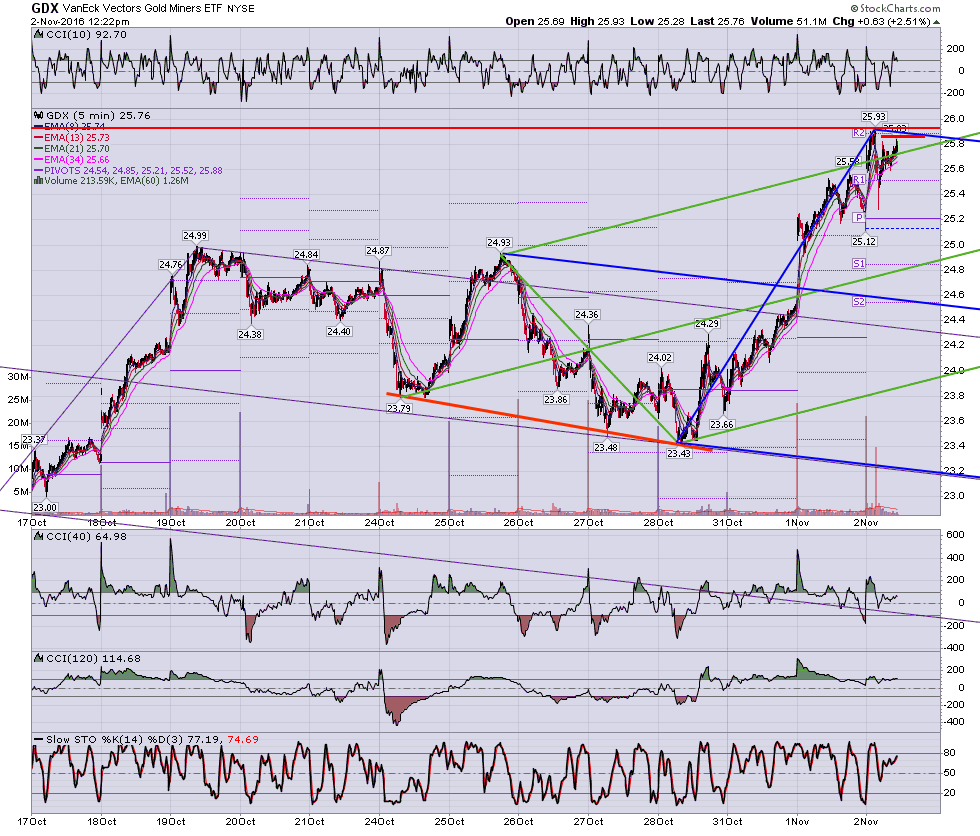
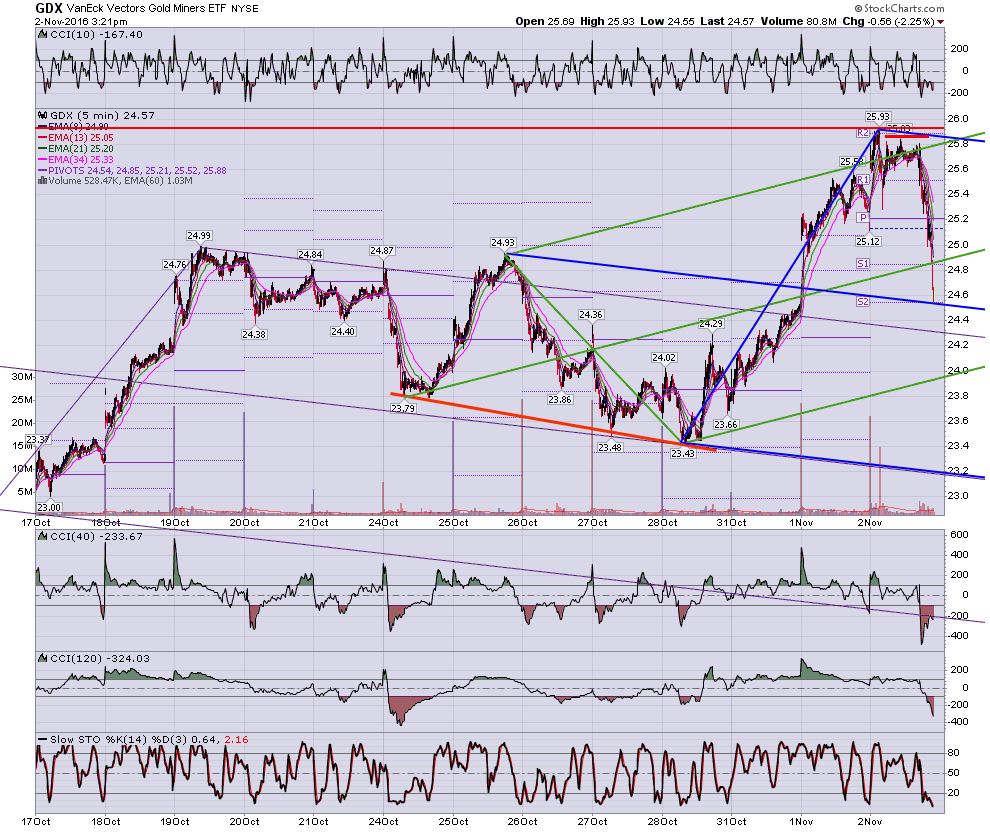
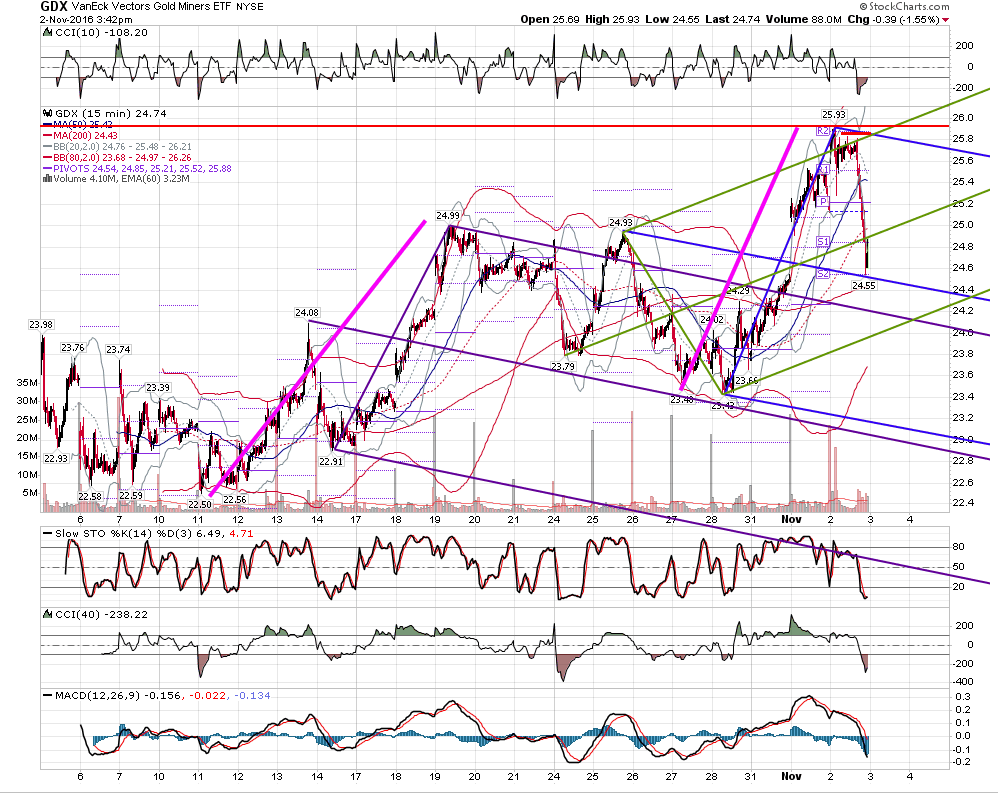
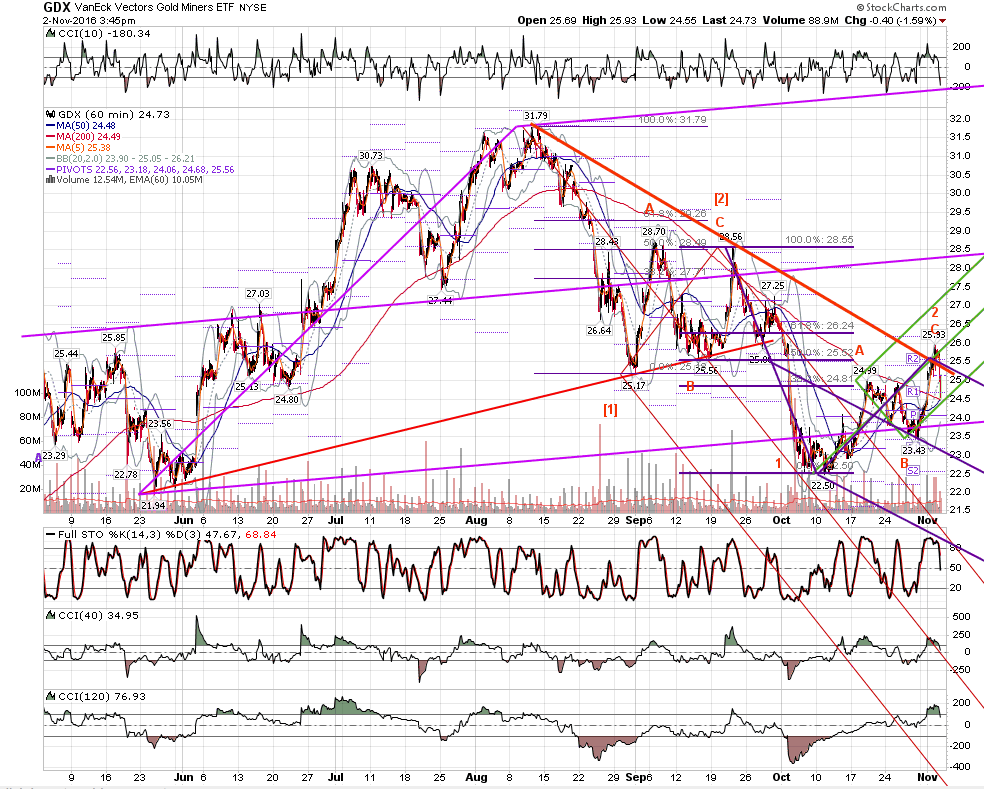
gdx charts – it doesn’t get any better than this: early reverse off resistance were wave C=A at red line, fall, bounce up and retest at the .886 (short red line) and shoot down to the median line.
Click image for original size
Click image for original size
Click image for original size
Click image for original size
MA
MarcinO
Rep: 67
Posts: 5,506
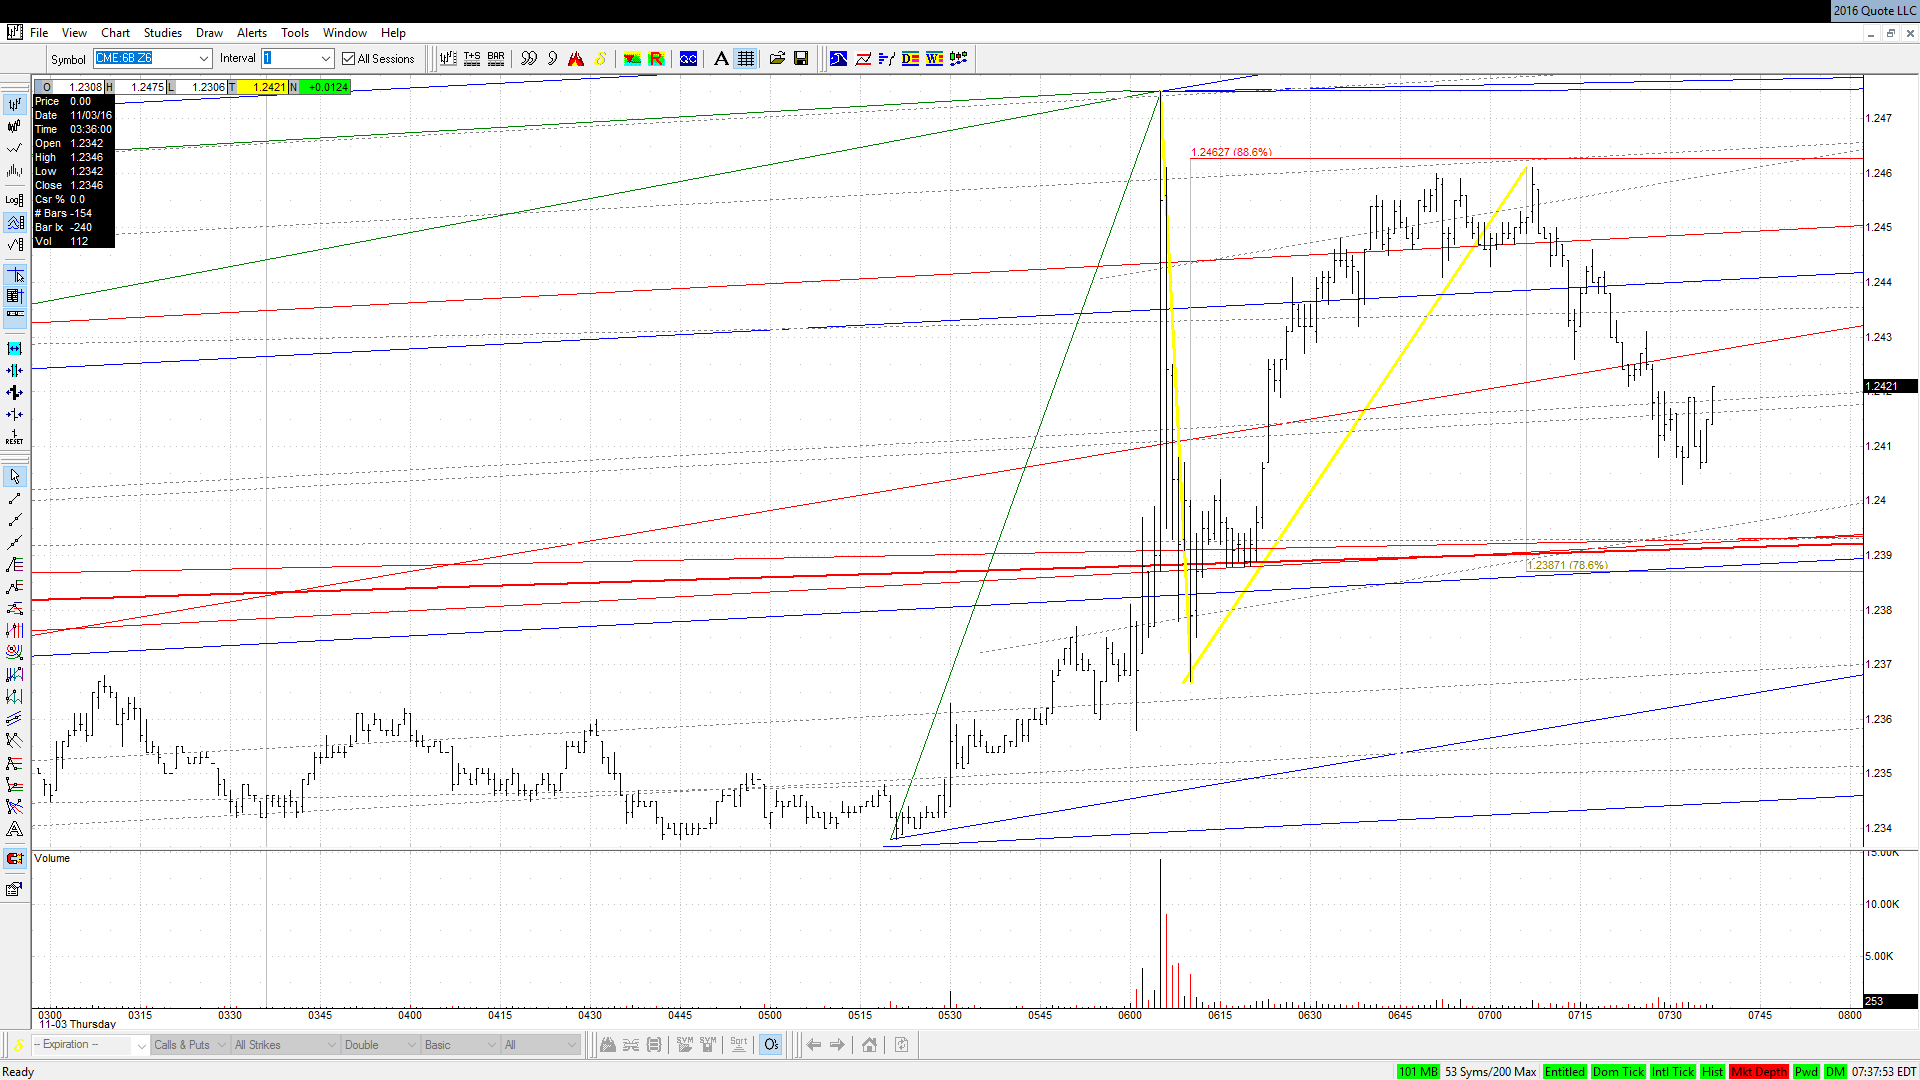
80 pips up right off that level,
Chart for 1.24+ area.
Originally posted by MarcinO
Cable is on fire today. I wonder if they will send it to 1.24 from here.
Chart for 1.24+ area.
Click image for original size
MA
MarcinO
Rep: 67
Posts: 5,506
Cable broke above 1.24. My next level is a wide area between 1.2540 and 1.26.
MA
MarcinO
Rep: 67
Posts: 5,506
Now we know the reason of Cable's strength. As Jim used to say 'The news arrives when it is needed'.
https://www.fxstreet.com/news/gbp-usd-climbs-to-12450-on-high-court-ruling-201611031022
https://www.fxstreet.com/news/gbp-usd-climbs-to-12450-on-high-court-ruling-201611031022