MA
MarcinO
Rep: 67
Posts: 5,506
Cable going above 1.27. This is interesting here, as my Fib works favour 1.2710-20 but key lines are at 30-40. We will see soon...
MA
MarcinO
Rep: 67
Posts: 5,506
Exactly. Great minds think alike.
Originally posted by Duane
Yeah, both pairs have sweet ABCD's at a good spot, we are heading south.
DU
Duane
Rep: 100
Posts: 1,095
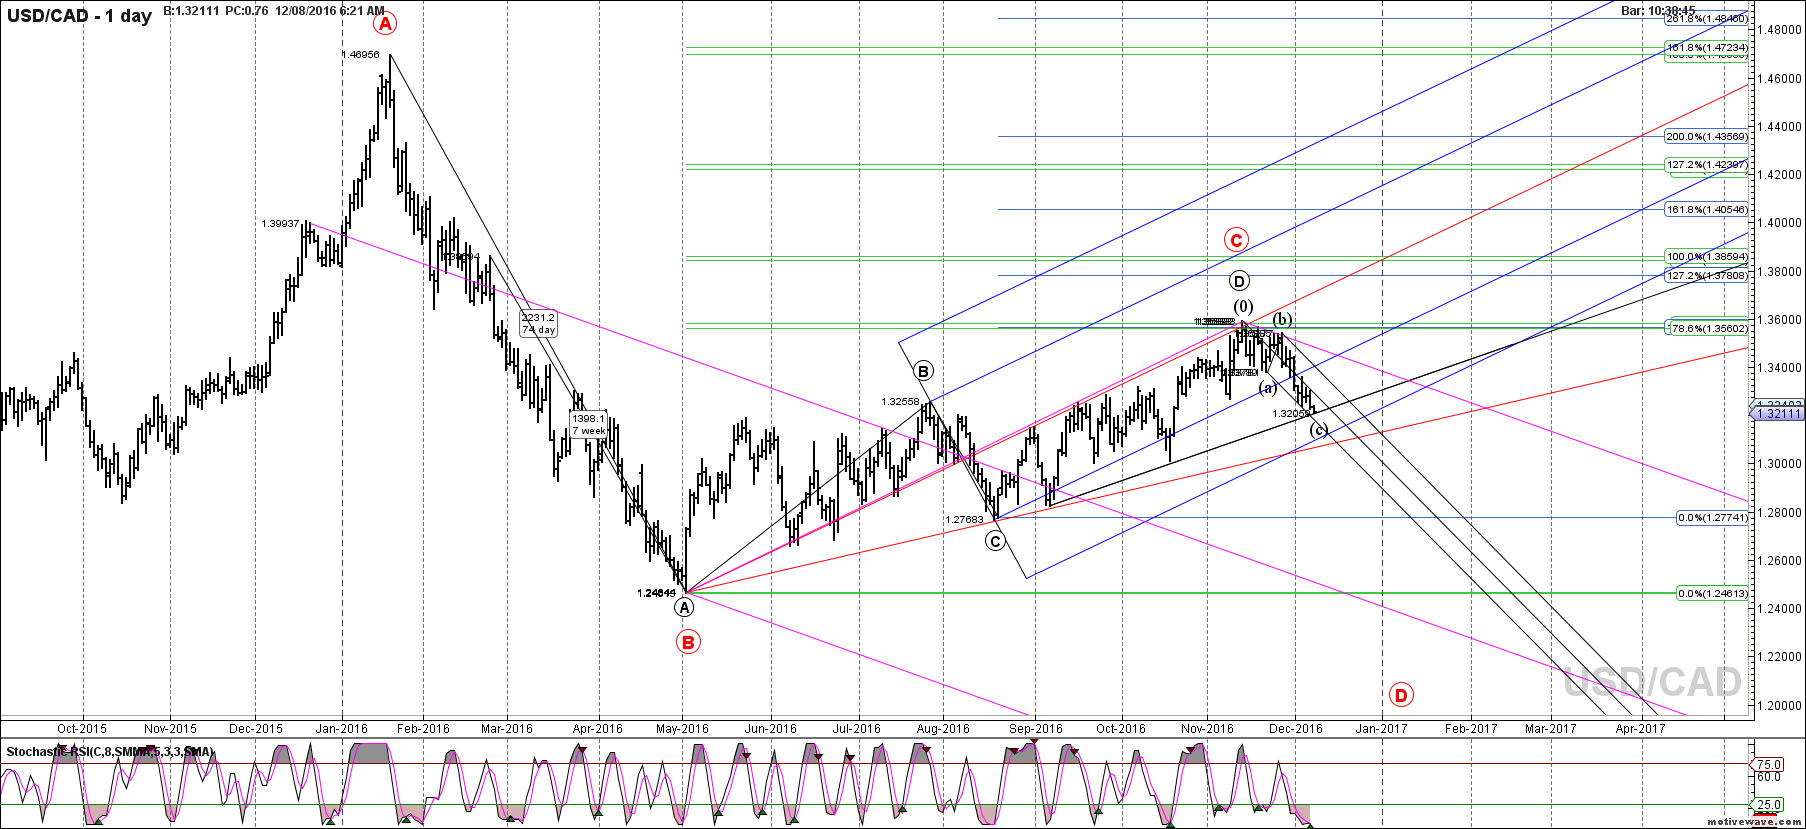
USDCAD progressing nicely. at trendline now.
Click image for original size
RA
rat89
Rep: 0
Posts: 7,015
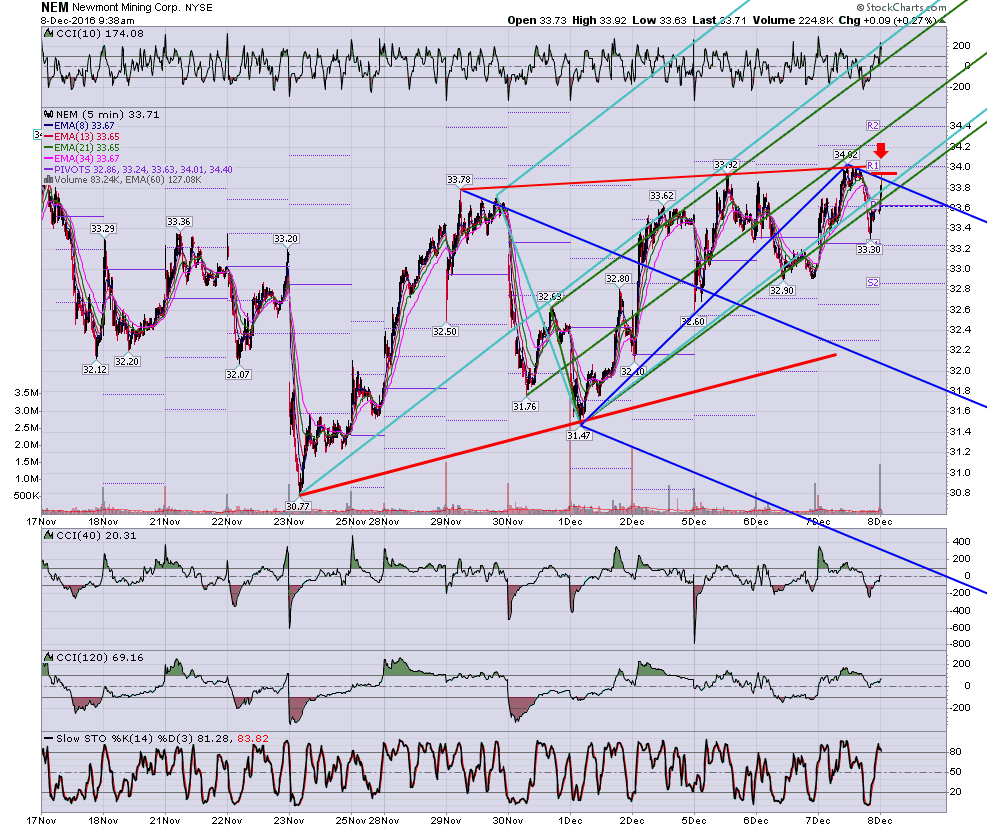
retest at .886 at line
Click image for original size
Click image for original size
AL
albert
Rep: 99
Posts: 3,094
Originally posted by Duane
Thanks, Albert, I consider it a compliment to be called rat. I would love to see more if your charts and know your trading style.
Duane,
You Flatter me. I am only showing the good looking (imo) charts, LOL. After today's trading, all I can say is I am glad I was only paper trading. I was wrong today!
I started looking at more indicators because I am not very good at drawing Median Line sets. Send me a personal message, if you want. I look at different time frames around the Bullish and the Bearish 50 and 200 ma Crossovers for stocks, etc. and see what I can see. KaneTrading precepts help me a lot.
Good Trading,
Al Kamego
AL
albert
Rep: 99
Posts: 3,094
Originally posted by albert
Originally posted by Duane
Thanks, Albert, I consider it a compliment to be called rat. I would love to see more if your charts and know your trading style.
Duane,
You Flatter me. I am only showing the good looking (imo) charts, LOL. After today's trading, all I can say is I am glad I was only paper trading. I was wrong today!
I started looking at more indicators because I am not very good at drawing Median Line sets. Send me a personal message, if you want. I look at different time frames around the Bullish and the Bearish 50 and 200 ma Crossovers for stocks, etc. and see what I can see. KaneTrading precepts help me a lot.
Good Trading,
Er, make that a private message.
Al Kamego
DU
Duane
Rep: 100
Posts: 1,095
Missing Jim. Here are a few of his nuggets that I needed to here...
"If there is any secret at all to trading, it is to trade only those areas that are in this sweet spot."
J.Kane
"I never try to guess my way out of a range."
-Jim
"But, understand, trying to play 'W2's' is a fools game 99.99% of the time (not an actual stat, this is a figurative statement) unless the high is a clear PTA unto itself. Can we say, unequivocally, that the recent high was the top??? Then I'm not expecting the 'W2' area to do much."
Jim Kane
AL
albert
Rep: 99
Posts: 3,094
Originally posted by Duane
Originally posted by albert
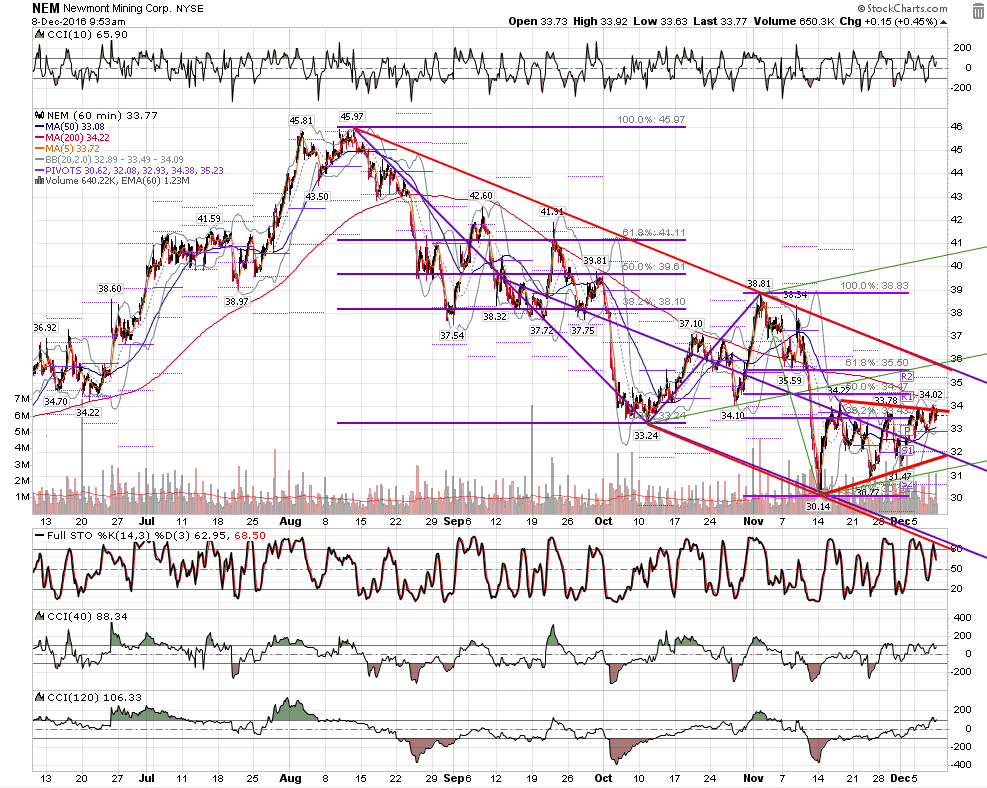
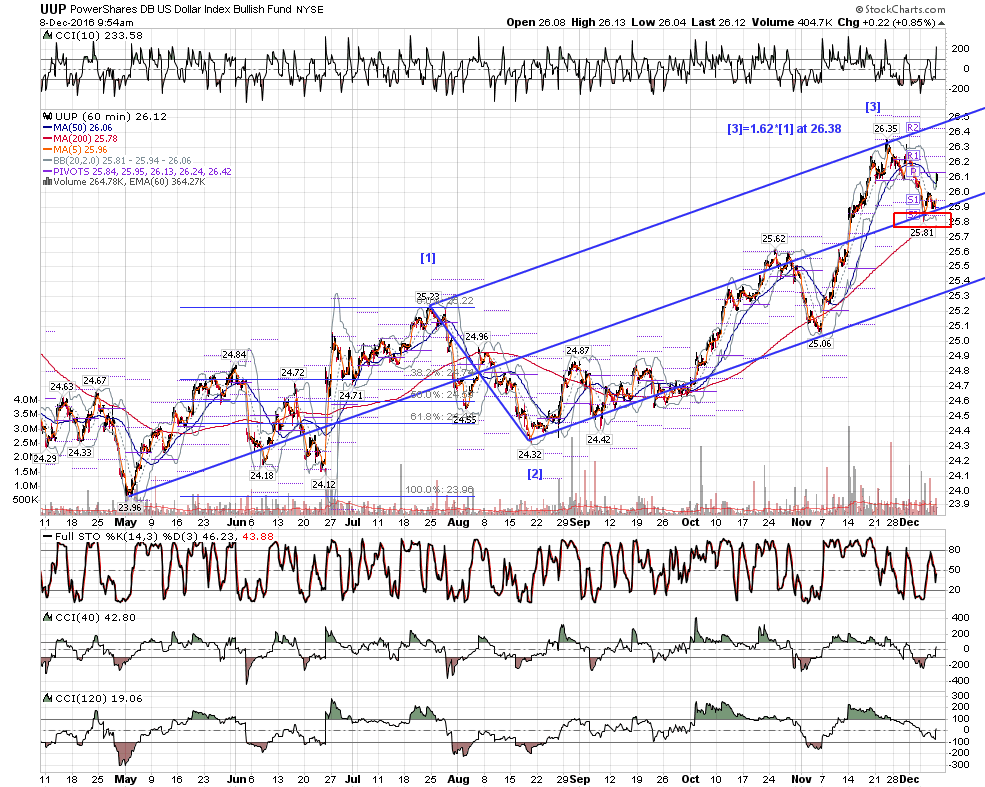
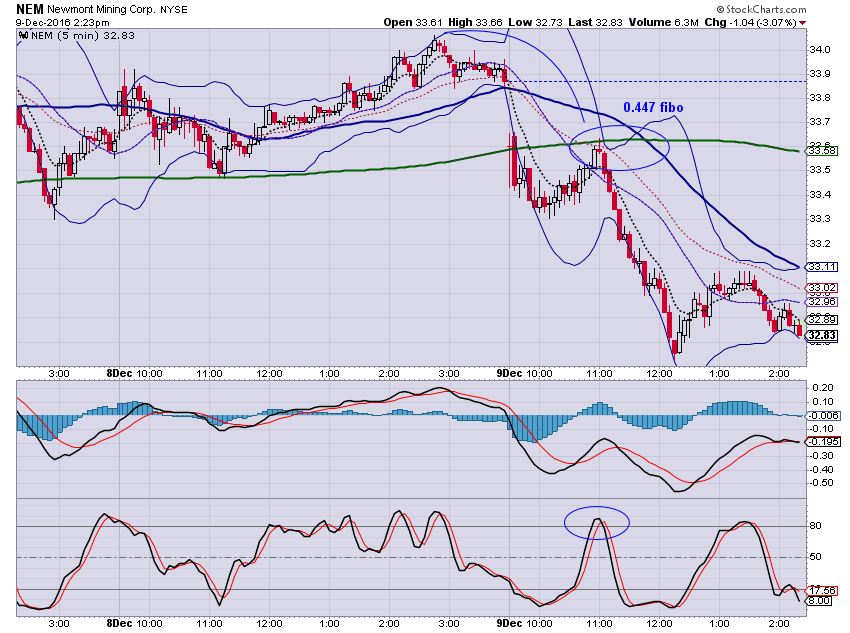
NEM on the 5 minute TF. After the open, it looked like NEM met resistance at the 8 and 20 mas, on the 1 minute. and on the 5 min TF, resistance at the 34 and the 200. Note Bearish 50 X 200.
Click image for original size
Al
Nice trade Albert
Duane,
Thanks. Actually I did not trade that one, darn it. I thought the chart showed some of the things that I look for when trading. I am trying to move my 20/20 hindsight to foresight. : )
Al