stuff
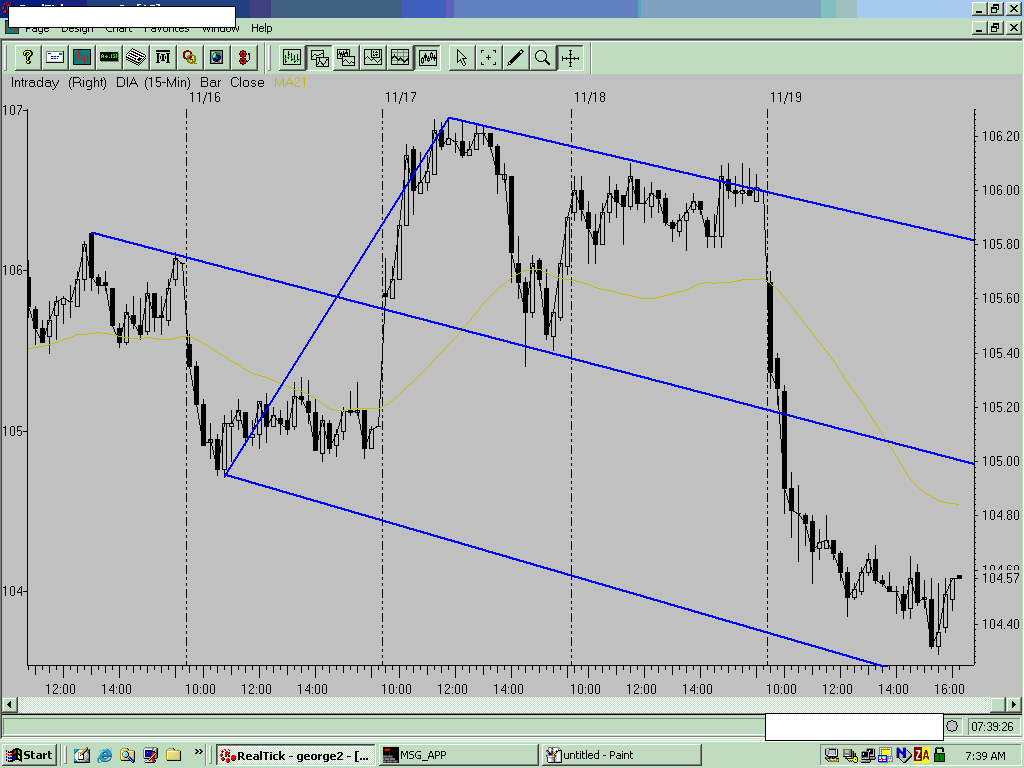
Click image for original size
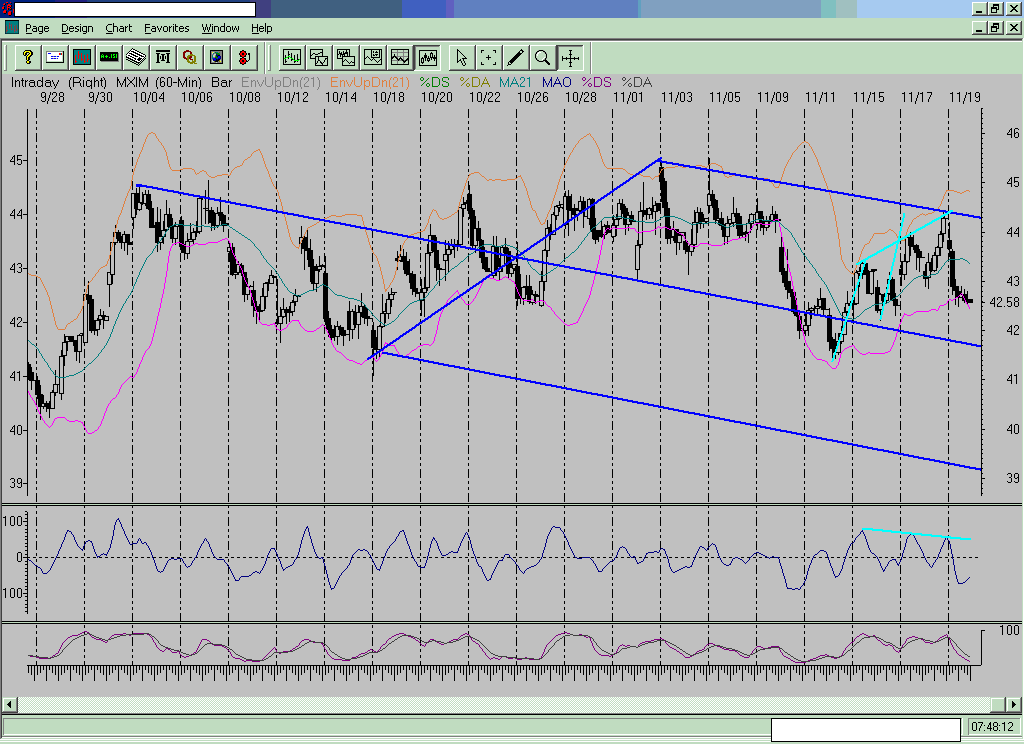
Click image for original size
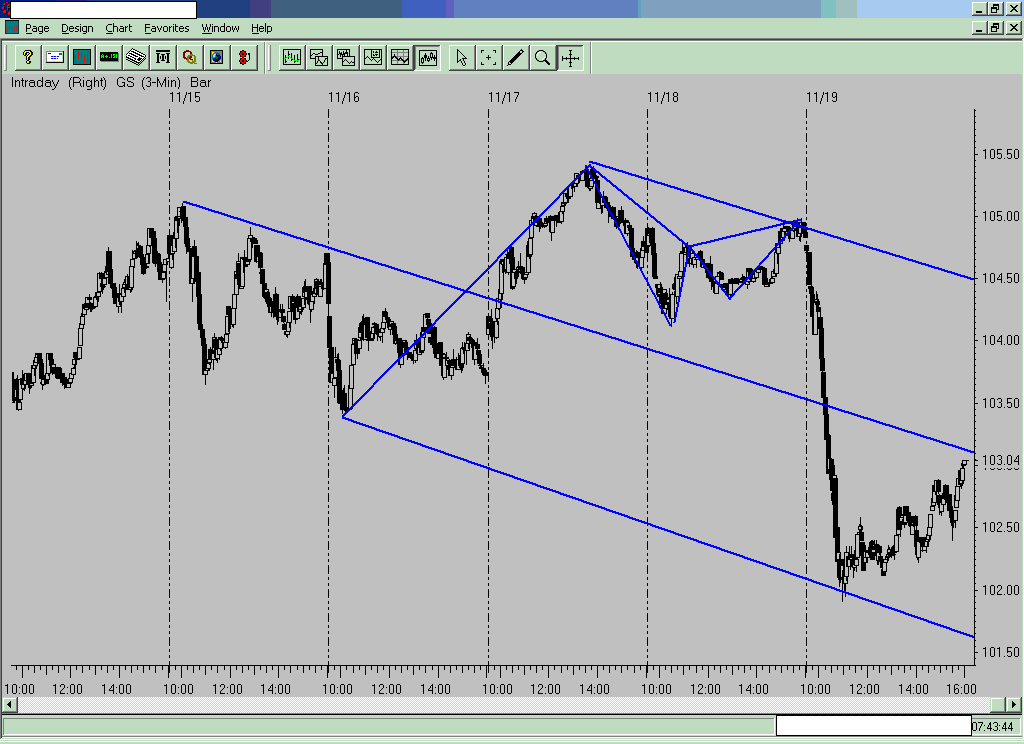
Click image for original size
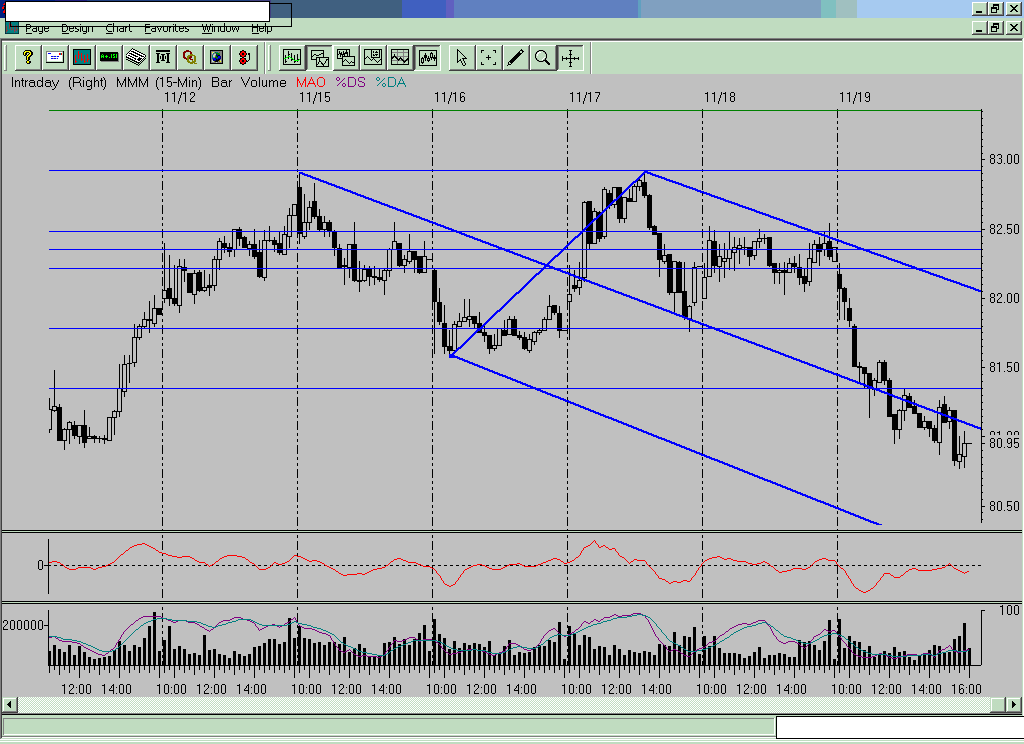
Click image for original size
Charts look good Geo. What are the 2 oscillators under the last chart?
the upper is a 3/10 mao and the bottom is stochastics..i am very much a stock and etf trader.the charts showed what i call a ''STACK''.a stack occurs when i scan my active traders and see concurrent directional signals across the board.there was little doubt on the close of 11/18 what the market was going to do the next day.
Does your scan give you the number of stocks in each direction? - when you directional...
e.g.
96 stocks are directional down
15 directional up
12 flat or indeterminate
The 3/10 mao you speak of - I'm guessing the MA is Moving Average but the O?
e.g.
96 stocks are directional down
15 directional up
12 flat or indeterminate
The 3/10 mao you speak of - I'm guessing the MA is Moving Average but the O?
now I remember you as George from Tim M. yahoo days. I still have yahoo print out on 'trader dream' series and Joe's and Echelon's.
Originally posted by nkhoi
now I remember you as George from Tim M. yahoo days. I still have yahoo print out on 'trader dream' series and Joe's and Echelon's.
Yep, nkhoi, that's him.
Originally posted by roofer
the upper is a 3/10 mao and the bottom is stochastics..i am very much a stock and etf trader.the charts showed what i call a ''STACK''.a stack occurs when i scan my active traders and see concurrent directional signals across the board.there was little doubt on the close of 11/18 what the market was going to do the next day.
Thanks for the charts and the multi-time frame Pitchforks ... good stuff. Could you add to what you're seeing with them and some descriptive analysis of what you're looking at currently and also how you'd be expecting/reacting to market price behavior on both the micro (intraday) and macro layout of of the posts ... thanks dude!
The Monkey
the setup is called trader dream as document here http://www.trading-naked.com/traders_dream_full.htm
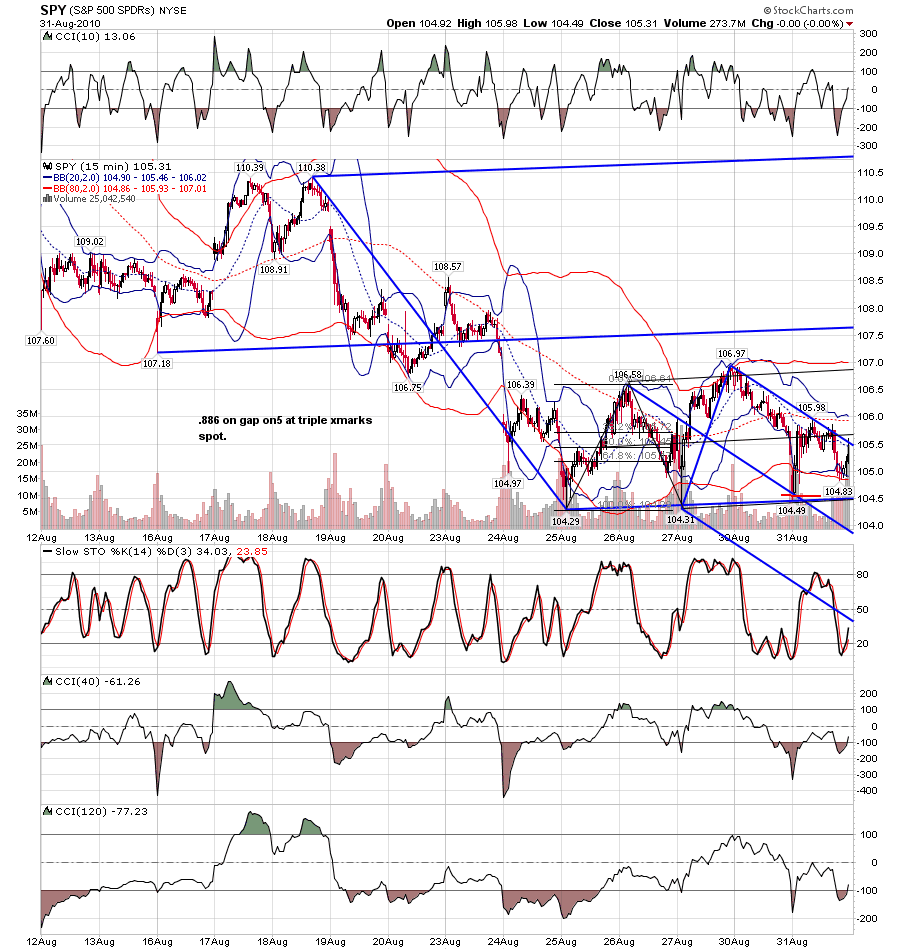
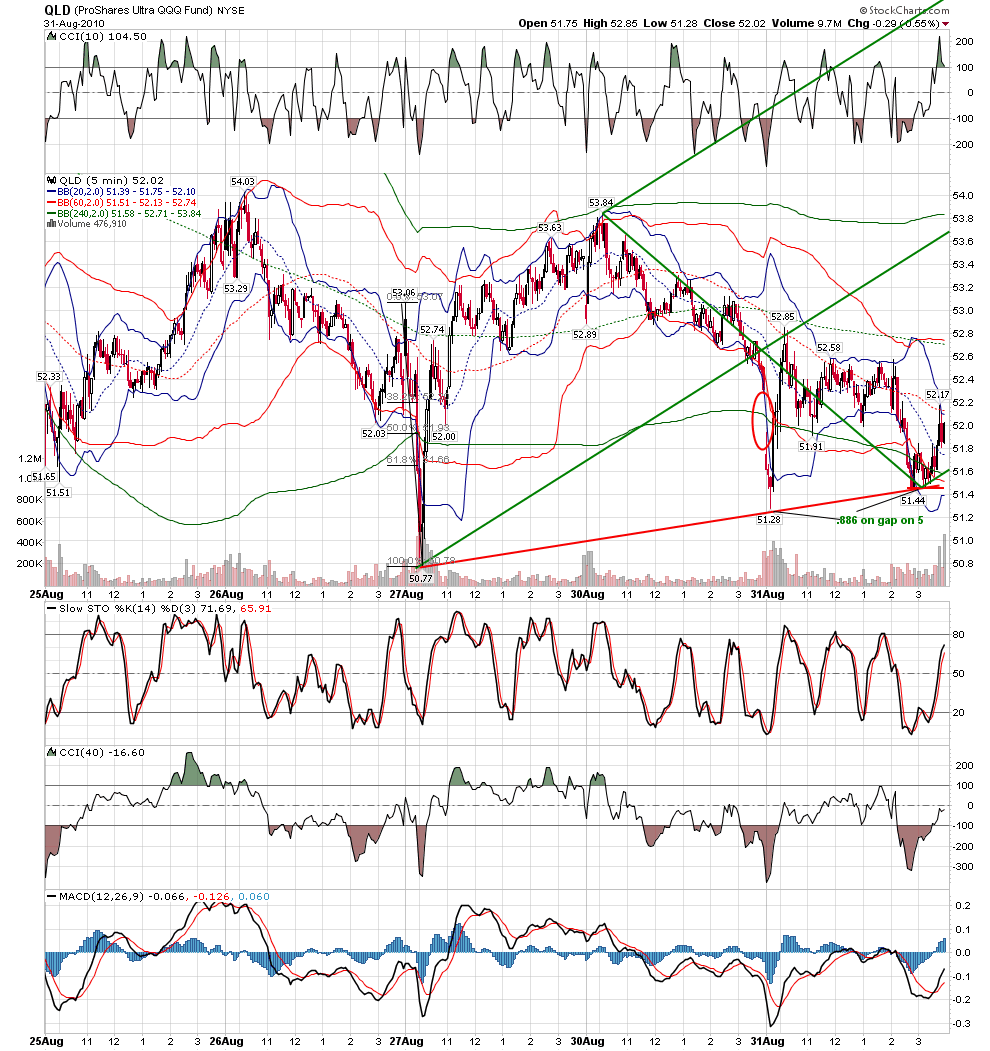
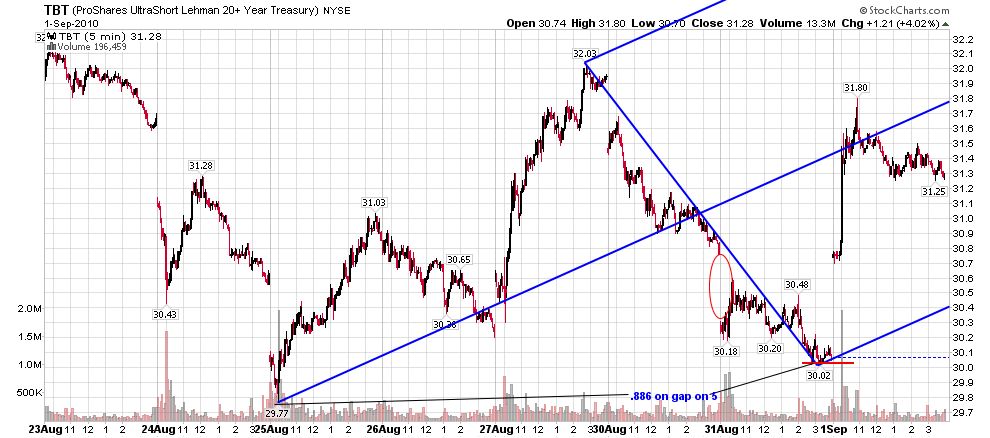
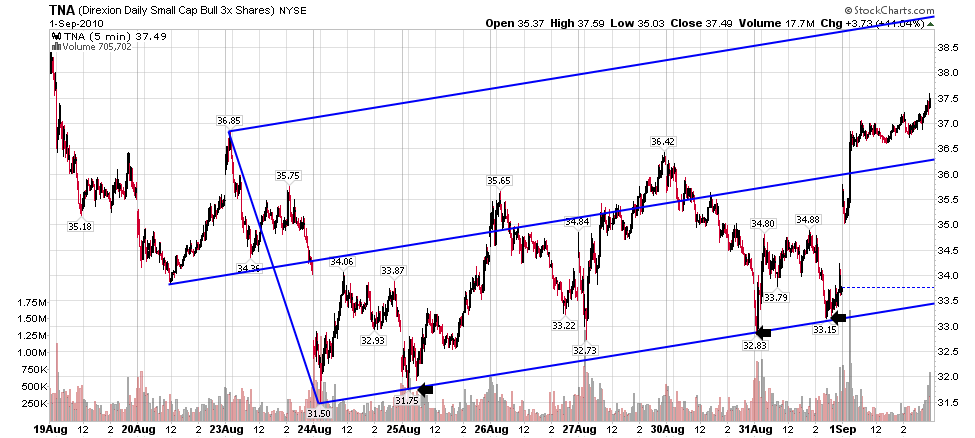
since my old work is being discussed i will chime in... the traders dream was posted nine years ago.in the interim, there has been a quantum leap in the percentage volume generated by computer driven trading..my work now reflects their dominance.... they openly signal their intent for all to see by setting up a stack of .886 on opening gap on 5... this past tuesday was no different...they had openly signaled their intent to ramp stocks up and slam bonds down...
Click image for original size
Click image for original size
Click image for original size
Click image for original size
re indicators.. i have moved to a stack of cci's with a stoch....in scanning hundreds of thousands of charts(i.e. doing what the computers do)i found for myself 4 indicator setups i use to confirm geometry. if you do similar work, you will be amazed at how frequently the indicators have the same pattern as the market overall makes a swing turn..occasionally you will see chart with macd... there i am looking for one thing only, the ''bump''...
Emini Day Trading /
Daily Notes /
Forecast /
Economic Events /
Search /
Terms and Conditions /
Disclaimer /
Books /
Online Books /
Site Map /
Contact /
Privacy Policy /
Links /
About /
Day Trading Forum /
Investment Calculators /
Pivot Point Calculator /
Market Profile Generator /
Fibonacci Calculator /
Mailing List /
Advertise Here /
Articles /
Financial Terms /
Brokers /
Software /
Holidays /
Stock Split Calendar /
Mortgage Calculator /
Donate
Copyright © 2004-2023, MyPivots. All rights reserved.
Copyright © 2004-2023, MyPivots. All rights reserved.