MyPivots
Sign In
MA
MarcinO
Rep: 67
Posts: 5,506
Hi guys. I am sorry for not posting so long, but as you know I have become really discouraged by lower volatility and prolonged sideways moves in the Pound.
It has not changed since February, but I will try to post here and there, anyway.

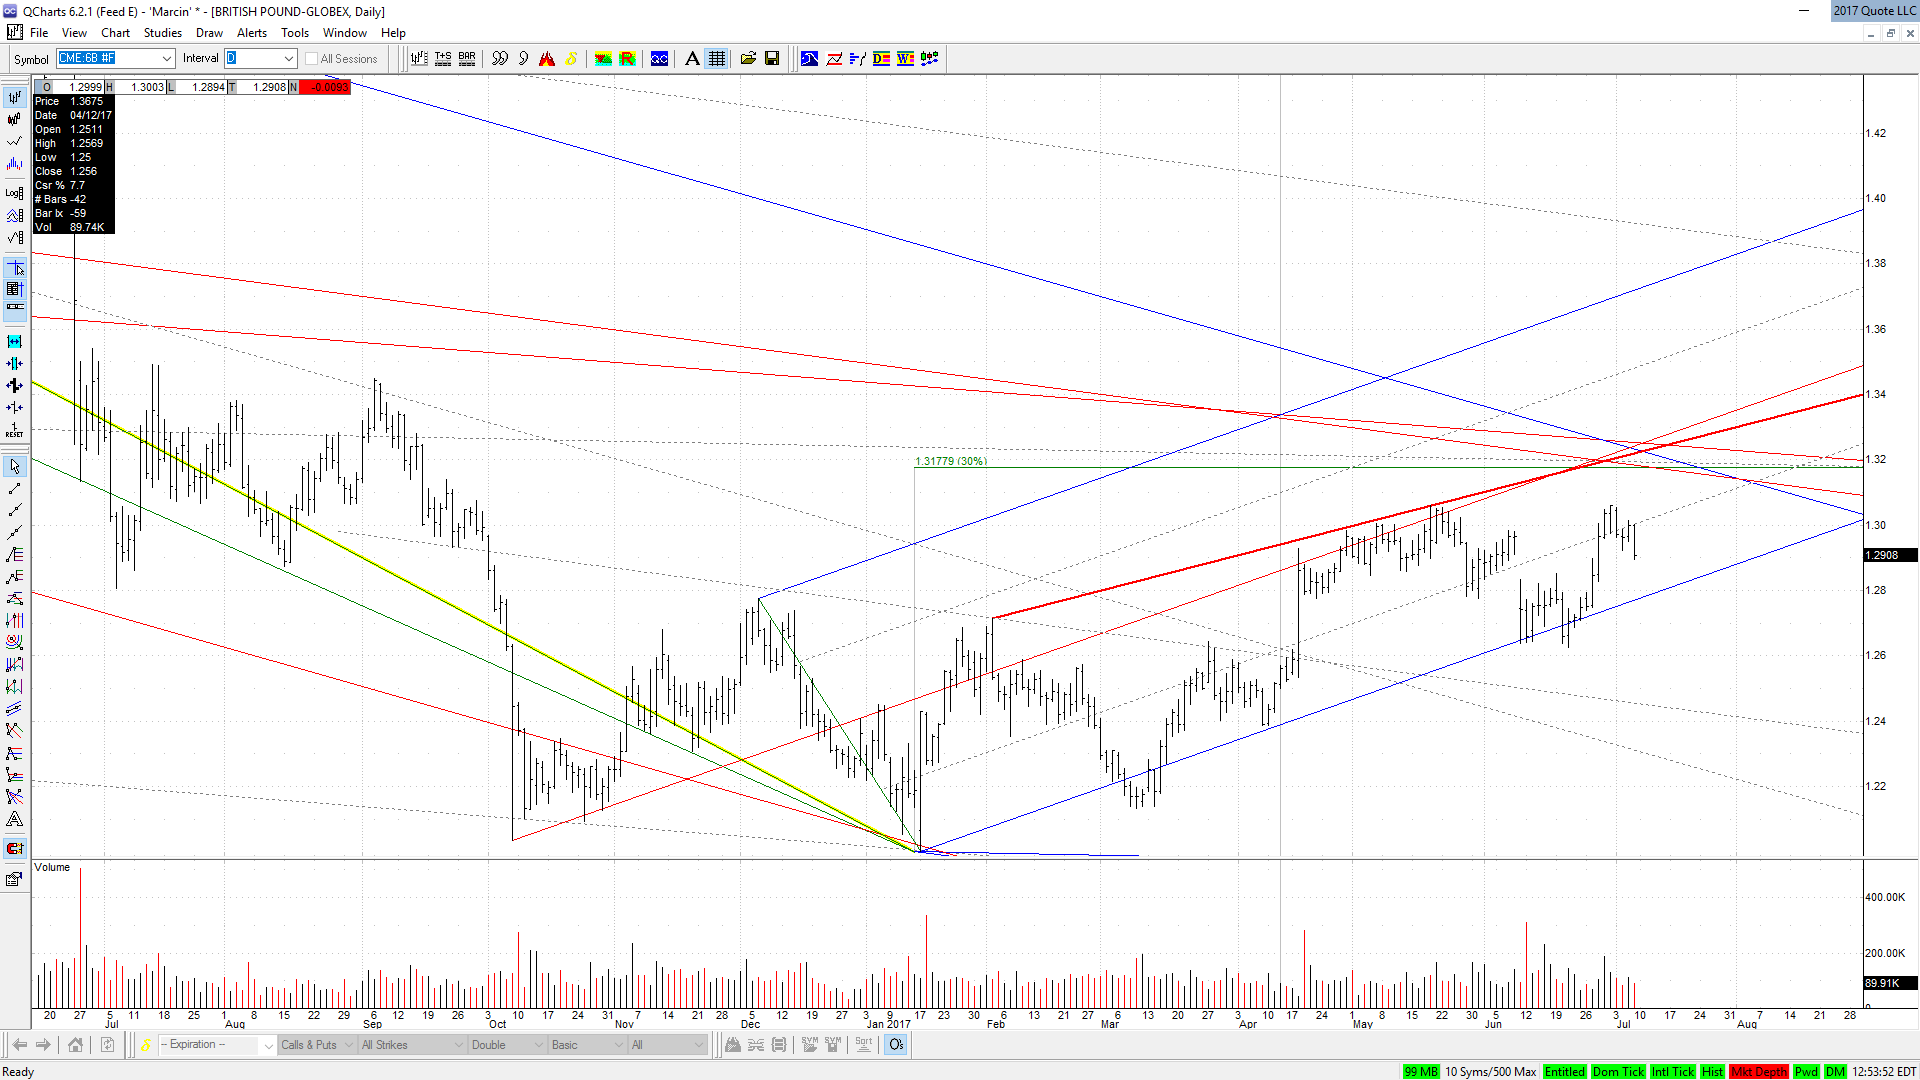
It looks that Cable is going to hit 1.3200-50, but given the timing factor it will most likely need two pushes to get there.

Click image for original size
6b 2017 07 10 png


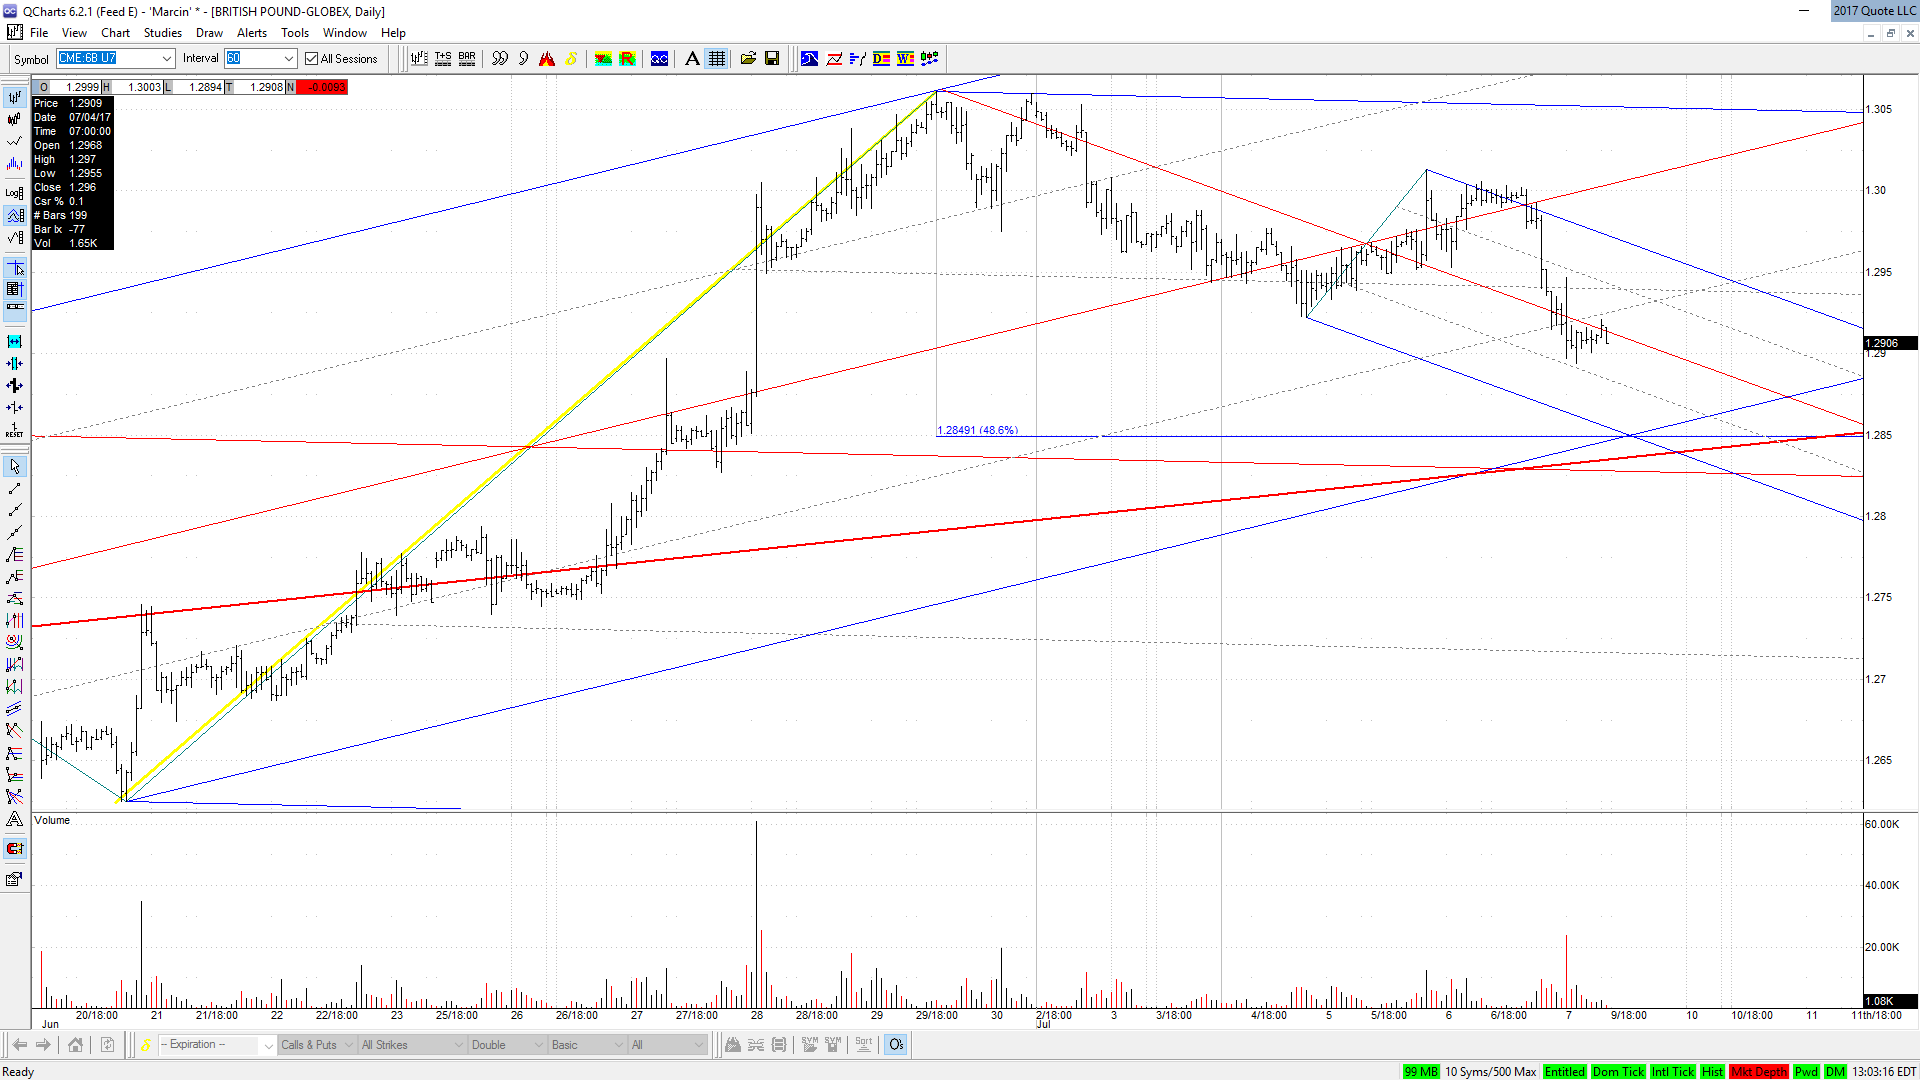
The question, which will probably be answered on Monday morning, is whether 1.29 was a deep enough correction or it needs one more drop to 1.2840-50?

Click image for original size
6b 2017 07 10 2 png
AL
albert
Rep: 99
Posts: 3,094
Hey, Marcin! It is good to see you back. I enjoy seeing your posts and hearing what you have to say about the markets. Good Trading to you.

Al Kamego
MA
MarcinO
Rep: 67
Posts: 5,506
Thanks Al! Goodluck with your trading.
AL
albert
Rep: 99
Posts: 3,094
Thank you Marcin.

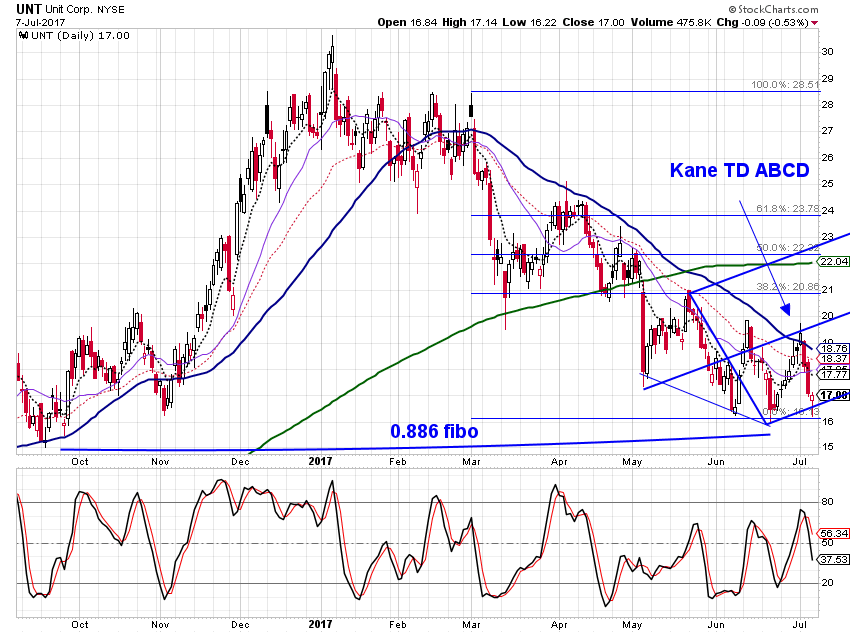
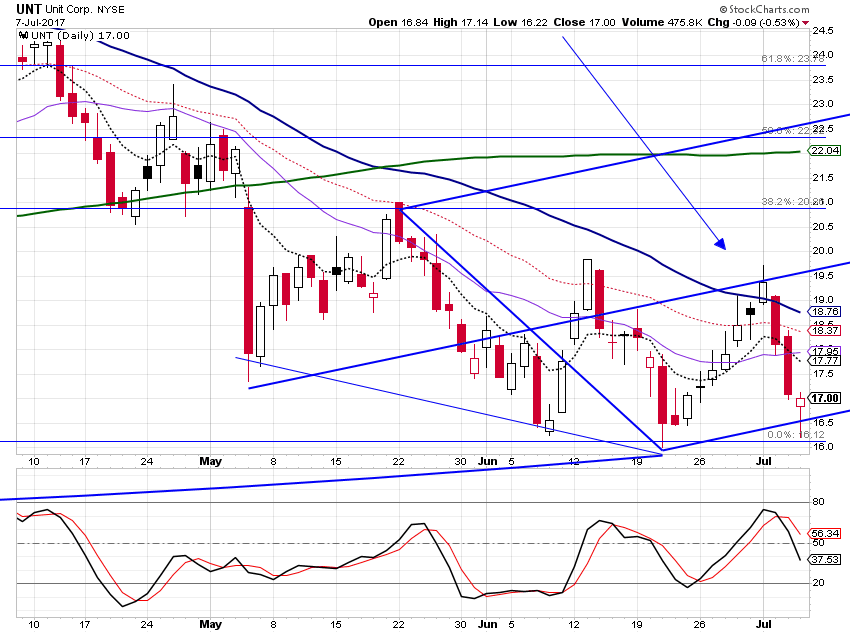
I wonder where UNT price is going at this juncture.


Click image for original size
sc11 png


Click image for original size
sc12 png


Al
MA
MarcinO
Rep: 67
Posts: 5,506
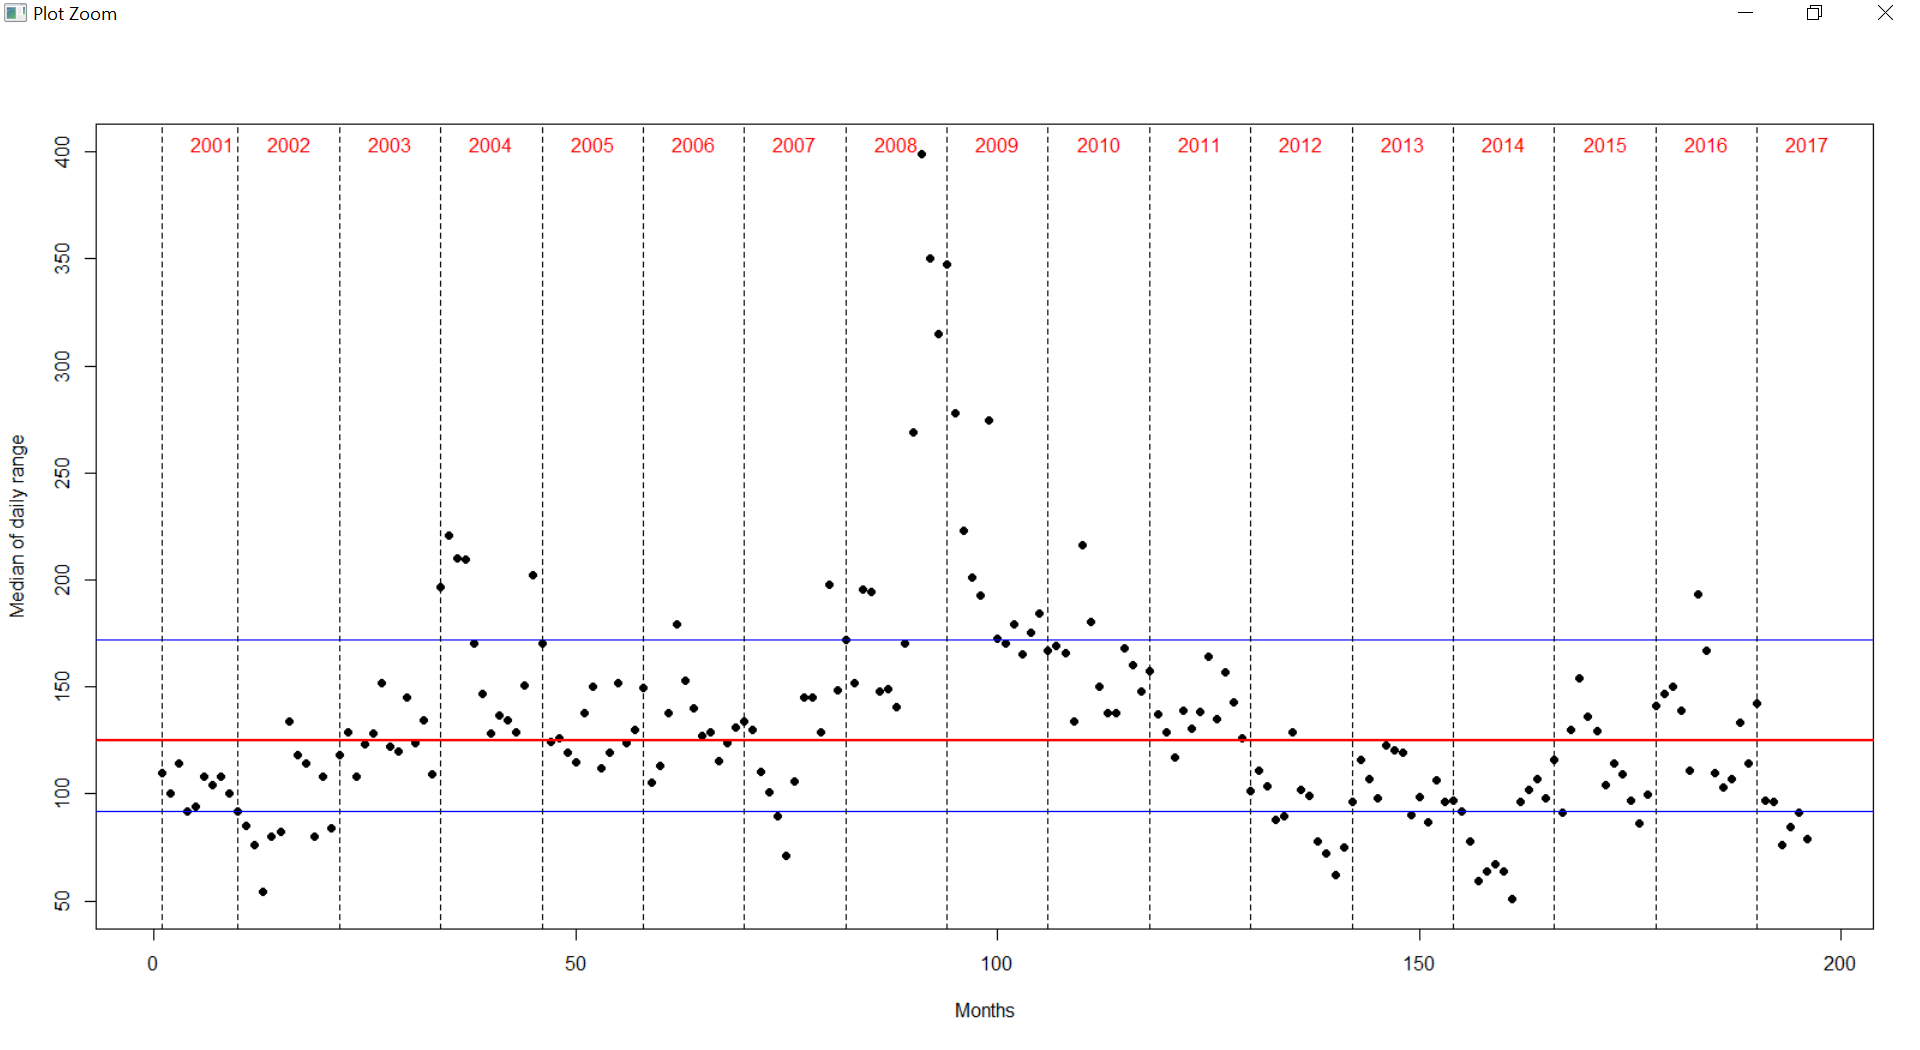
Here is a chart showing where Cable is now in terms of daily range. Each dot is a monthly median of daily (24 hours, not only RTH) range. For those not familiar with statistics - median is a cut-off value dividing a set of observations in two halves, in hour case it says that in case of 50% of days in a given month a range does not exceed median value.
Red line is a median over the whole history available in the chart. Blue lines are the 1st and the 3rd quartile, meaning they cut-off lower 25% and 75% of observations respectively.
As you can see, starting from February '17 we are in a lower 25% of range, and this is the 4th time in 16 years that volatility stays so low that long.
I am placing this chart just to give you an impression of my growing frustration with the Cable. Probably a very good trader ca still make money in such a market, although not as big as under normal volatility, but I can only stay break even, for months now....


Click image for original size
cable png
MA
MarcinO
Rep: 67
Posts: 5,506
Coming back to Cable. It is ready to hit 1.2840, and will do that most likely in the late American session, just to start a move overnight or tomorrow morning. Subject to price action confirmation, of course.
RA
rat89
Rep: 0
Posts: 7,015
hey marcin, good to see you


Click image for original size
screen shot 2017 07 11 at 11 09 30 am png

Click image for original size
screen shot 2017 07 11 at 11 09 48 am png

Click image for original size
screen shot 2017 07 11 at 11 10 23 am png

Click image for original size
screen shot 2017 07 11 at 10 15 37 am png
MA
MarcinO
Rep: 67
Posts: 5,506
Hi rat. I see you are still a chart factory.
AL
albert
Rep: 99
Posts: 3,094
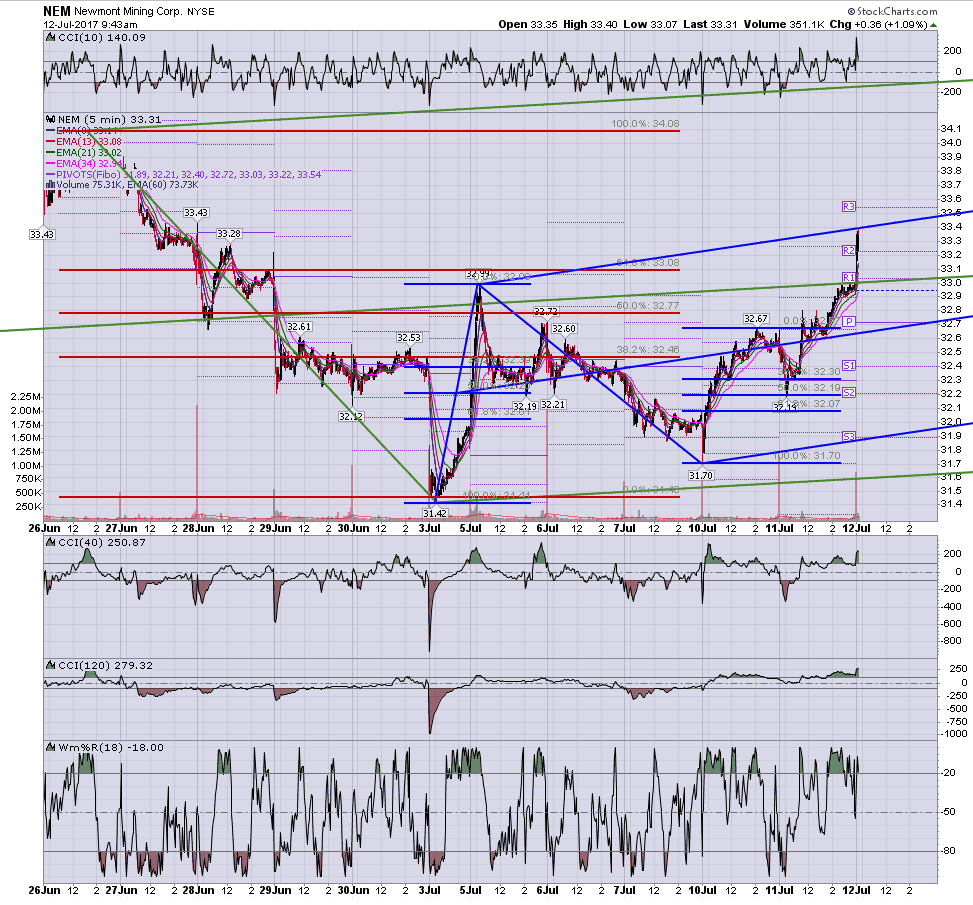
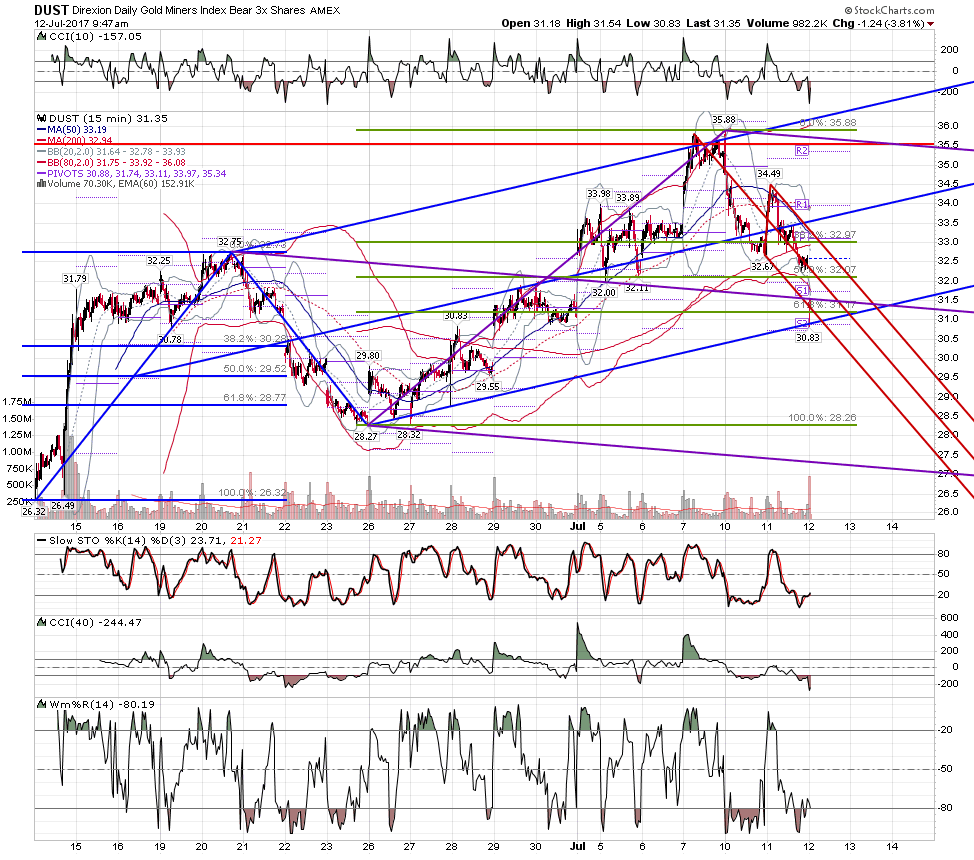
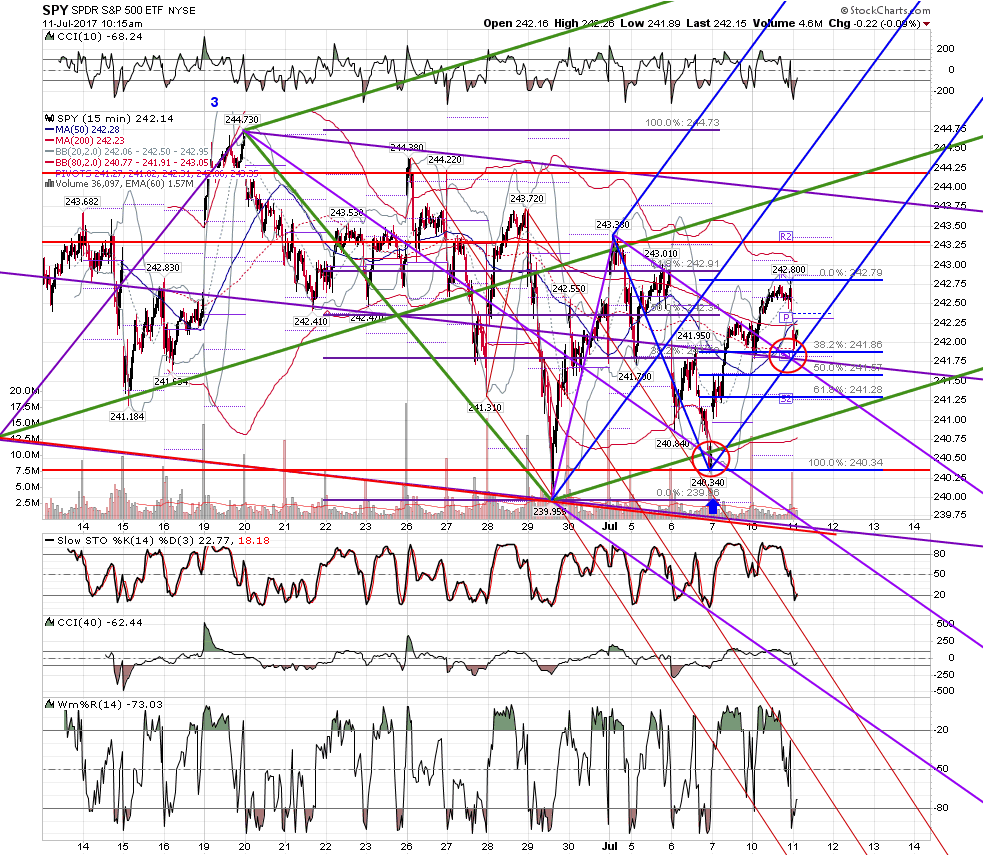
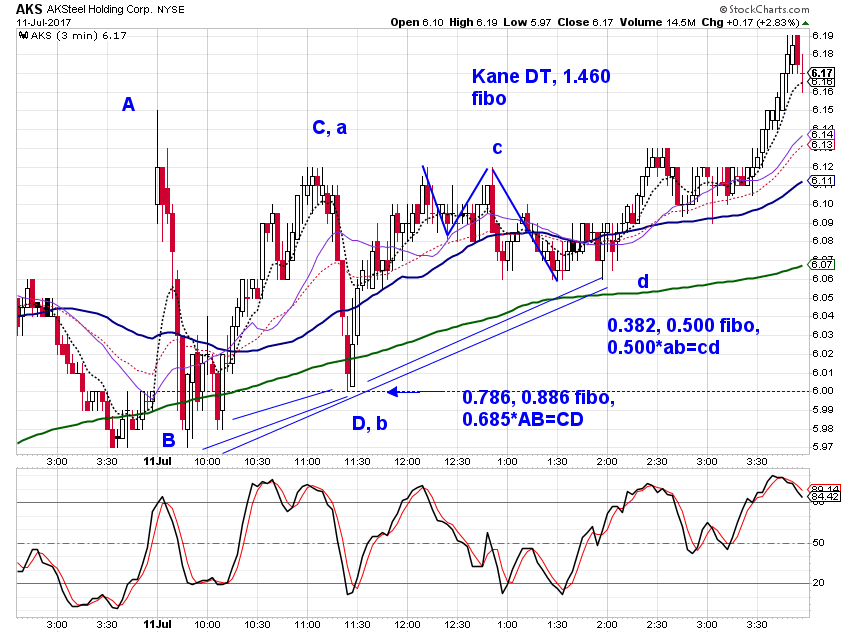
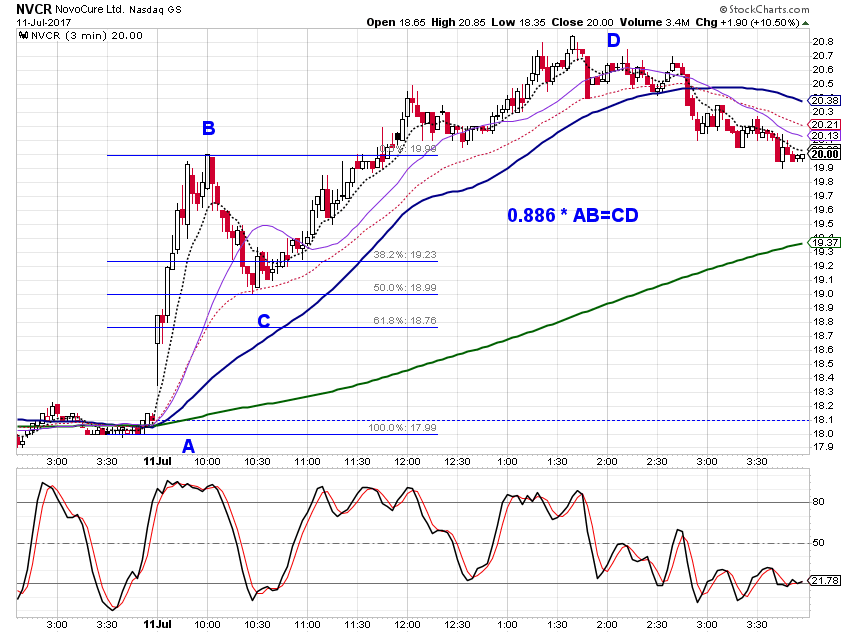
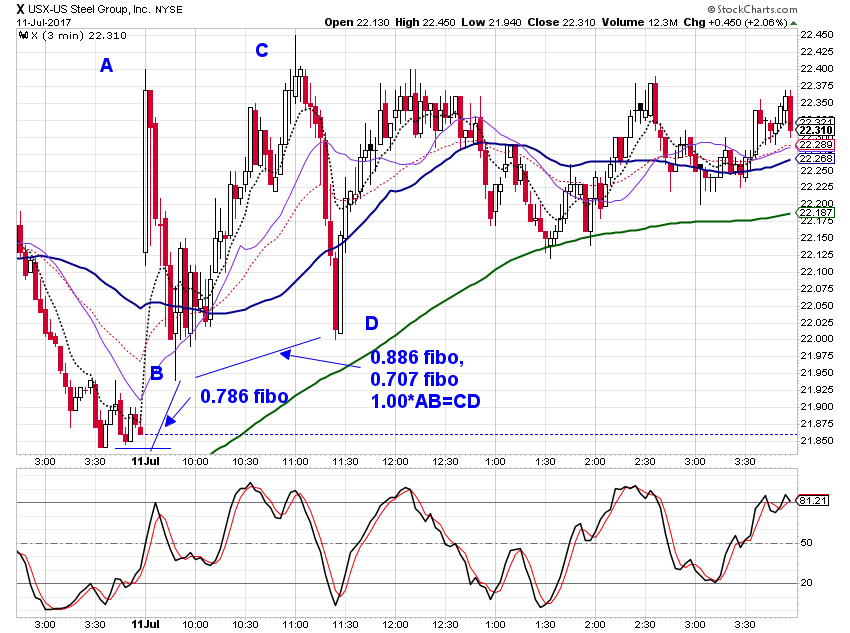
Made a bit on AKS and X. Unfortunately, I bobbled the management on NVCR, did not keep my wits about me, and lost some. I am now more patiently waiting for my setups to develop, however, I need more patience to stay in the trade longer. Thanks Marcin and rat!


Click image for original size
sc13 png


Click image for original size
sc14 png


Click image for original size
sc15 png


Al :--)
MA
MarcinO
Rep: 67
Posts: 5,506
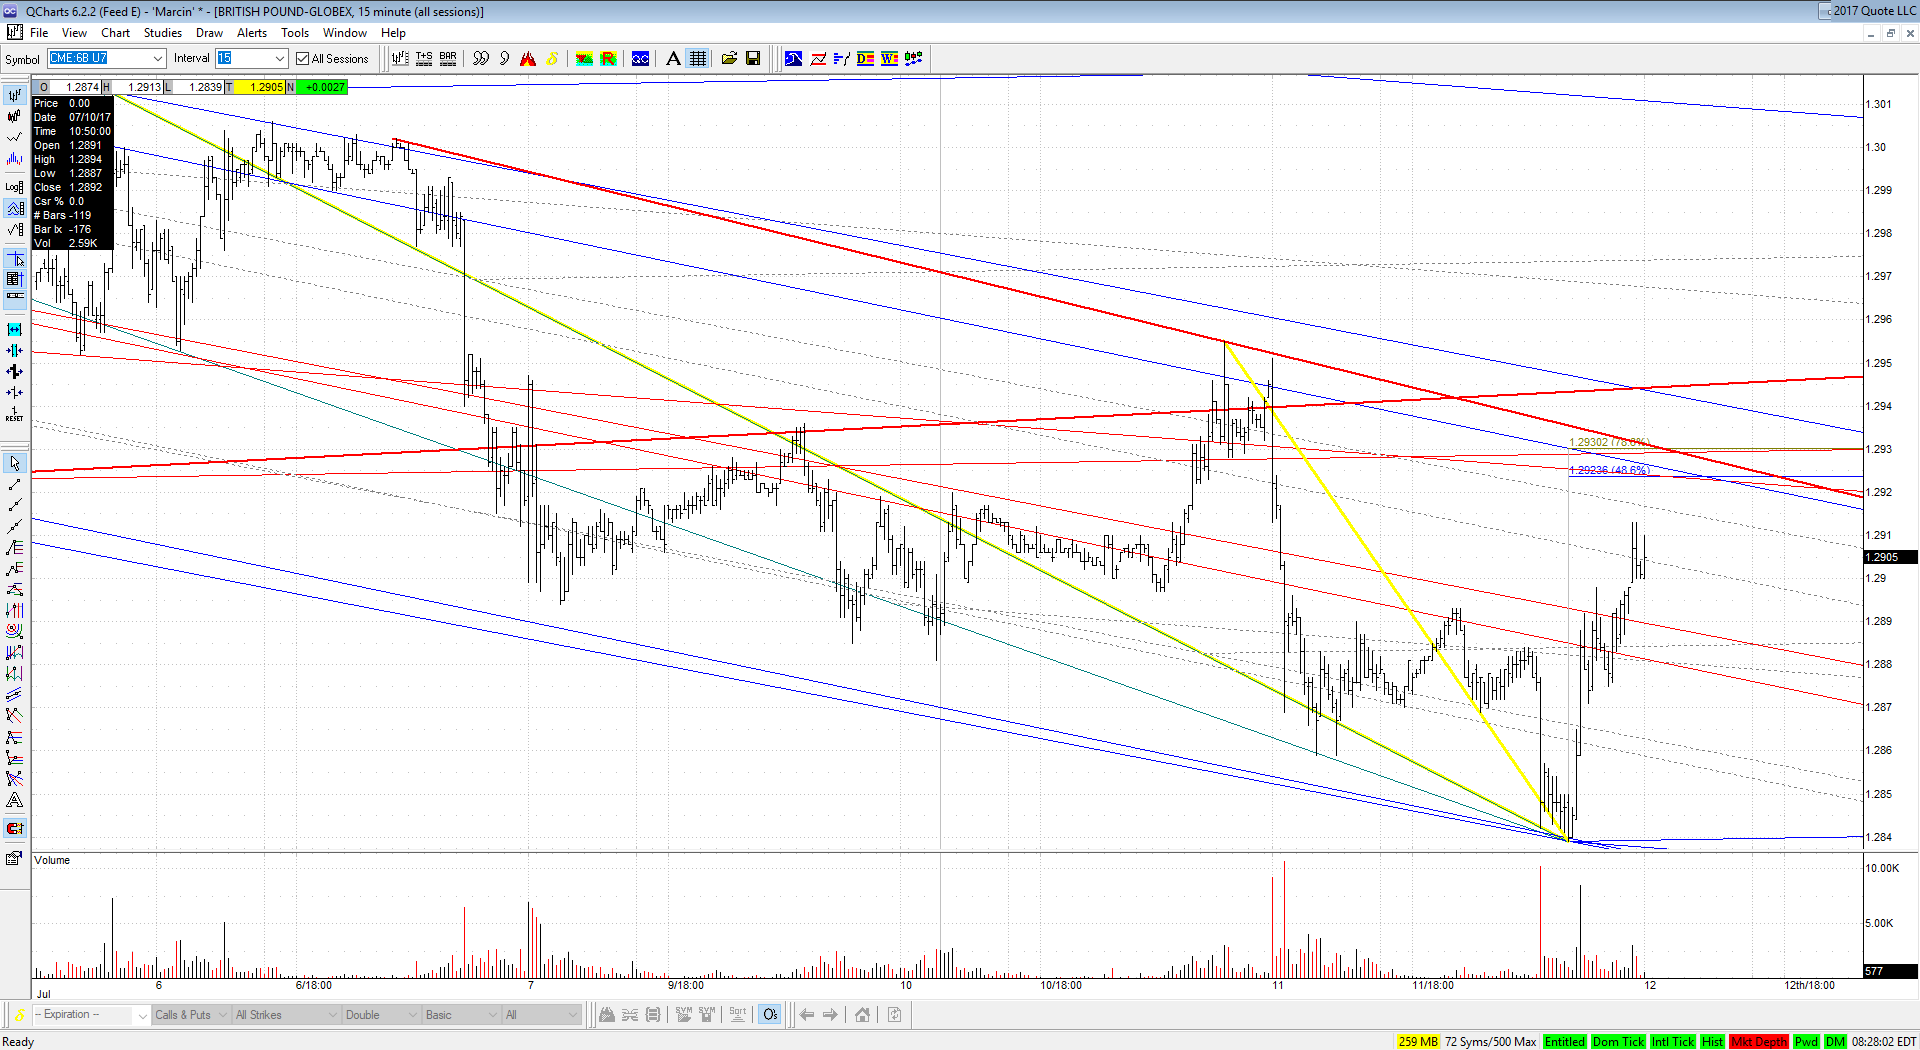
So Cable hit 1.2840 eventually ( I supposed this move would be finished on Monday, but in this slow market they play a lot of games to consume some time).
1.2925 is a serious resistance. 1.2965 is next, with minor area about 45.
Click image for original size
6b 2017 07 12 png
RA
rat89
Rep: 0
Posts: 7,015
Click image for original size
screen shot 2017 07 12 at 9 44 00 am png

Click image for original size
screen shot 2017 07 12 at 9 46 15 am png

Click image for original size
screen shot 2017 07 12 at 9 46 30 am png

Click image for original size
screen shot 2017 07 12 at 9 43 15 am png

Click image for original size
screen shot 2017 07 12 at 9 47 38 am png
AL
albert
Rep: 99
Posts: 3,094
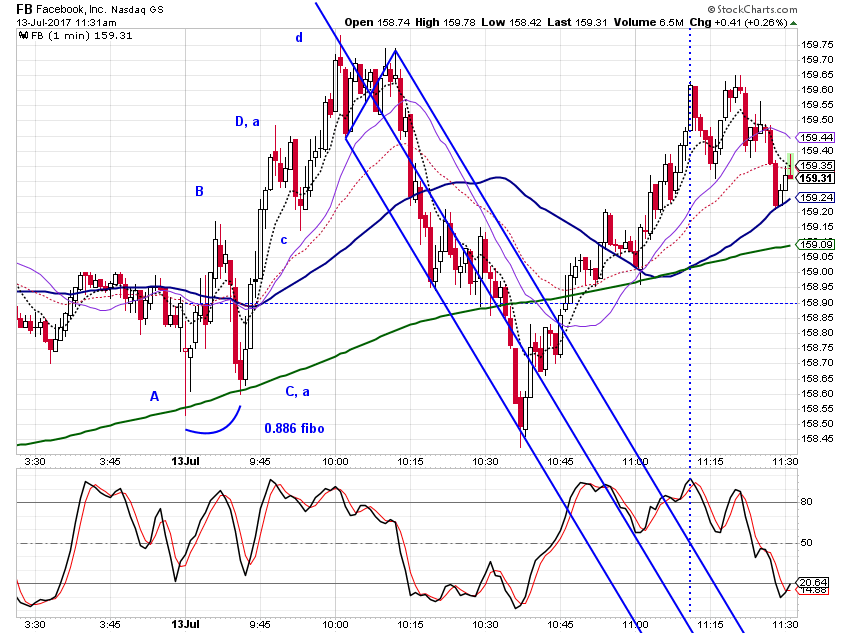
Facebook traded nicely this morning,and the tools found in the the Kane Trading Members area worked well in my little scalping style. Soon after the OPEN, price reversed at the at the 200, 0.886 fibo, on the 3 min TF. Price rose to Point D, in 1.272*AB=CD, dropped to Point c ( same price level as Point B, resistance to support) , and rose to Point d (1.618AB=CD, 0.707*ab=cd.). Price dropped from the high, formed a 0.886 fibo, in a small roofer's Beauuty and Simplicity. Price dropped nicely. I am still working on my patience.

Click image for original size
sc16 png


Al