Starting it off.
Al
MA
MarcinO
Rep: 67
Posts: 5,506
So far this week doesn't look good. Two days out of three with very low volatility and choppy price action.
And during the only one, which provided some semi-decent range, a 'nice move part' took only 3 hours.
And during the only one, which provided some semi-decent range, a 'nice move part' took only 3 hours.
RA
rat89
Rep: 0
Posts: 7,015
good eye Al, but I would be more aggressive with that actually ;)
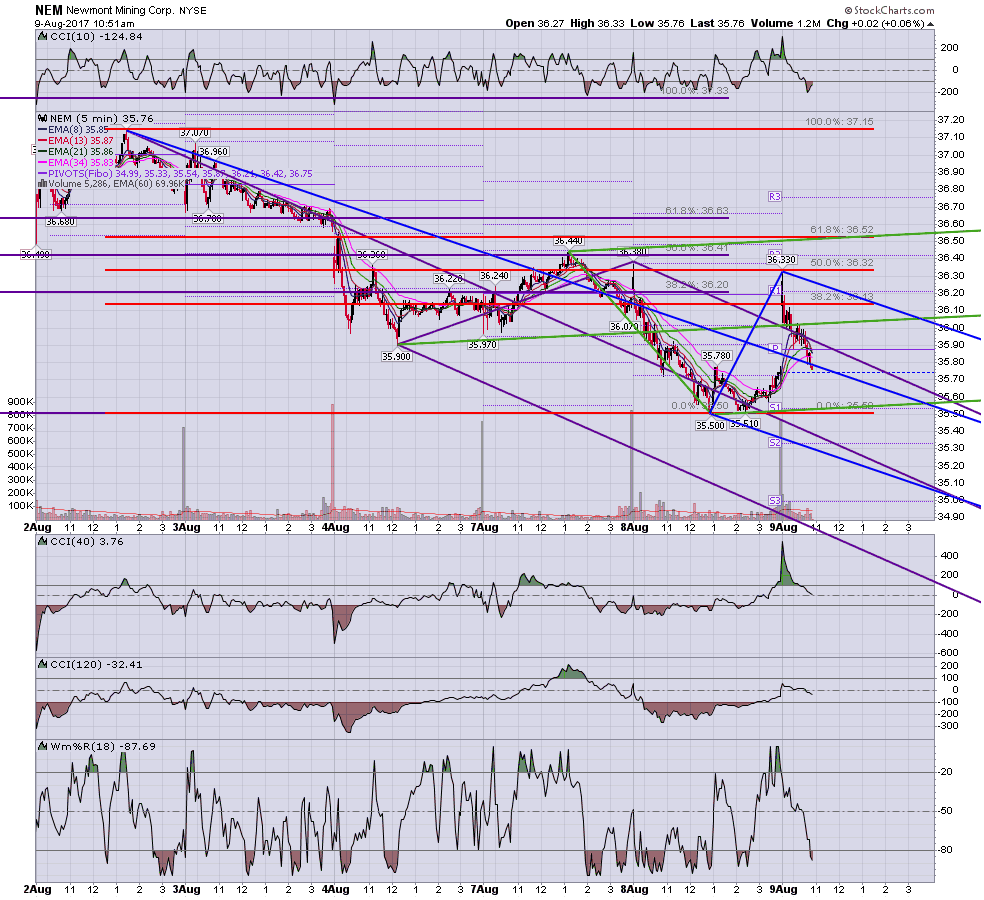
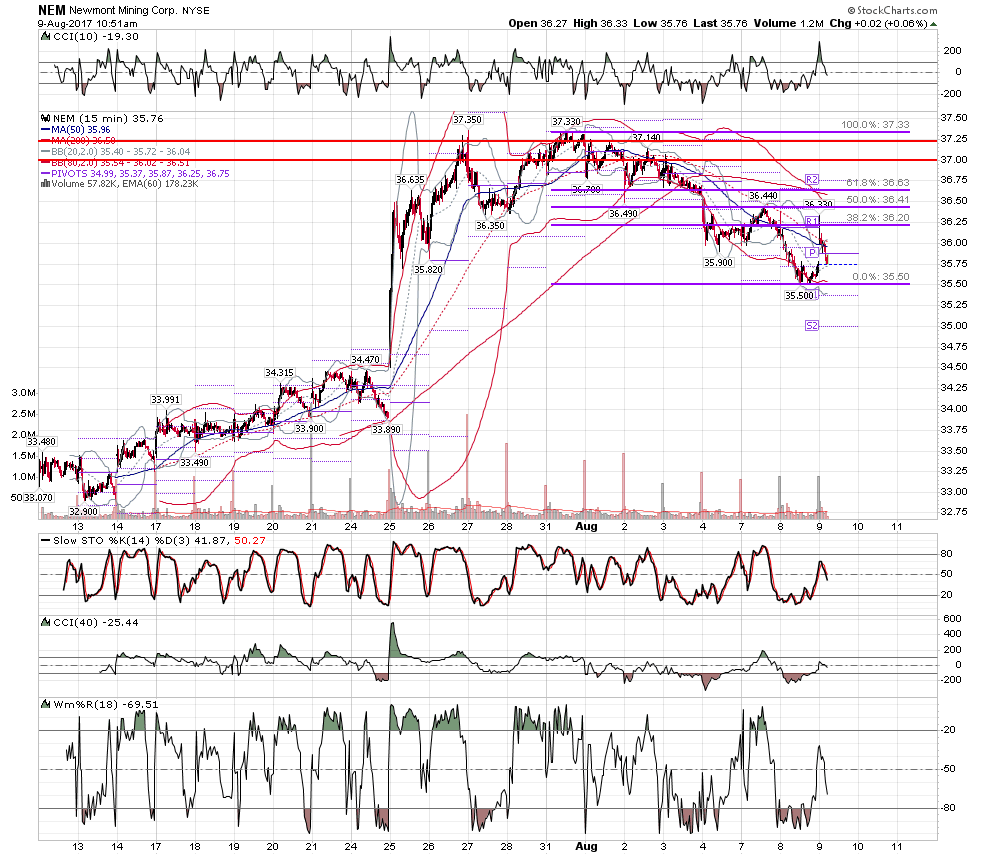
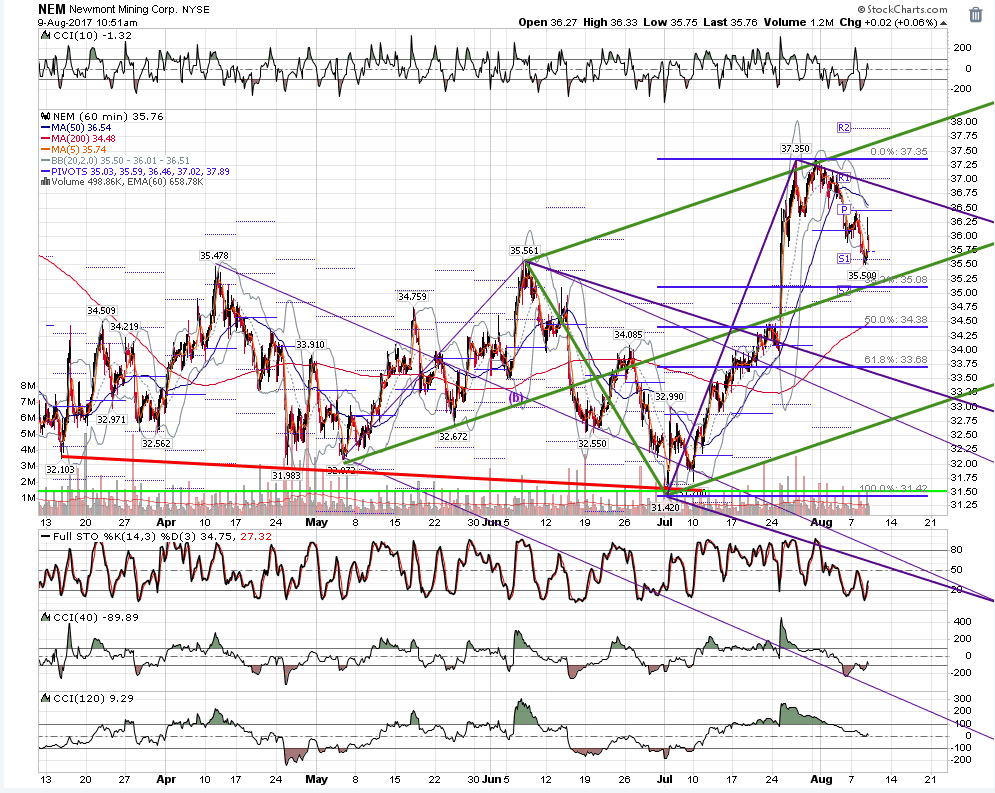
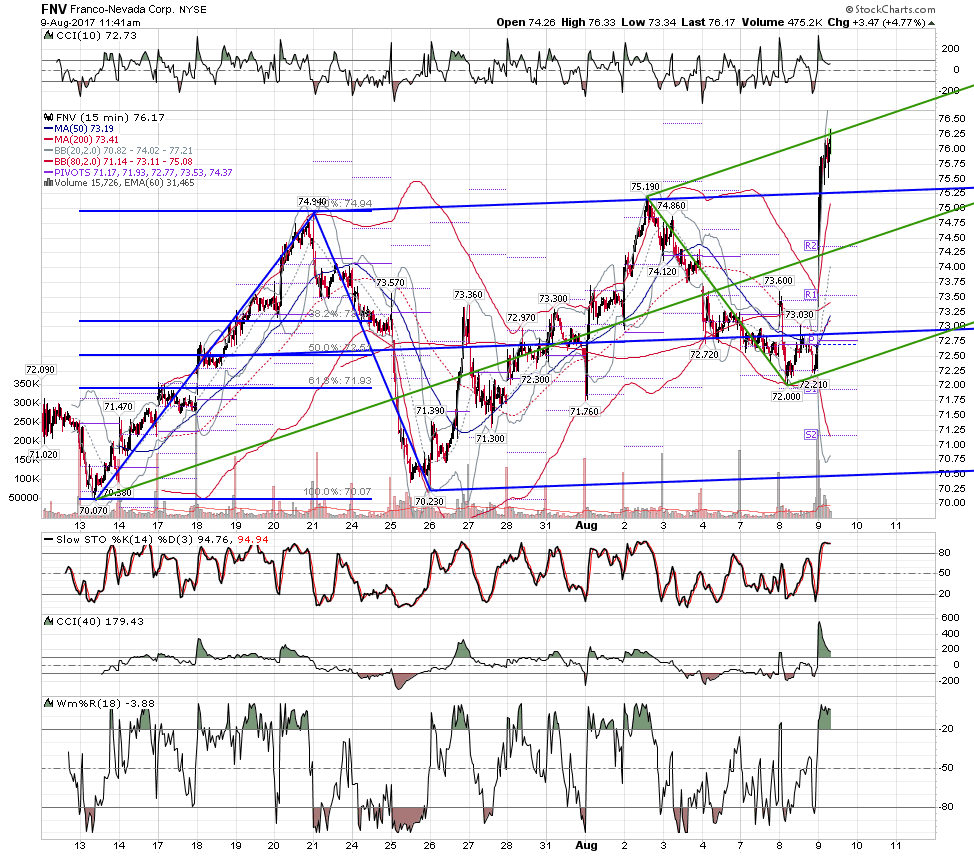
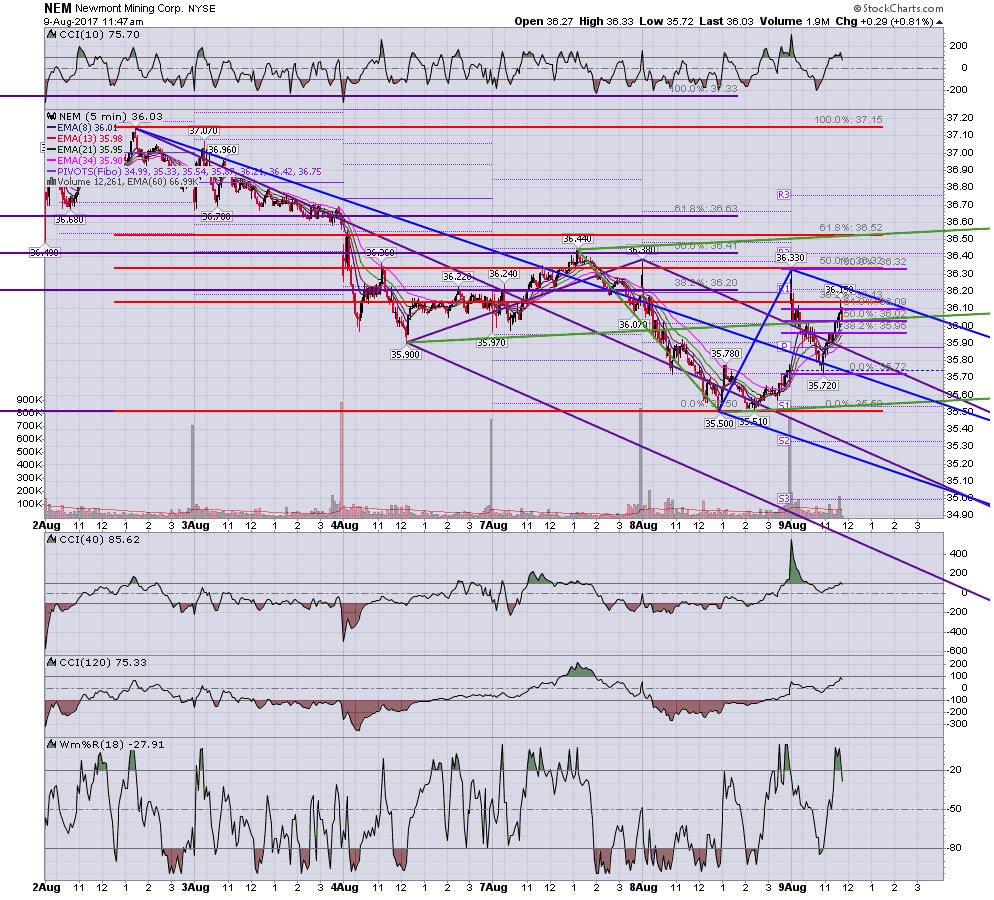
here are the nem family, baby nem, mama nem, and daddy nem
here are the nem family, baby nem, mama nem, and daddy nem
Click image for original size
Click image for original size
Click image for original size
RA
rat89
Rep: 0
Posts: 7,015
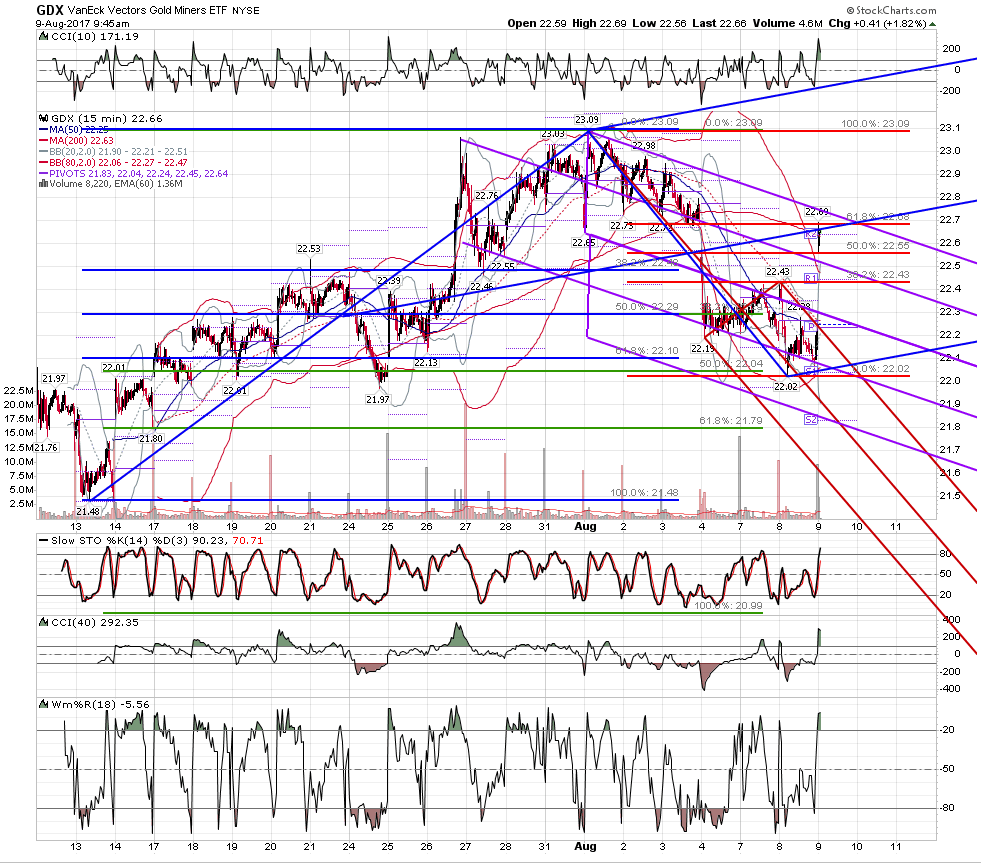
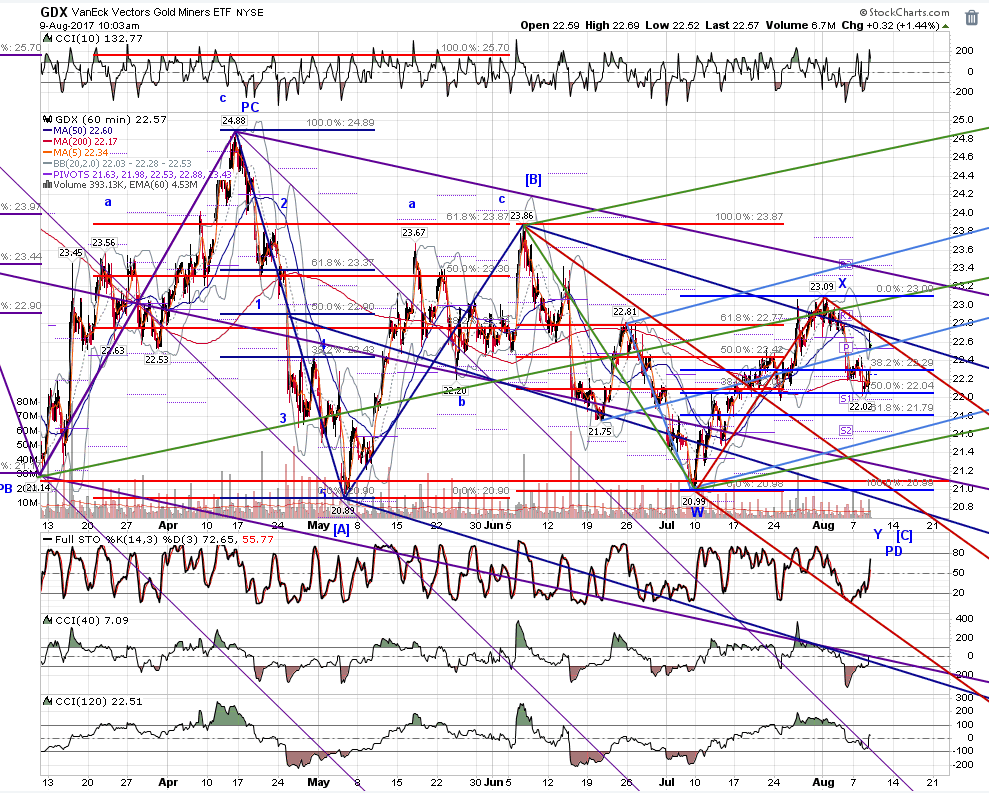
gdx 15 and 60 – fascinating area here, where:
23.09 – 22.02 = .618 at 22.68
23.86 – 20.99 = .618 at 22.76
24.88 – 20.89 = .447 at 22.67
25.71 – 20.89 = .382 at 22.73
23.09 – 22.02 = .618 at 22.68
23.86 – 20.99 = .618 at 22.76
24.88 – 20.89 = .447 at 22.67
25.71 – 20.89 = .382 at 22.73
Click image for original size
Click image for original size
MA
MarcinO
Rep: 67
Posts: 5,506
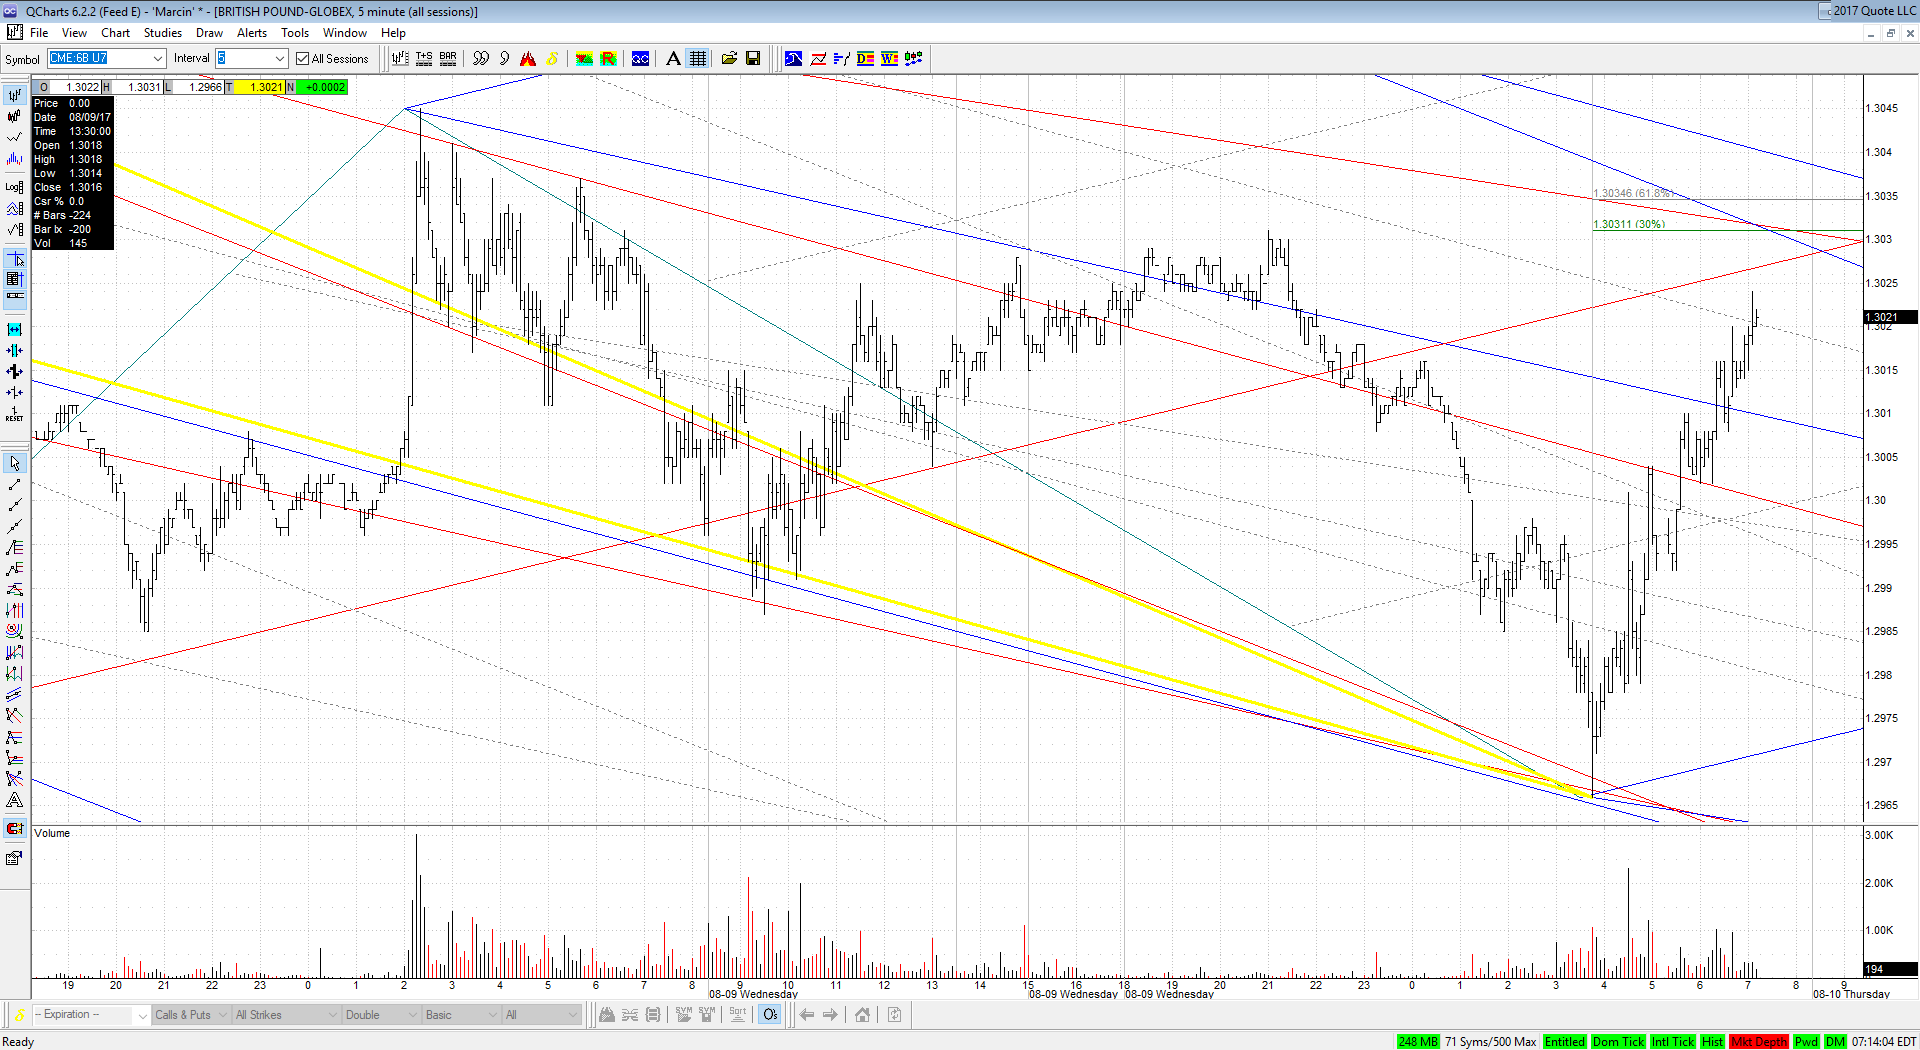
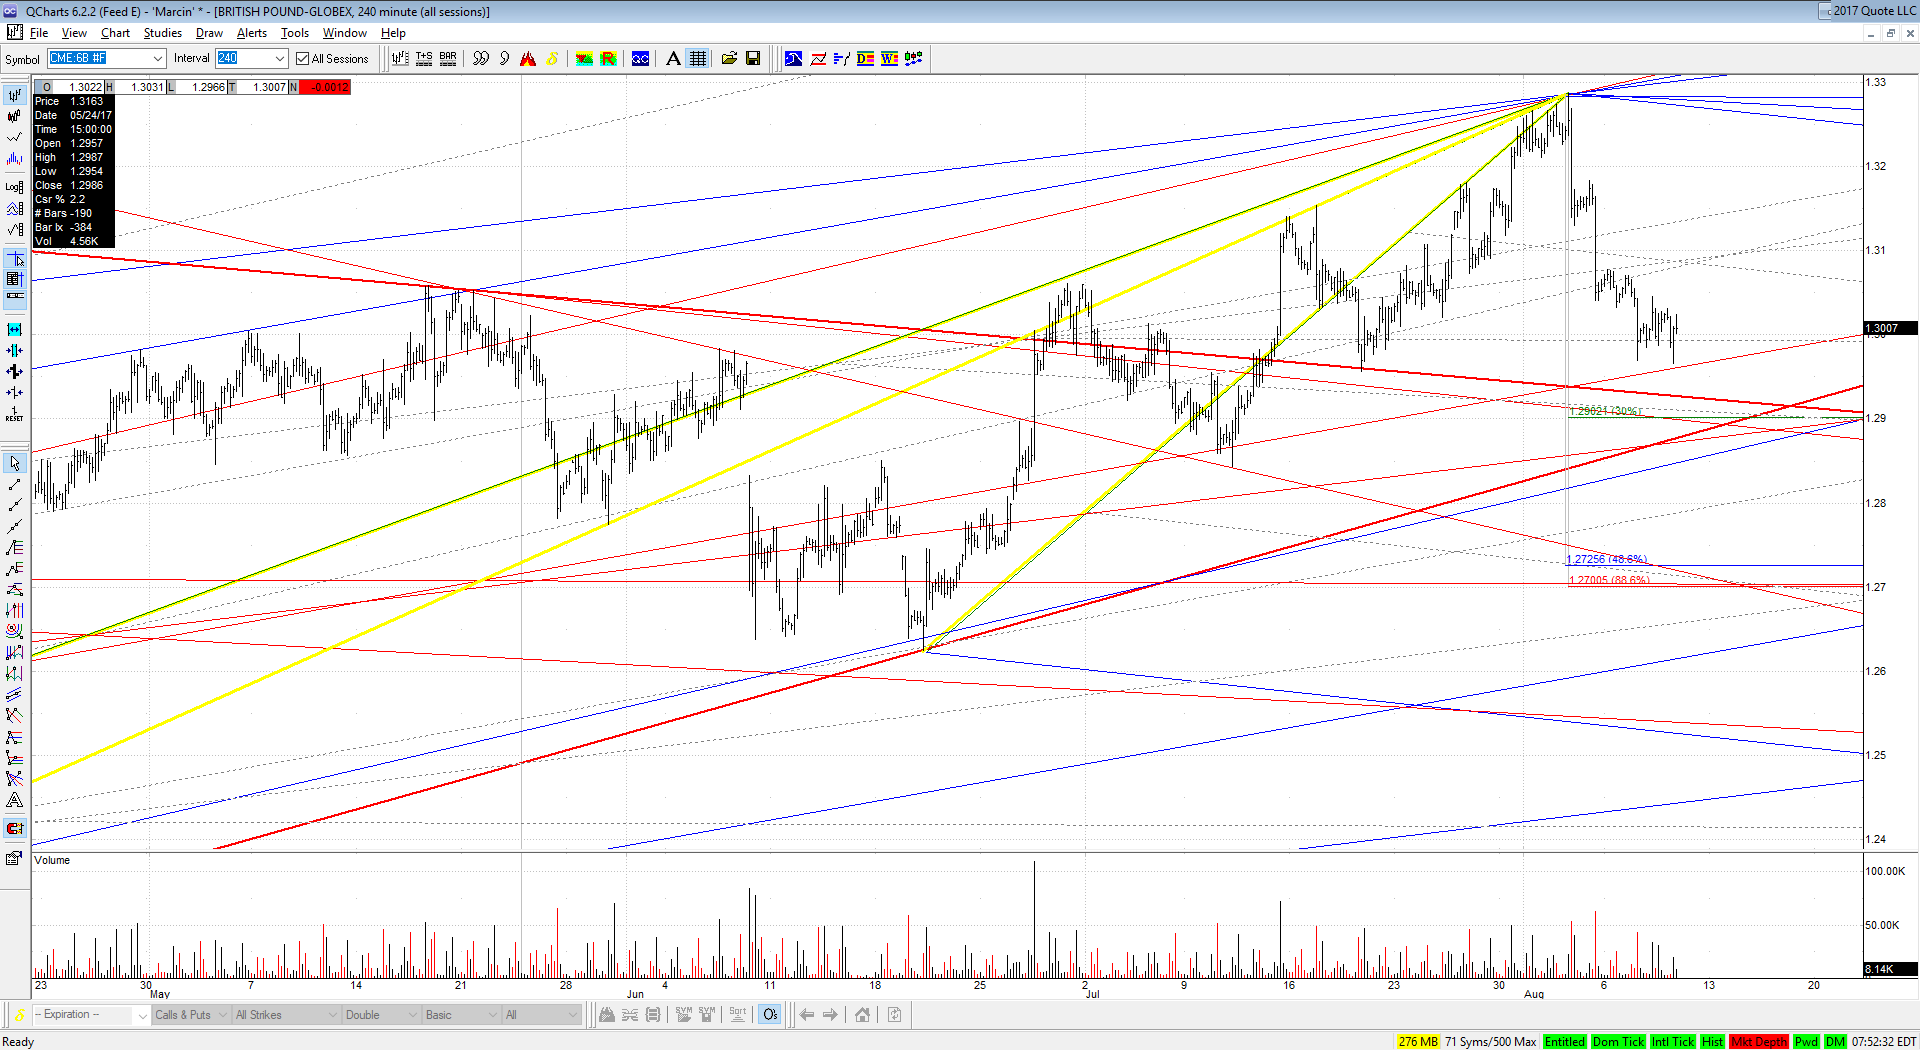
Cable seems to be in a range mode. I guess it will test 1.2960 level for the third time.
It may start to drop any minute now, but hitting previous high before a reversal would be the best scenario here.
It may start to drop any minute now, but hitting previous high before a reversal would be the best scenario here.
Click image for original size
MA
MarcinO
Rep: 67
Posts: 5,506
Just in case 1.2960 doesn't hold, the next support is at 1.2900-20.
Click image for original size
MA
MarcinO
Rep: 67
Posts: 5,506
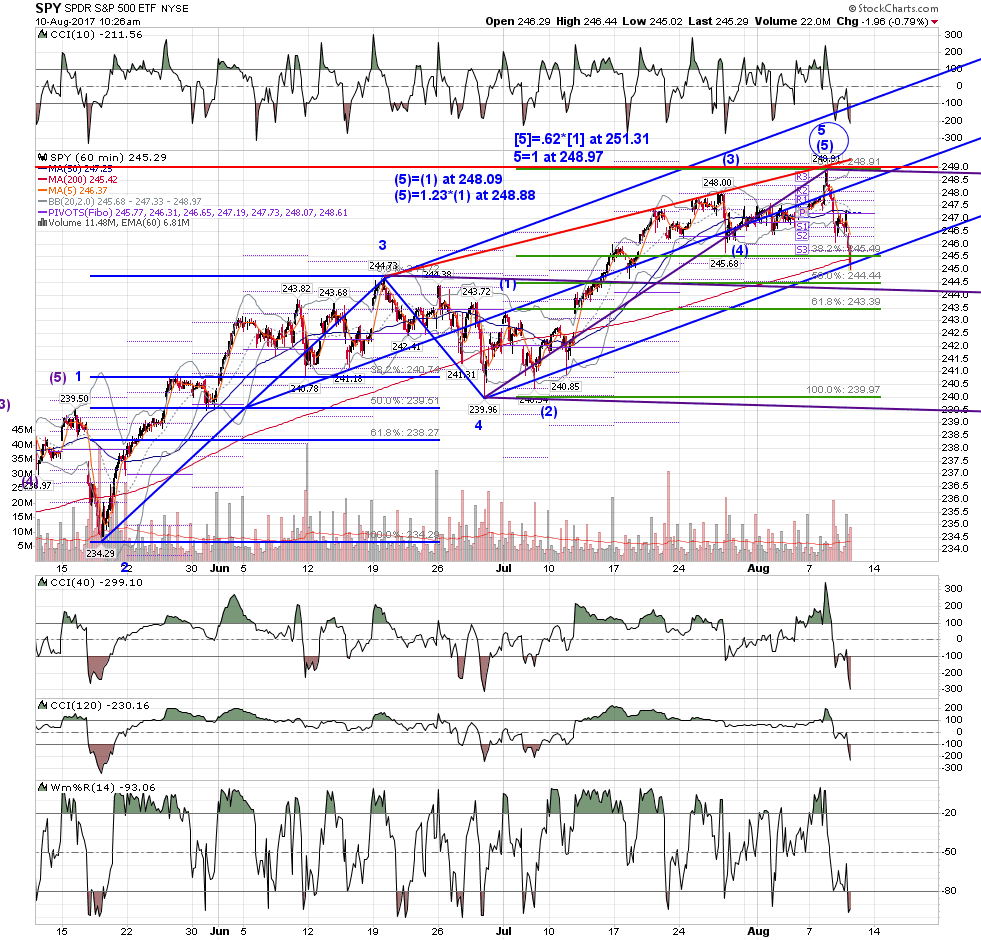
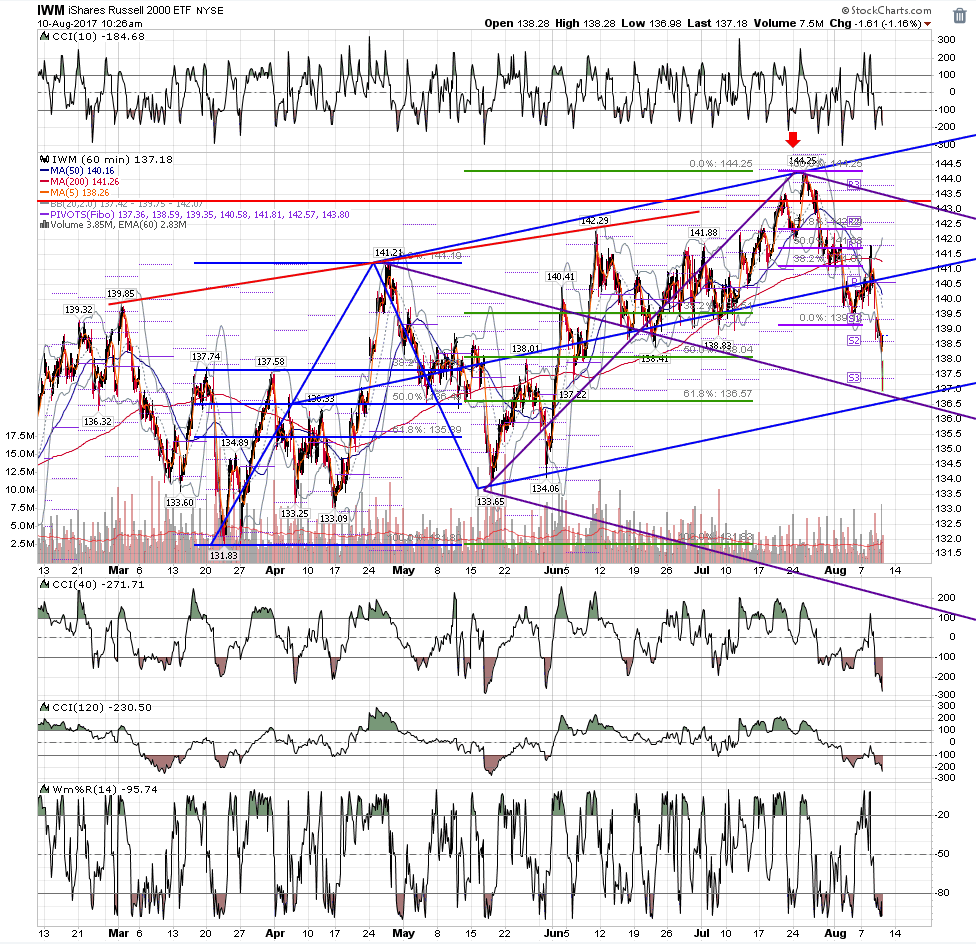
This market is a total crap. Surprising PMI and jobless cliams data from USA generates only 30 pips move!
One of the worst weeks this year in terms of volatility.
One of the worst weeks this year in terms of volatility.
AL
albert
Rep: 99
Posts: 3,094
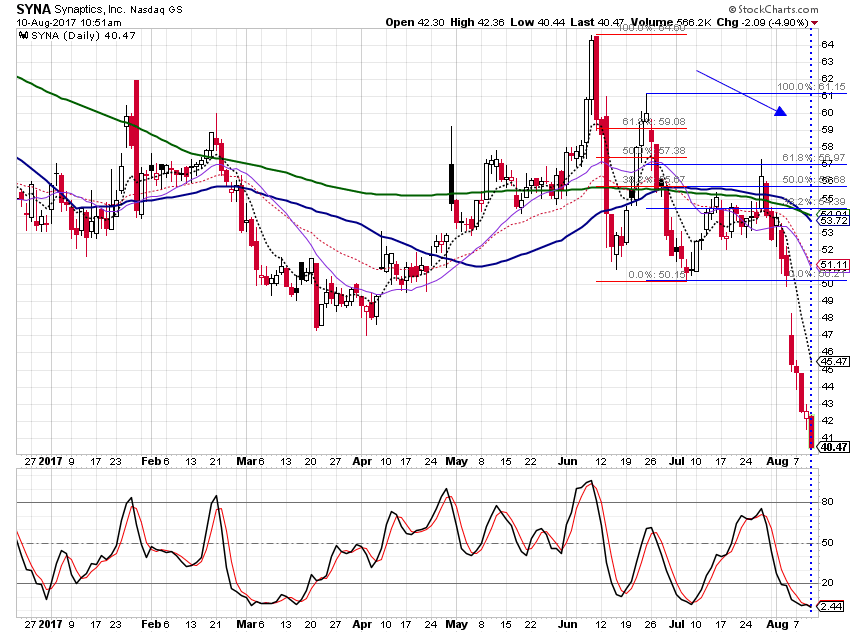
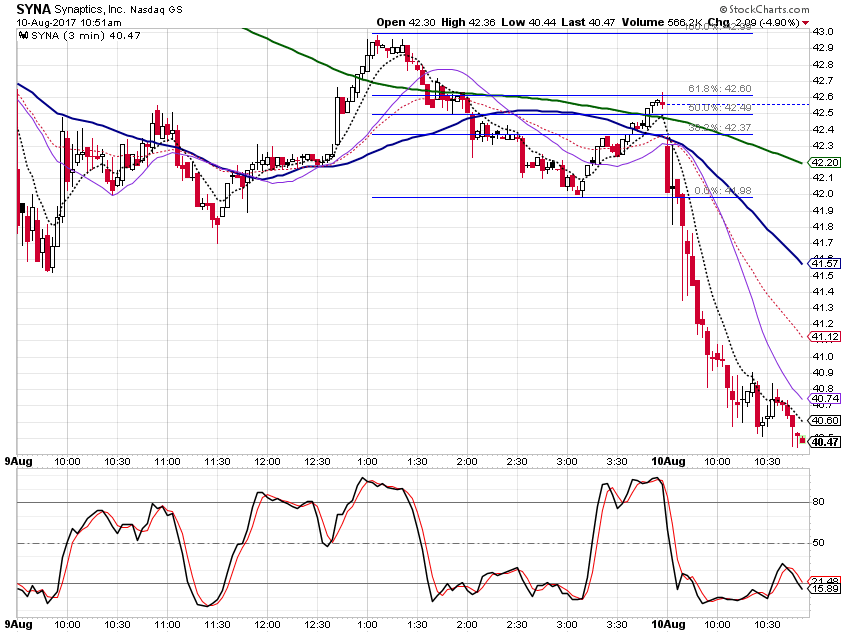
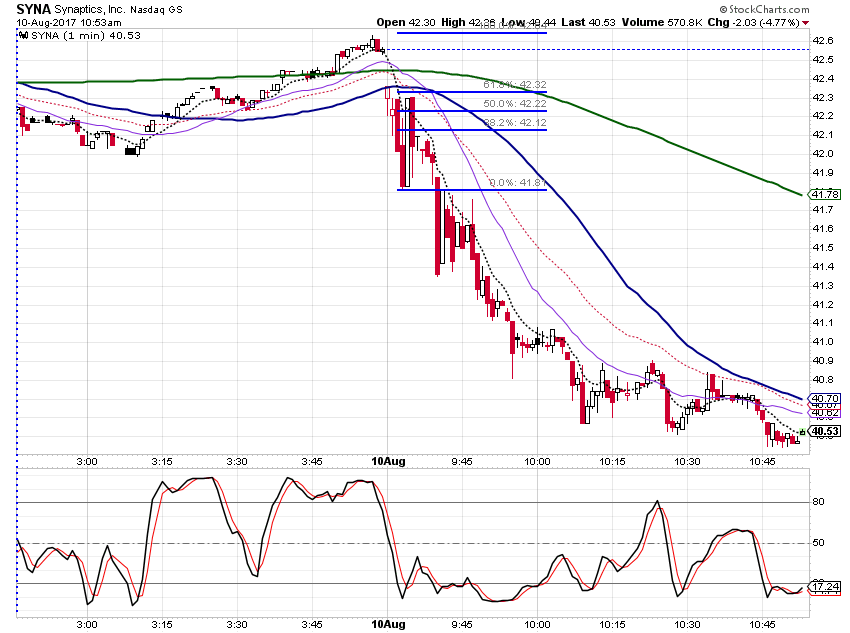
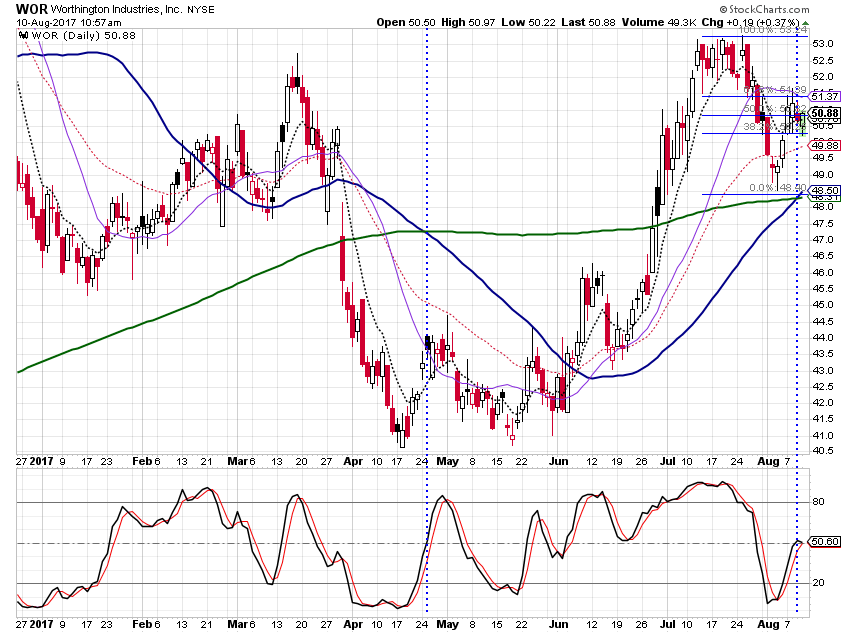
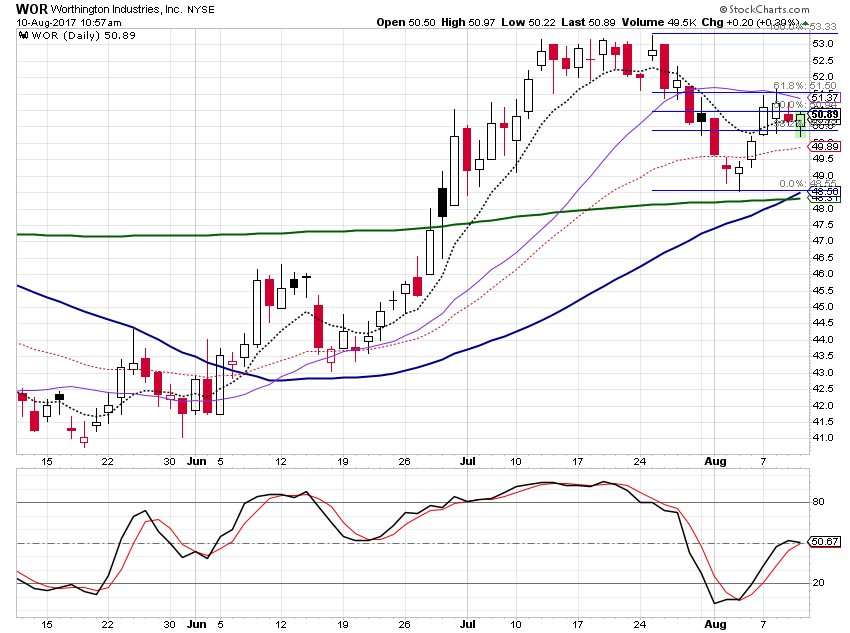
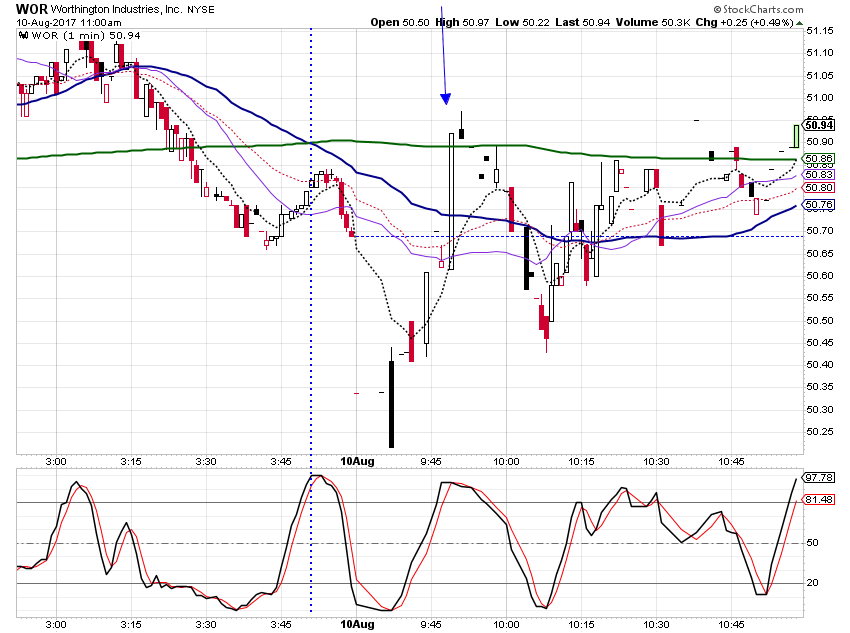
Interesting moves in WOR and SYNA. I found WOR in StockChart's Predefined Scan for BULLISH 50/200-DAY MA CROSSOVERS .and SYNA the BEARISH 50/200-DAY MA CROSSOVERS scan. Both gave SELL entry opportunities. I had a wash selling SYNA. I exited the trade too early. Both WOR and SYNA had 0.618 fibos around yesterday's CLOSE. The overlapping fibos in SYNA Daily remind me of a trade roofer used to show here.
Al
Click image for original size
Click image for original size
Click image for original size
Click image for original size
Click image for original size
Click image for original size
Al