Starting ot off.
Al
MA
MarcinO
Rep: 67
Posts: 5,506
Cable is nasty today. So far only 30 pips range, but it looks ready for another leg up.
AL
albert
Rep: 99
Posts: 3,094
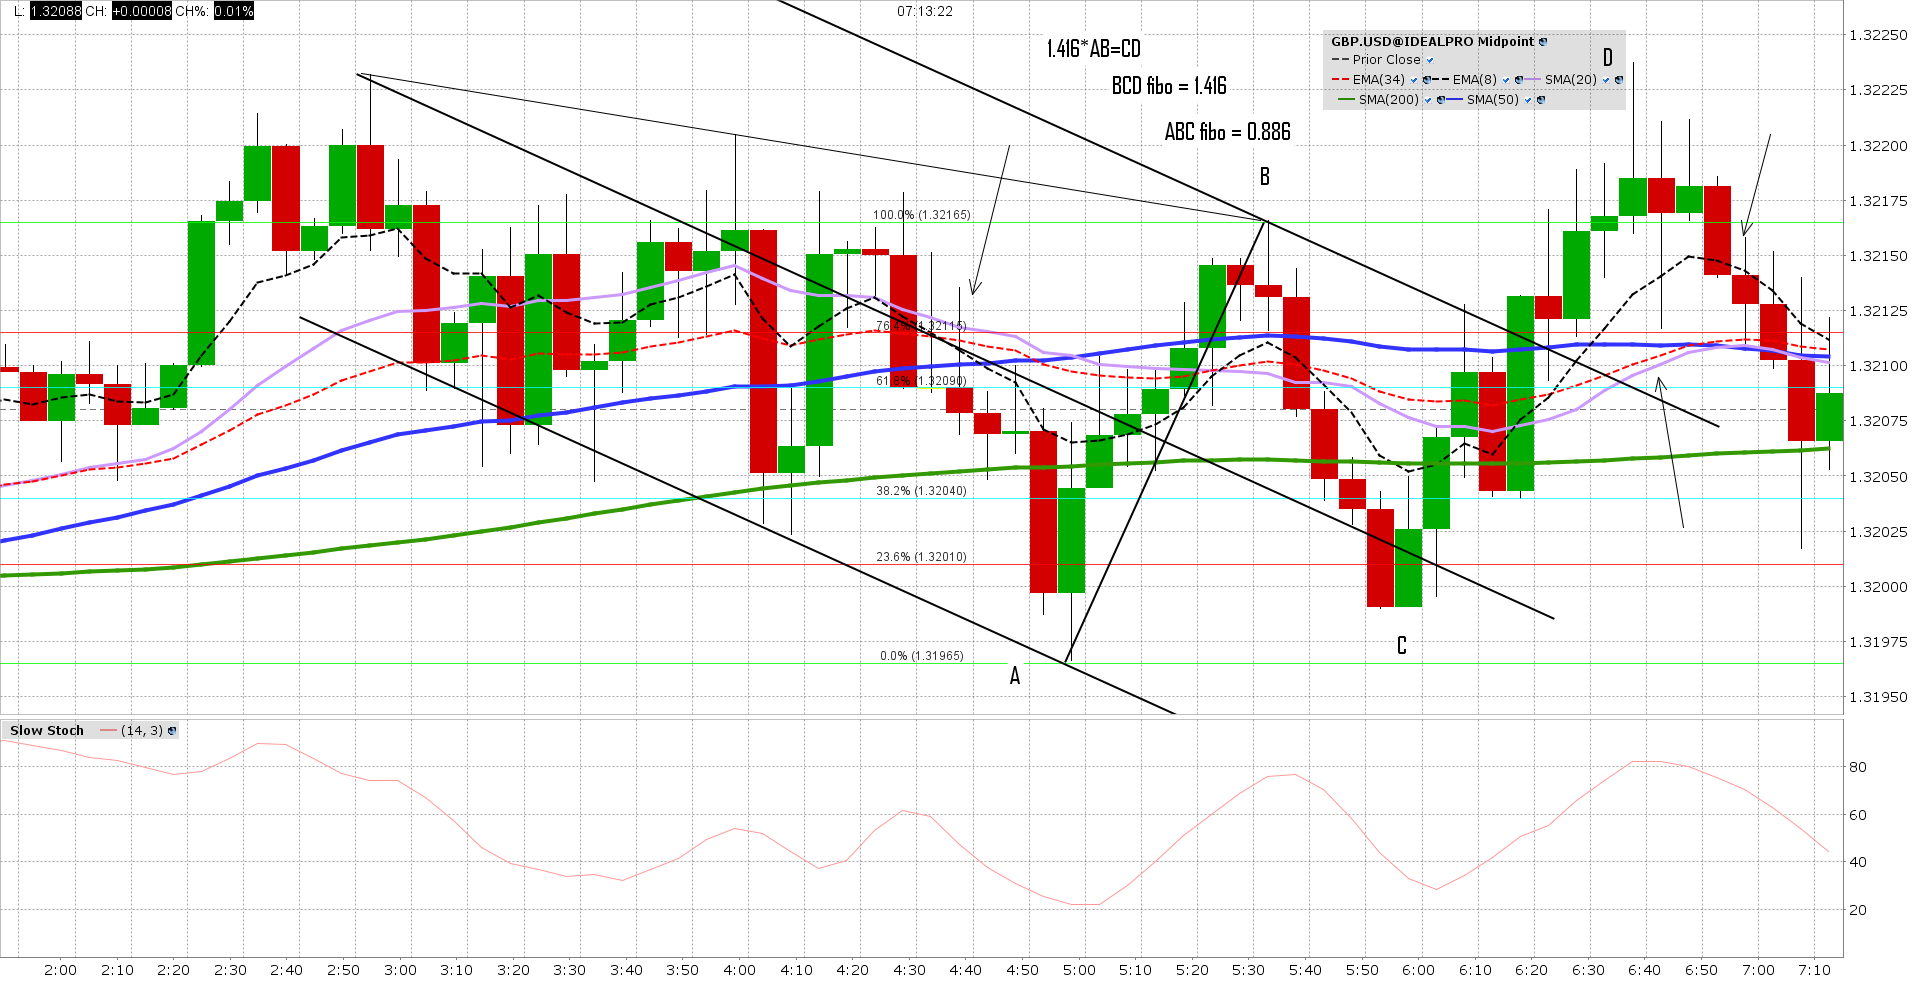
Here is enlarged chart showing the comments in larger view. I hope it is more readable.
Click image for original size
Originally posted by albert
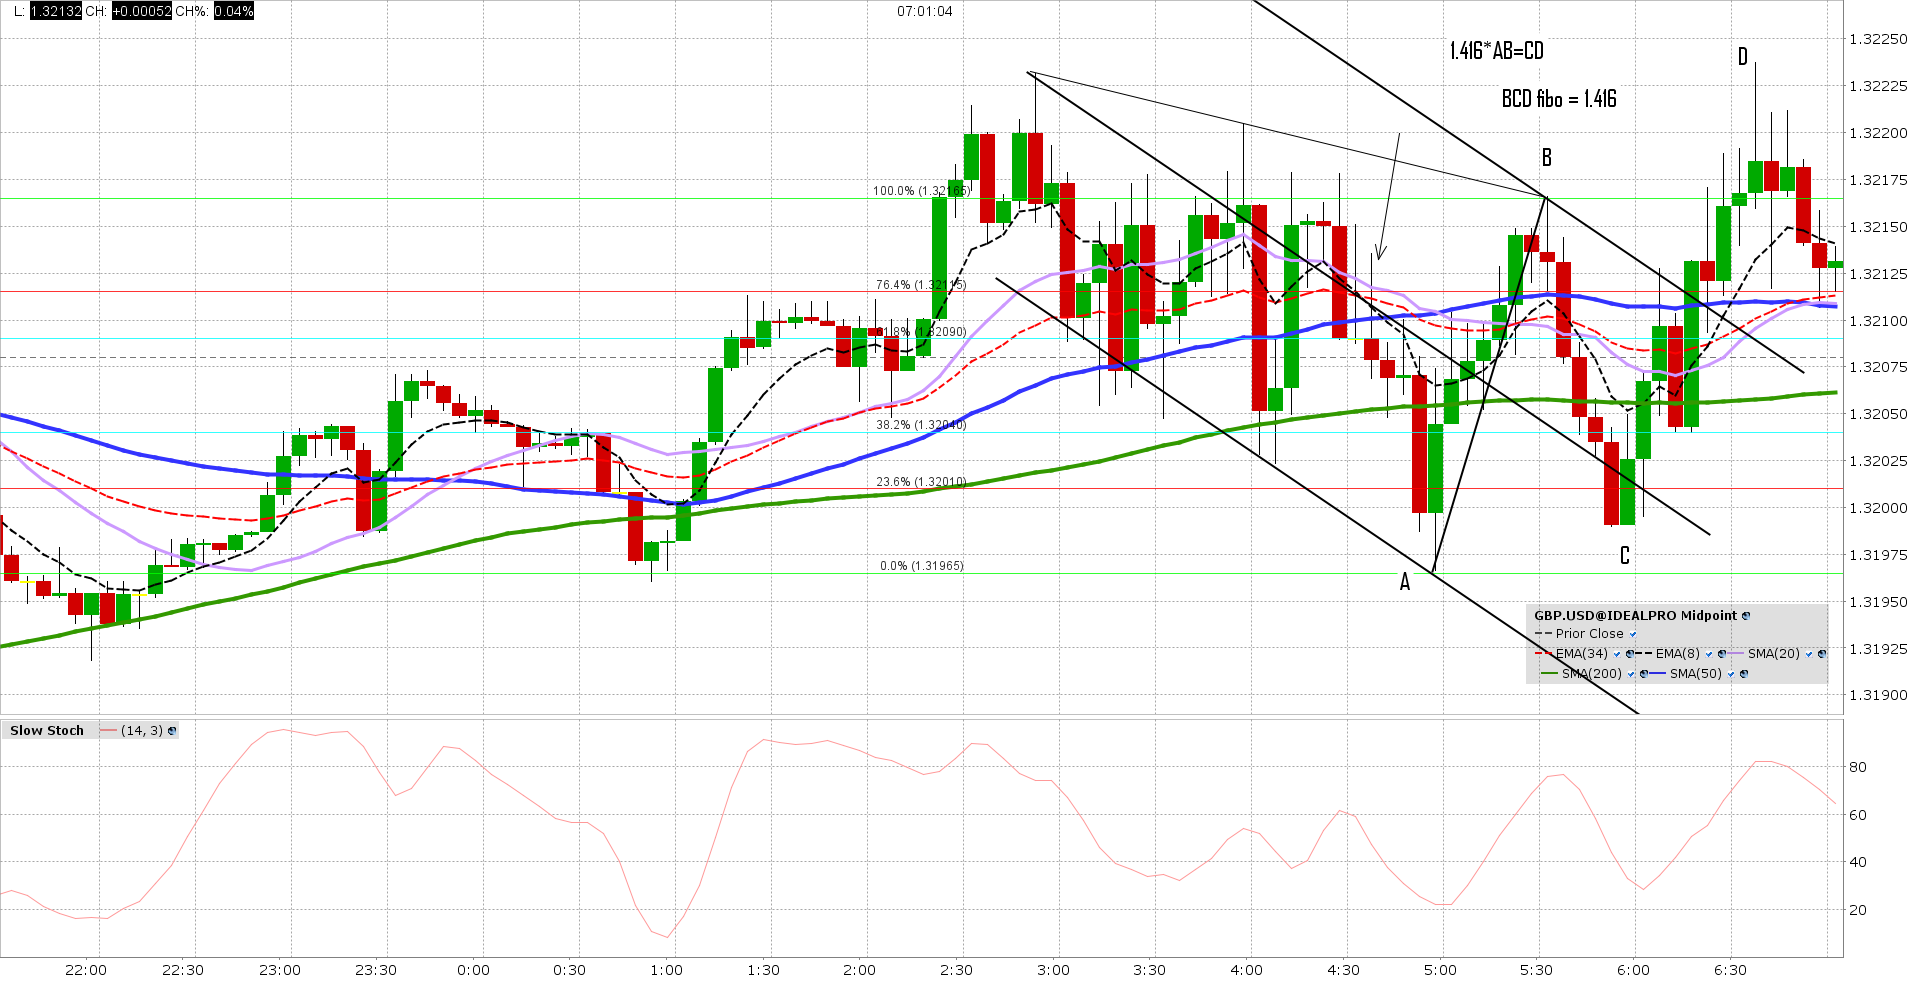
Paper trading. Made a small amount in an upmove in GBP.USD. I got out too soon, as usual. I constructed a ML Set because I could not find a ML drawing tool on my TWS workstation. :--)
Click image for original size
Al
MA
MarcinO
Rep: 67
Posts: 5,506
You have to be careful while assuming (X)ABCD patter with D above previous high (X). It may work, but only when the context and area tells you 'it's there'.
In this chart Al, I'd rather think that Cable made a new high (your D point) which makes it likely to continue. Everything from probabilistic standpoint of course - i.e. in this specific situation anything can happen but in a longer run assuming reversal everytime one sees expanding XABCD is very risky approach.
In this chart Al, I'd rather think that Cable made a new high (your D point) which makes it likely to continue. Everything from probabilistic standpoint of course - i.e. in this specific situation anything can happen but in a longer run assuming reversal everytime one sees expanding XABCD is very risky approach.
AL
albert
Rep: 99
Posts: 3,094
Marcin,
Thank you. Your points are well taken. I appreciate your views, and I know you speak from the wisdom of experience!
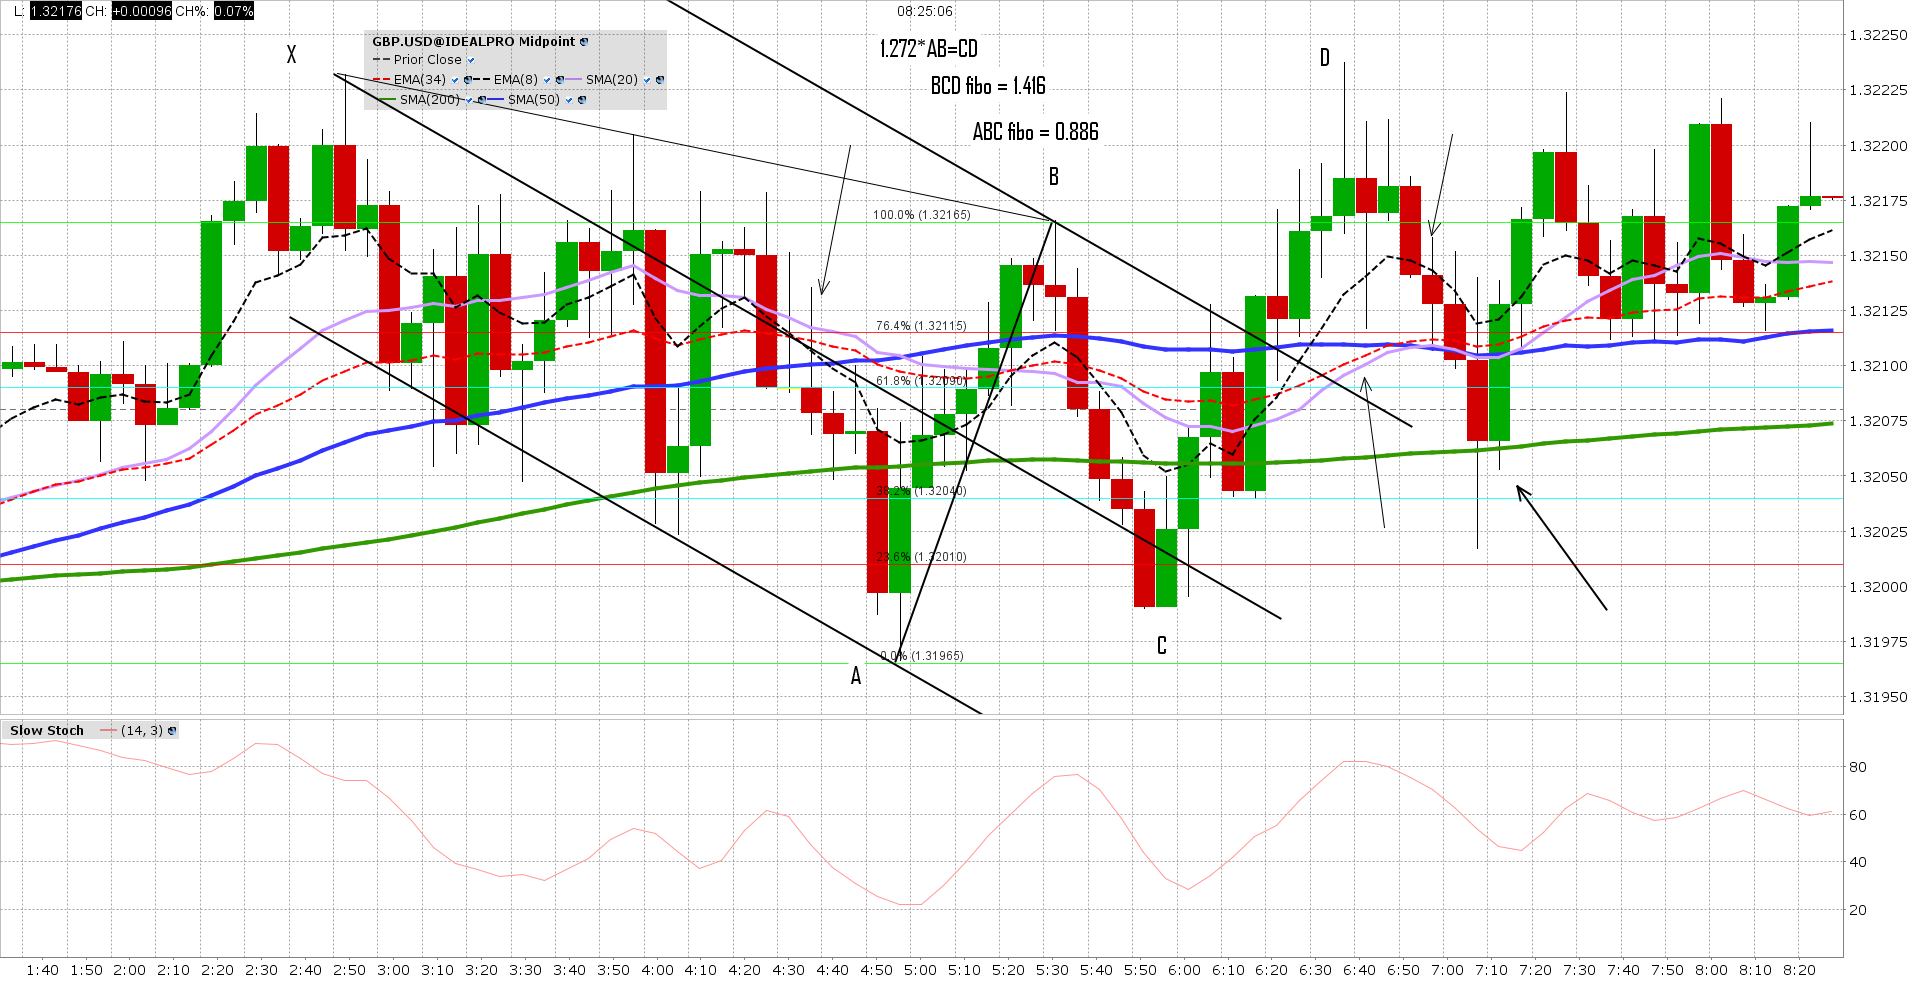
My chart was wrong. I rechecked my calculations and the X in my version of the formula, x*AB=CD, is much closer to 1.272 than it is to 1.416. So I want to correct to 1.272*AB=CD. I apologize for the mistake.
I agree with you completely. I entered the trade because I thought price was going up, in the AB leg of the ABCD. In general, I also like to try to try to trade in the CD segment in the CD direction.
Thanks, and Good Trading
Here is the corrected chart.
Al :--)
Thank you. Your points are well taken. I appreciate your views, and I know you speak from the wisdom of experience!
My chart was wrong. I rechecked my calculations and the X in my version of the formula, x*AB=CD, is much closer to 1.272 than it is to 1.416. So I want to correct to 1.272*AB=CD. I apologize for the mistake.
I agree with you completely. I entered the trade because I thought price was going up, in the AB leg of the ABCD. In general, I also like to try to try to trade in the CD segment in the CD direction.
Thanks, and Good Trading
Here is the corrected chart.
Click image for original size
Al :--)
AL
albert
Rep: 99
Posts: 3,094
Sorry, one more thing. Looking at the trade time stamp for my trade , I am pretty sure I entered in the CD leg of the ABCD.
Al.
Al.
MA
MarcinO
Rep: 67
Posts: 5,506
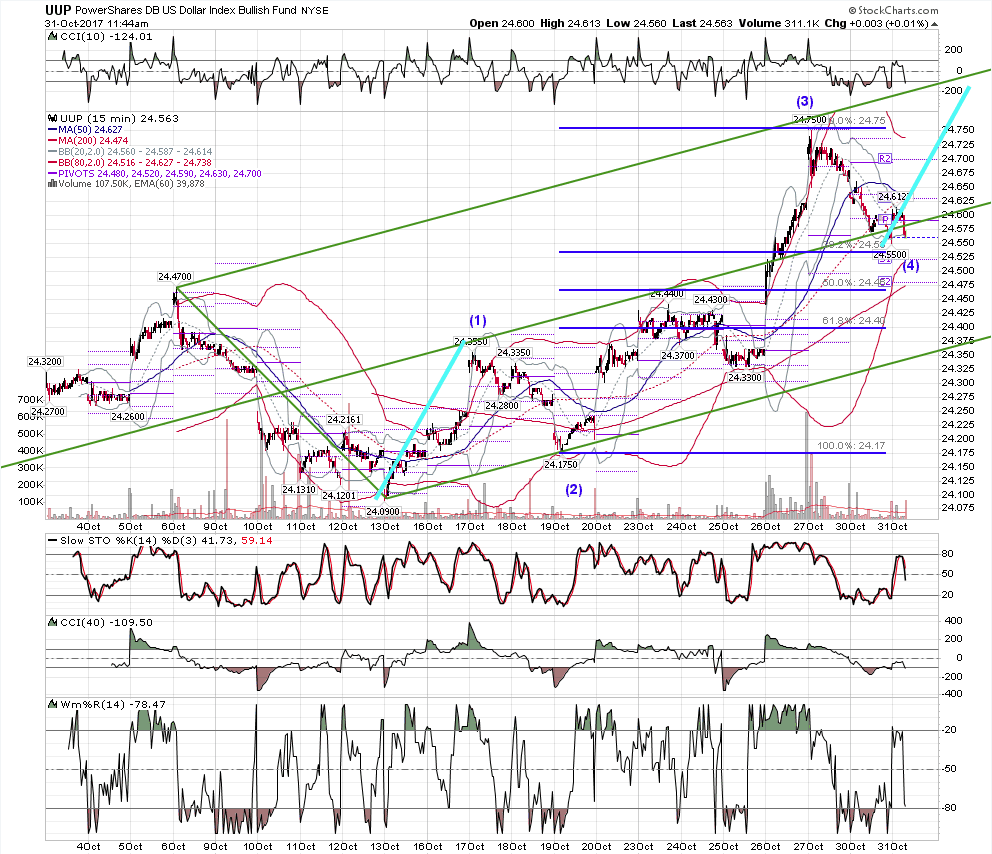
Cable broke to the upside, and tested low of area posted yesterday 1.3280-1.33.
Careful here and be ready to reverse.
Careful here and be ready to reverse.
AL
albert
Rep: 99
Posts: 3,094
rat,
Thanks for the reply, and thanks for sharing. roofer is brilliant, even though I do not understand all of his posts . I plan to reread roofer's posts that he posted here at MyPivots and to pay more attention to your and Marcin's posts.
All the best,
Good Trading,
Al :--)
Thanks for the reply, and thanks for sharing. roofer is brilliant, even though I do not understand all of his posts . I plan to reread roofer's posts that he posted here at MyPivots and to pay more attention to your and Marcin's posts.
All the best,
Good Trading,
Al :--)
Originally posted by rat89
Thanks Al,
You too. I remember when roofer first started working with me. He asked if I wanted him to explain everything or to show me enough so I could figure it out. I said the latter, and instantly regretted it. He sent me hundreds of charts, with notations, and I studied them endlessly. It was like nothing I had ever seen; there were notations in there that he doesn't show publicly. And I was not getting it. I wanted the explanation. And the trades looked good and some of them blew me out of the water. Then one day I started to see it. Don't ask me how. And then many years later he pointed me in the direction of elliot wave work. And I finally realized that when I took a reversal trade that didn't work, I was trying to trade a reversal of the end of a wave 3. Wave 4 would end, and wave 5 would knock me out. The bull (bear) abcd at the .382 area is a setup that trades wave 5, which is why it is so predictable. So predictable that he called it the 87% trade years ago, since price went back to the high (low) 87% of the time in his samples.
So here's my last pointer of the week. When you show two highs and the second high is at .886 - the median line work should somehow be anchored off the first high because that is the high that is related, the lower high is not the setup. Sometimes the median line set anchored at the first high seems too extreme. And it is. Except that sometimes it isn't. So remember that two sharp back to back moves call for a modified schiff set, anchored at the .50 of the first move. Sometimes I put on both and see where price goes.
Originally posted by albert
Marcin and rat,
Thank you both for sharing your comments and your charts. I am indeed fortunate to be able to see what you both are looking at, chartwise, and hearing what you both have to say. I intend to reread this past week's posts here, and see if I can learn more about trading. I also have begun rereading "Dynamic Trading" by Robert Miner, and hope to learn more about ew.
I hope you, Marcin and rat, have a great weekend.
Good Trading to both of you. You have certainly helped me in my trading.
Al :--)