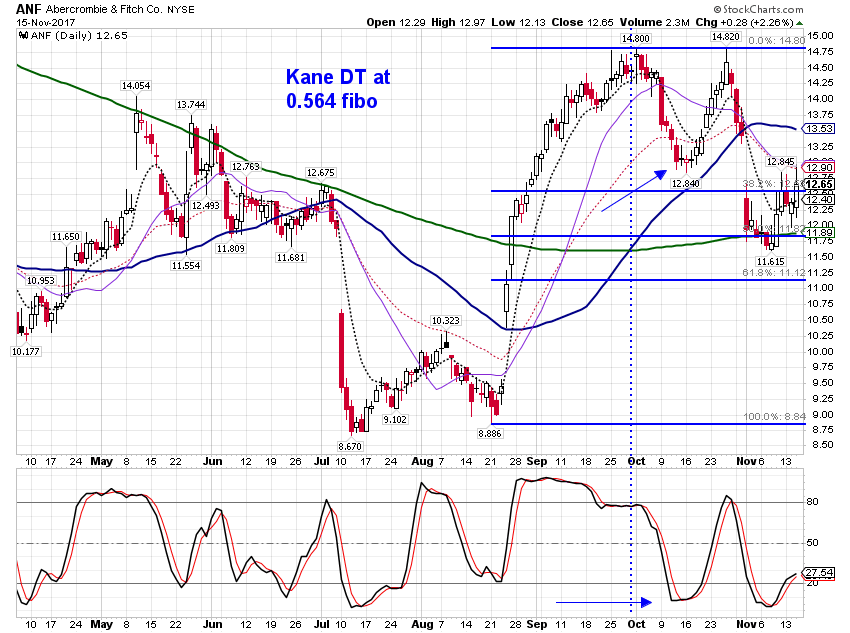
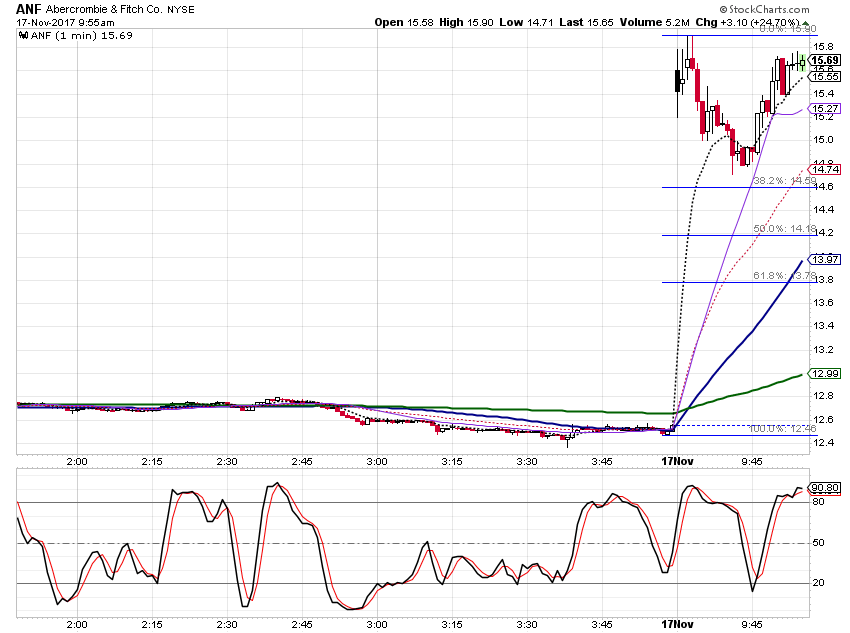
Starting it off.
Al
RA
rat89
Rep: 0
Posts: 7,015
Click image for original size
Click image for original size
Click image for original size
RA
rat89
Rep: 0
Posts: 7,015
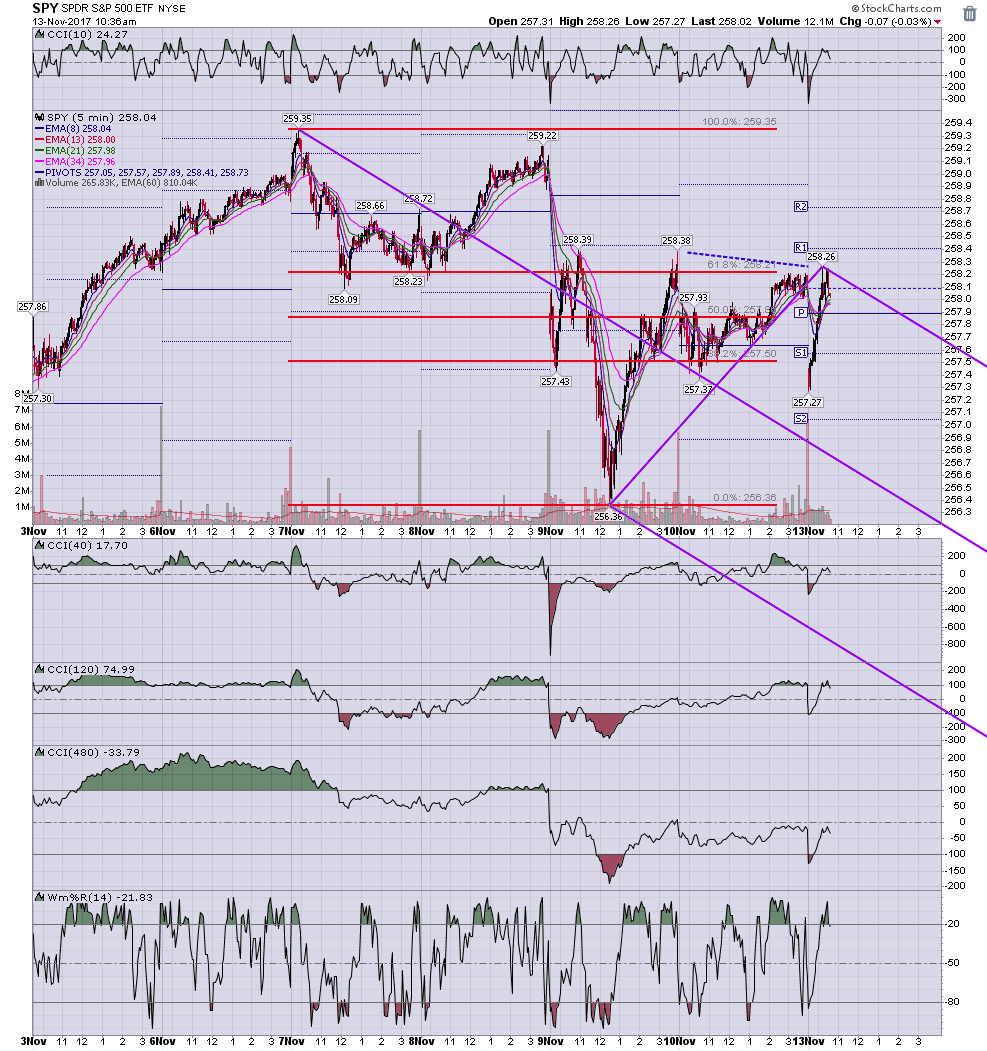
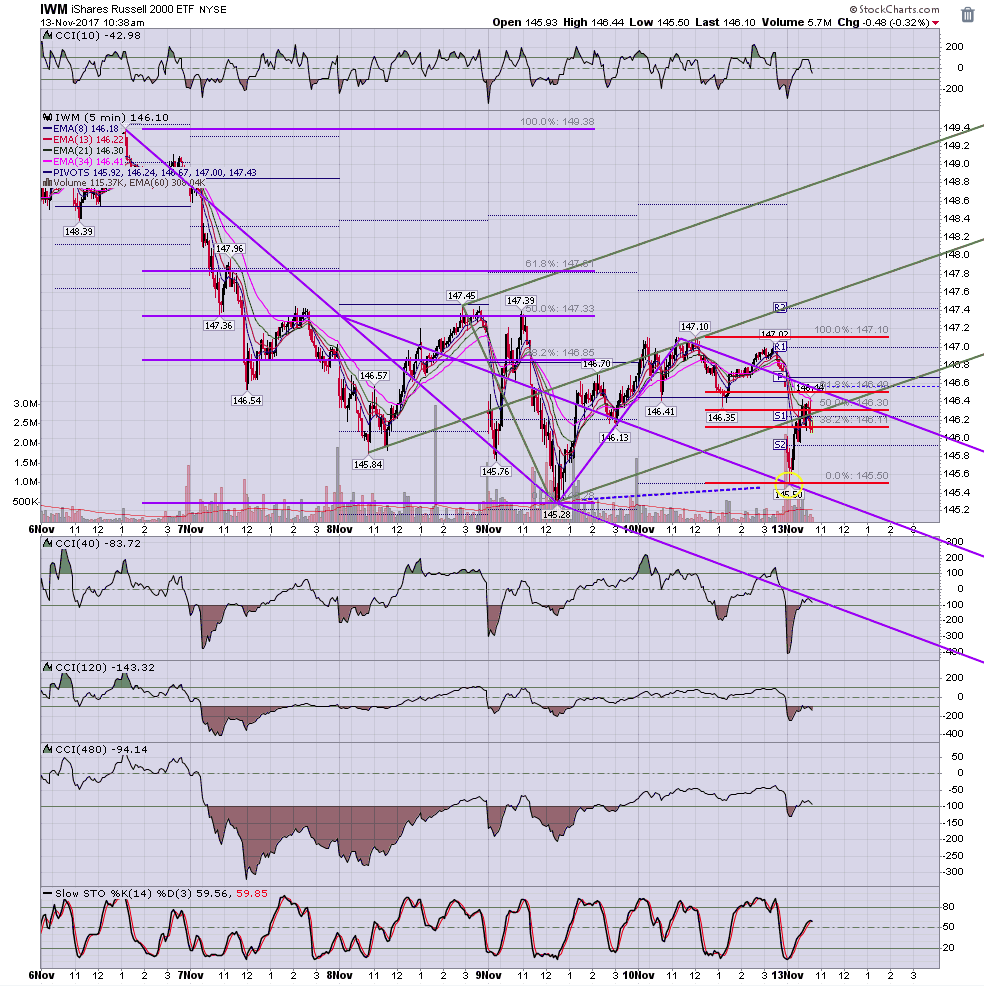
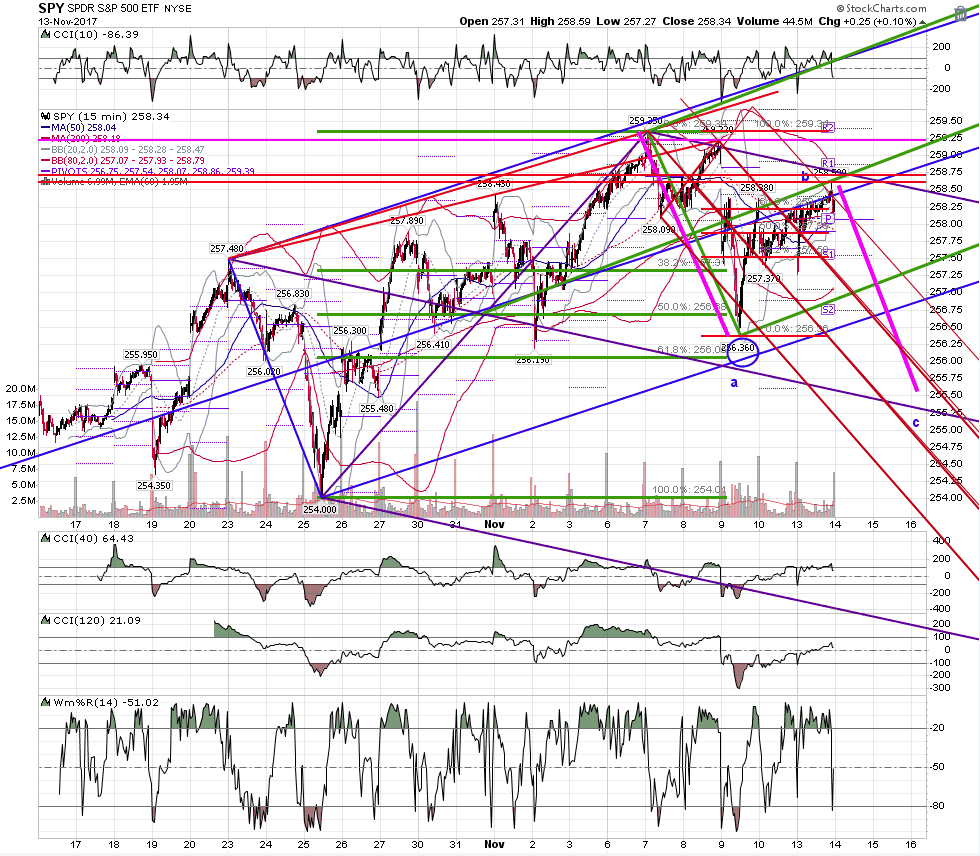
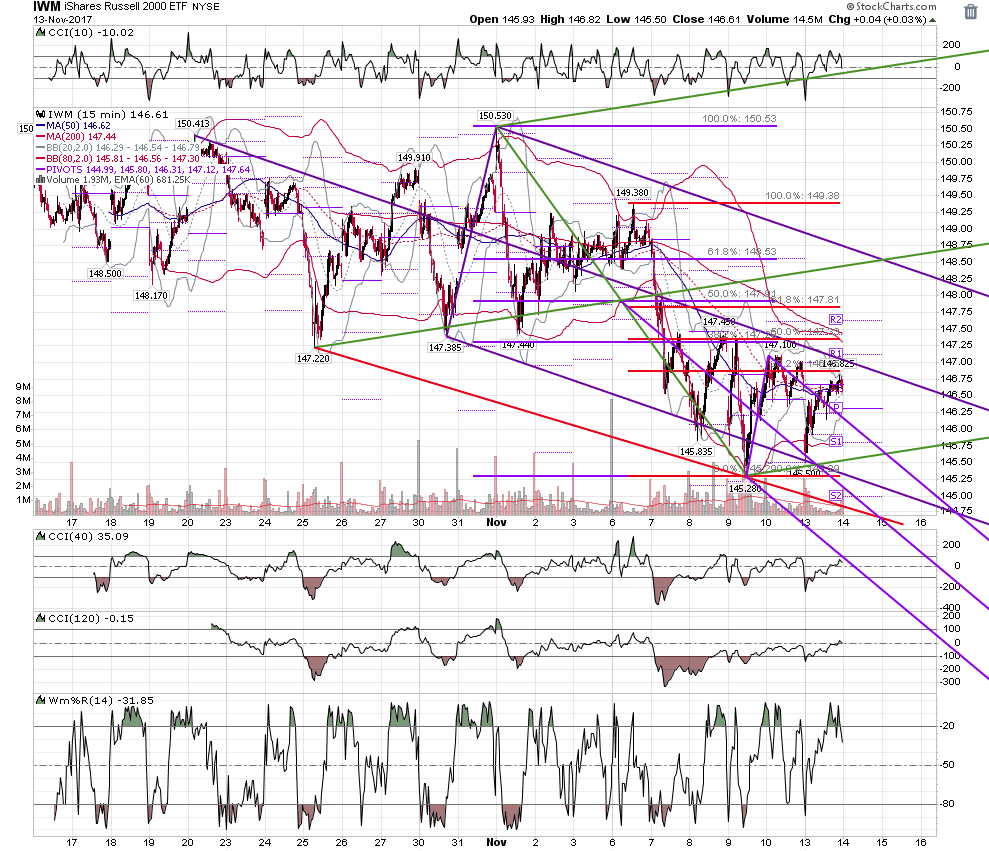
spy went higher and invalidated that setup. However, here it is, with iwm, set up to sell off for c before moving higher:
Click image for original size
Click image for original size
MA
MarcinO
Rep: 67
Posts: 5,506
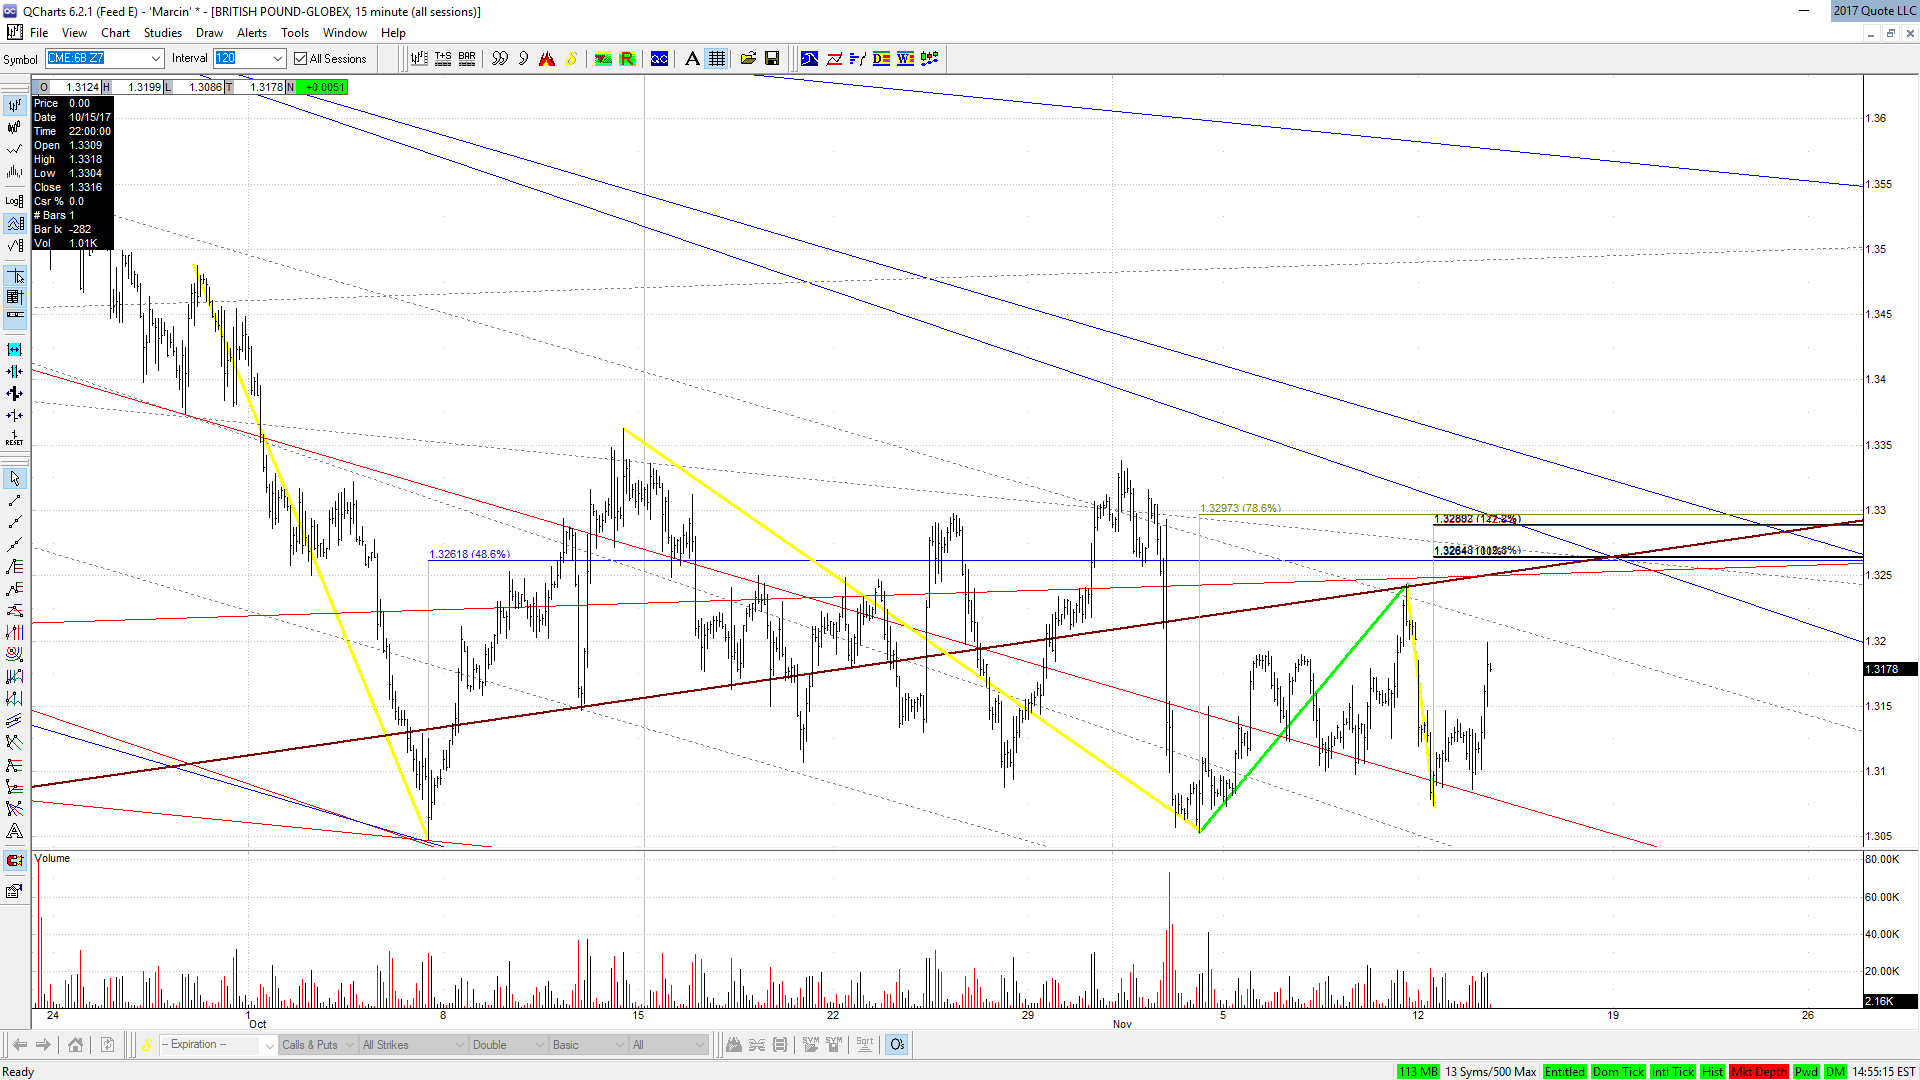
Depending on time when it gets there, I guess we will see Cable (6B Z7) at 1.3260 or 90, in a few days.
Click image for original size
AL
albert
Rep: 99
Posts: 3,094
Originally posted by albert
Originally posted by rat89
yeah, your B looks like a (1) and your C looks like a (2). Next move up looks like a wave 3
rat, I appreciate your comments! Al
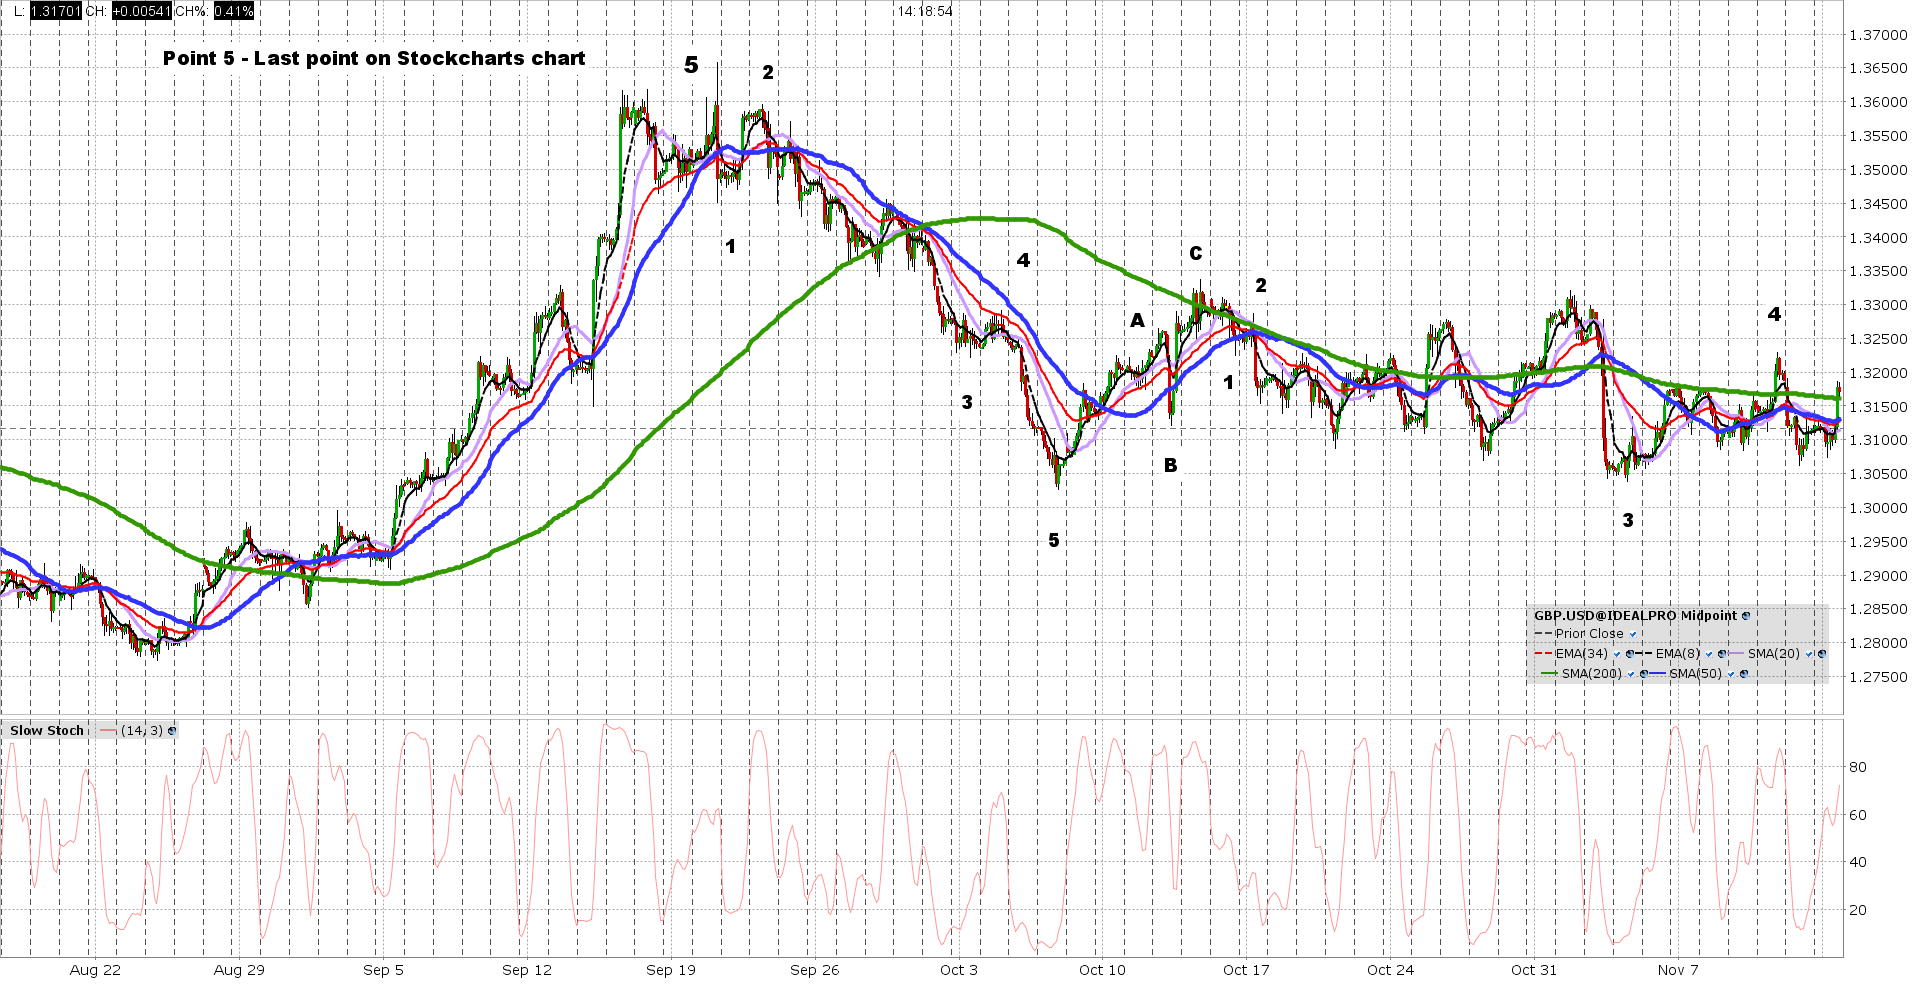
Work in progress. If this wave count is correct, then IMO GBP.USD is now in a corrective mode, and I have not analyzed that yet. I think it is an ABC correction in the form of a five step Wave A, a 3 step Wave B, and a 5 step Wave C. I will post that later.
Click image for original size
Al
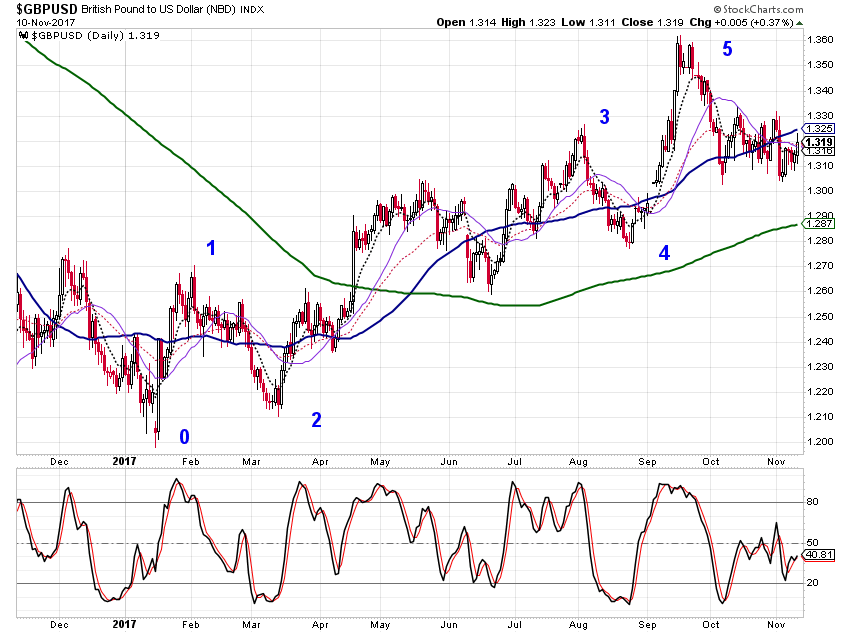
Using TWA charts for intraday data because StockCharts does not have inHere is what I got. All I can say is the the numbering does not violate the 3 Elliott Wave trading rules!
AL
albert
Rep: 99
Posts: 3,094
Oops, pressed thew wrong button. Here is the chart,
Originally posted by albert
Originally posted by albert
Originally posted by rat89
yeah, your B looks like a (1) and your C looks like a (2). Next move up looks like a wave 3
rat, I appreciate your comments! Al
Work in progress. If this wave count is correct, then IMO GBP.USD is now in a corrective mode, and I have not analyzed that yet. I think it is an ABC correction in the form of a five step Wave A, a 3 step Wave B, and a 5 step Wave C. I will post that later.
Click image for original size
Al
Using TWA charts for intraday data because StockCharts does not have inHere is what I got. All I can say is the the numbering does not violate the 3 Elliott Wave trading rules!
Click image for original size
MA
MarcinO
Rep: 67
Posts: 5,506
You guys made a great job with wave count which is a very useful tool, the one that can be denied or confirmed easily, so even if one is wrong he still gest the secong chance.
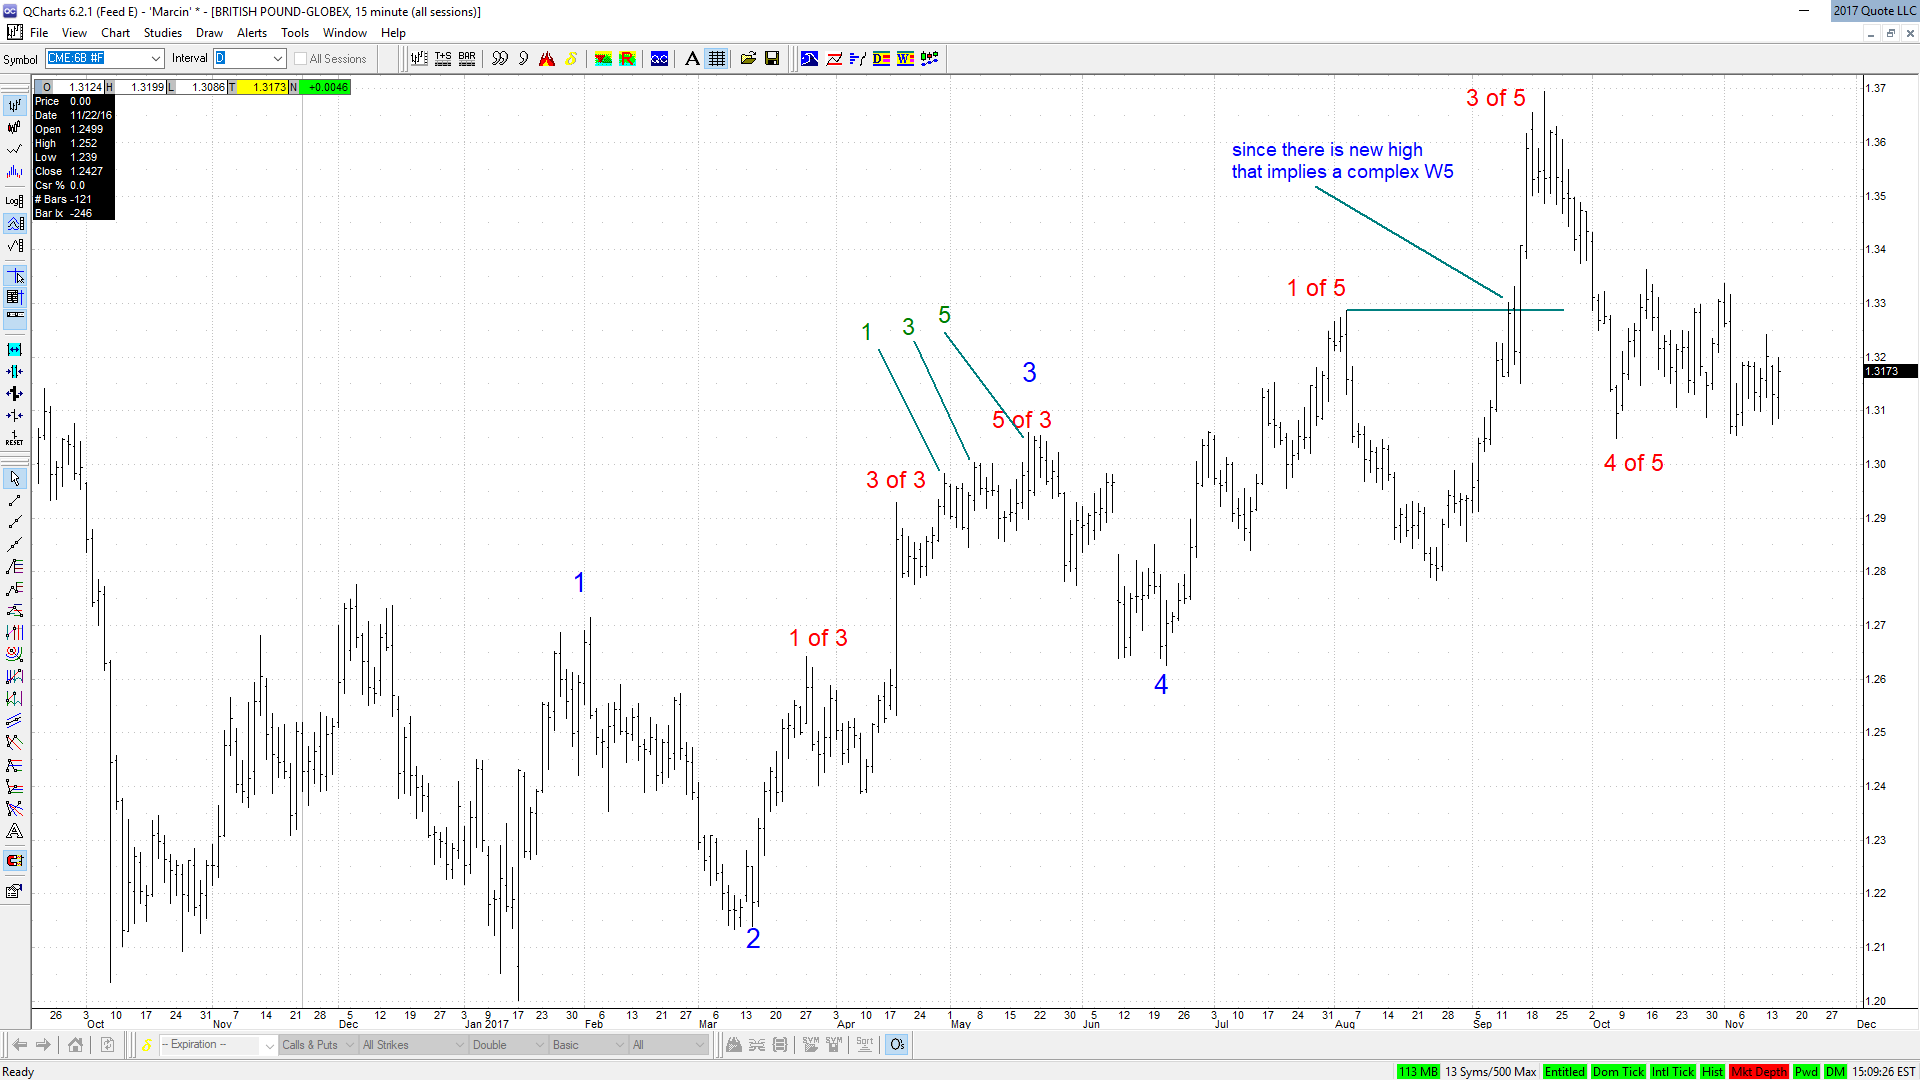
Referring to the higher chart. What you placed there is a perfectly correct wave count. I have that one done for me, but I also prepared an alternative one. At this point, I am not sure which one of them is more probable, so I keep both in mind. At this point it does not impact my day trading.
Blue waves are the largest one and the red ones are parts of them (I placed greens too, just for fun, as they do not impact larger structures). If this one is correct, there will be one more new high on daily chart, before a significant move down.
Click image for original size
RA
rat89
Rep: 0
Posts: 7,015
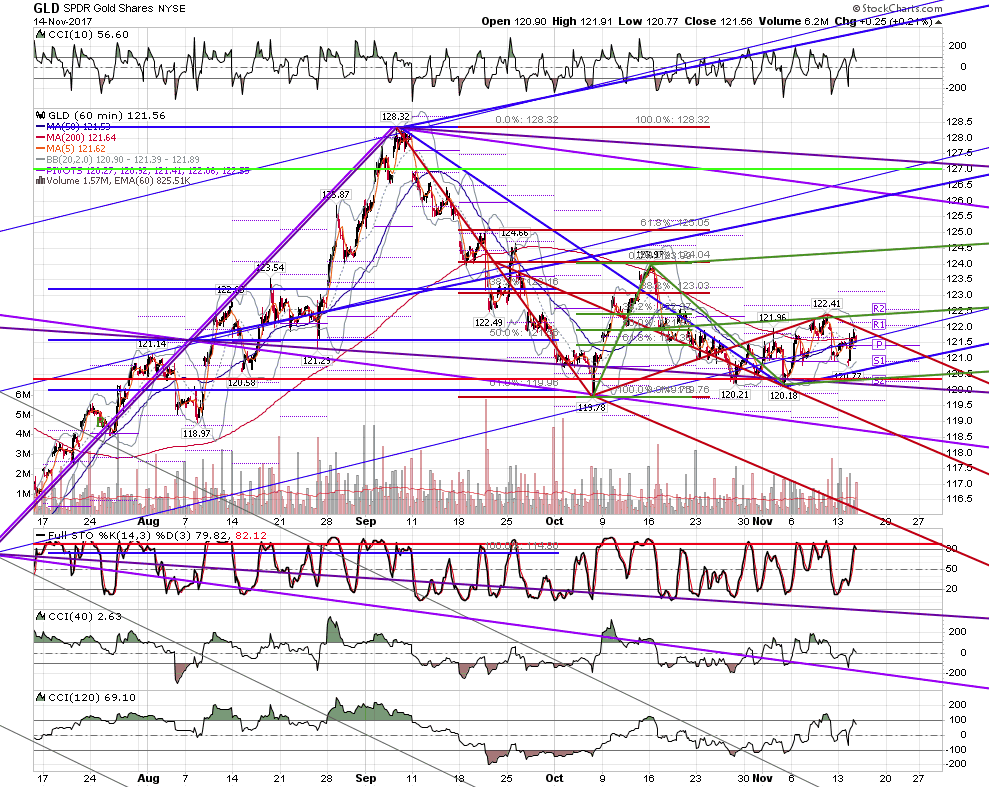
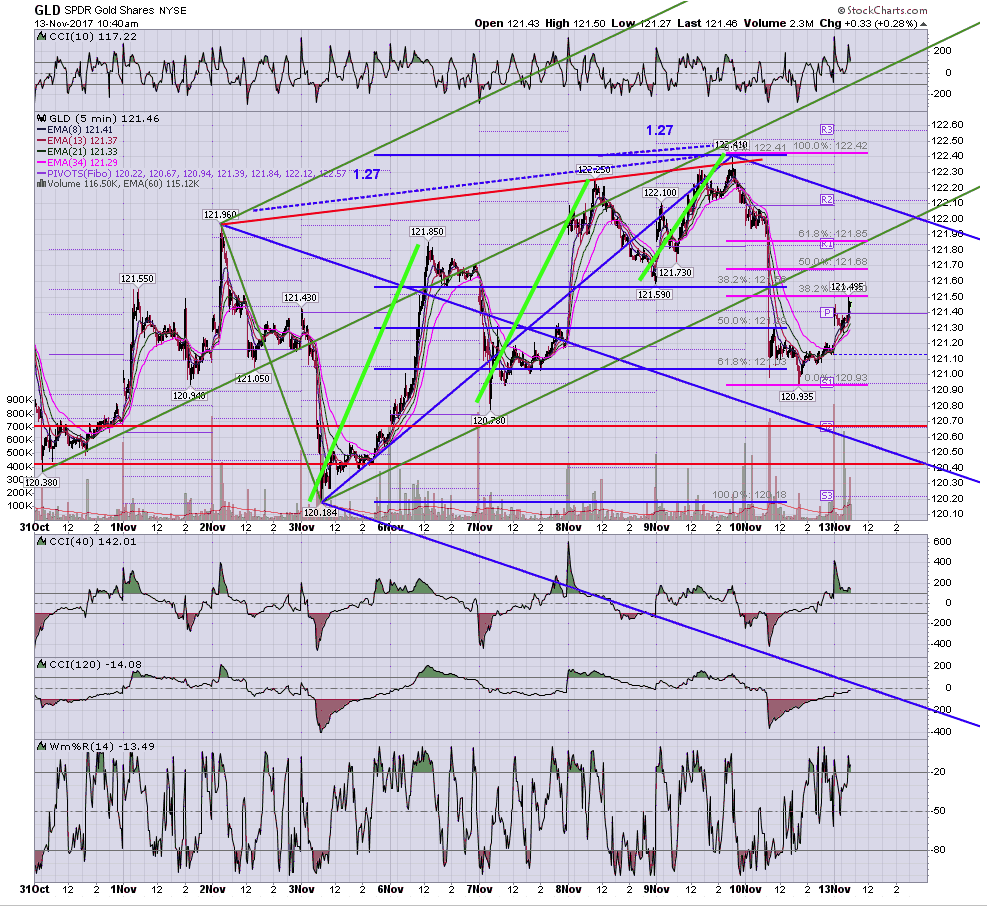
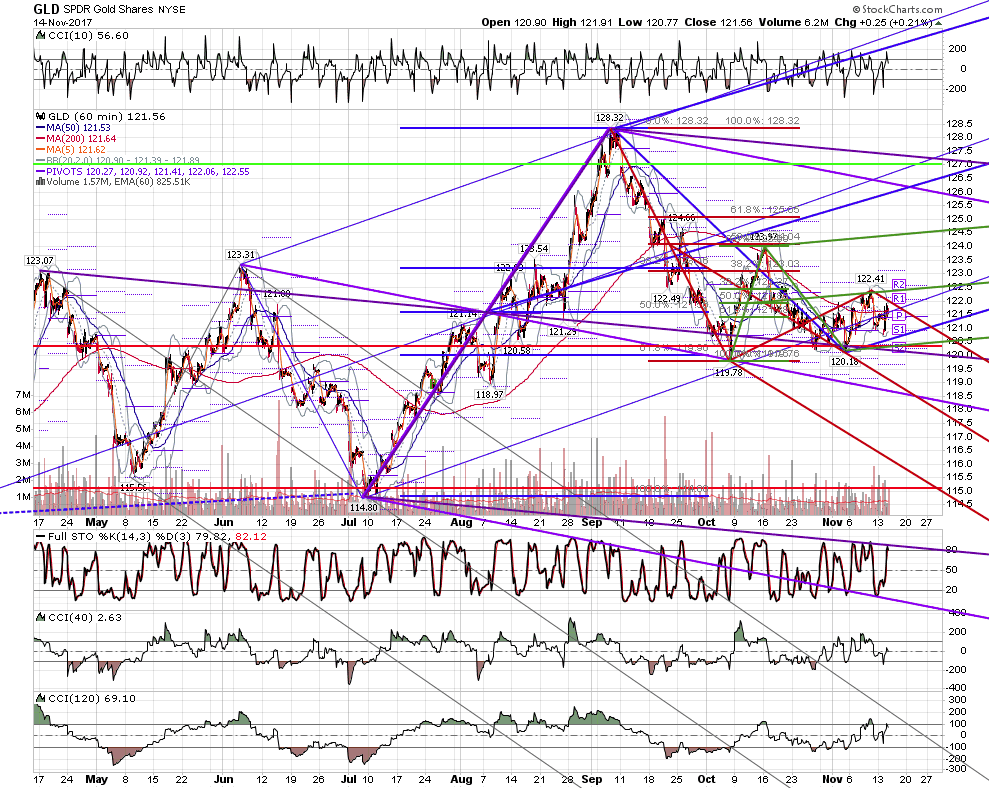
speaking of wave counts, gld is pointing both ways. So....did it recently retest the low, and is about to explode up? Or is it making a bearish abcd, failing at ever lower levels? The fibs are perfect in both directions.
Click image for original size
Click image for original size