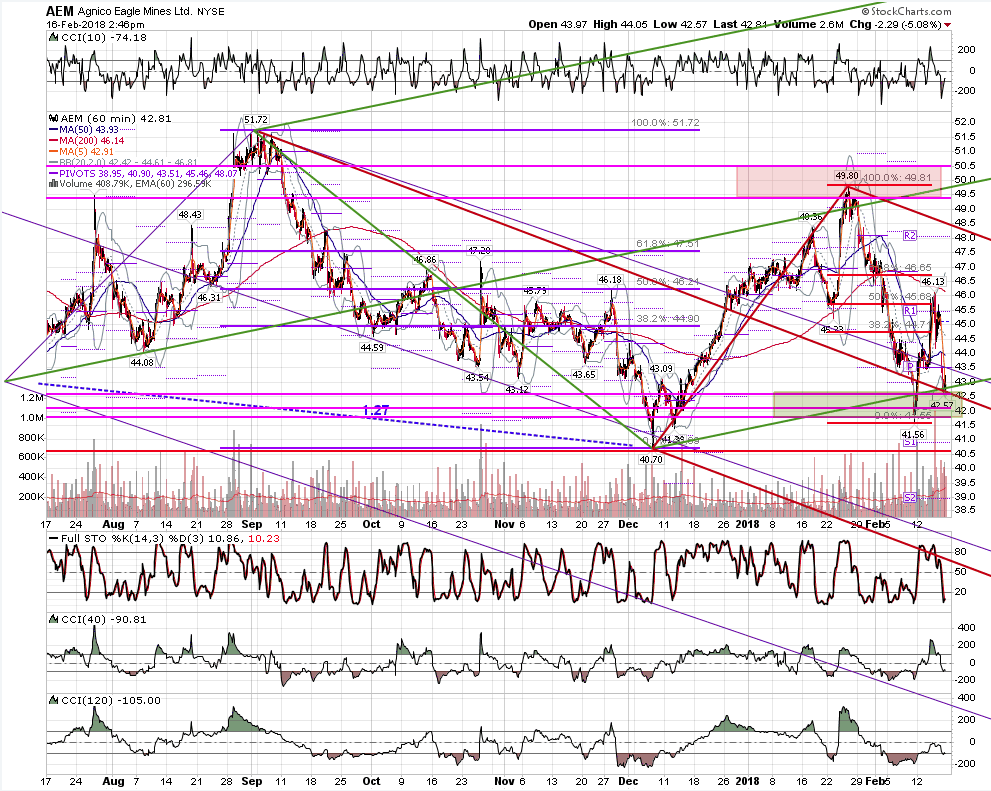
Starting it off.
Al
DU
Duane
Rep: 100
Posts: 1,095
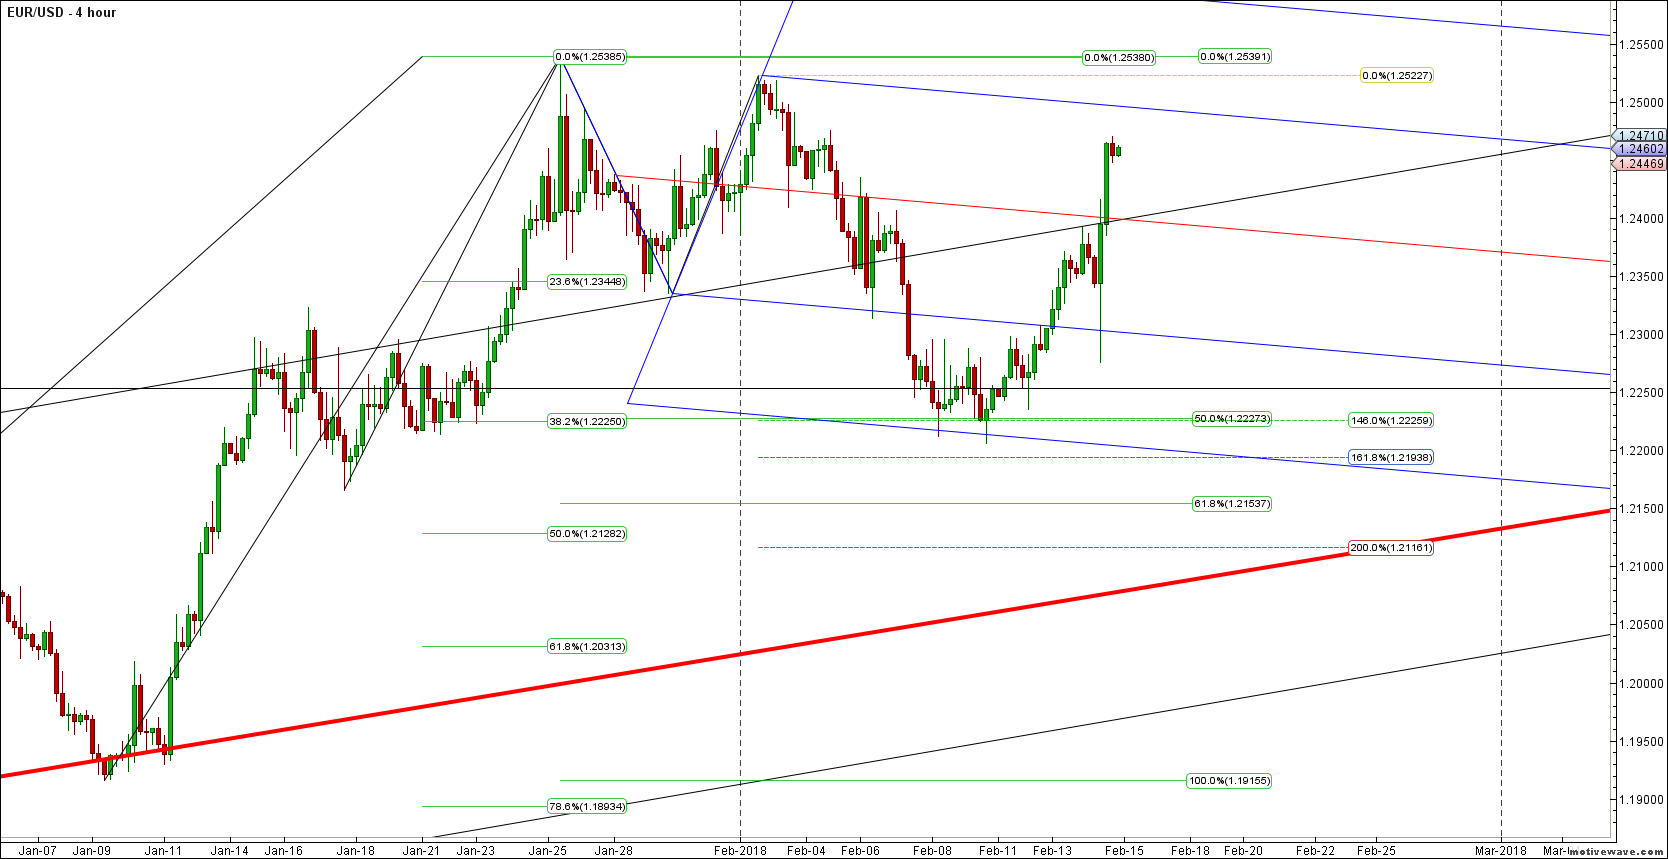
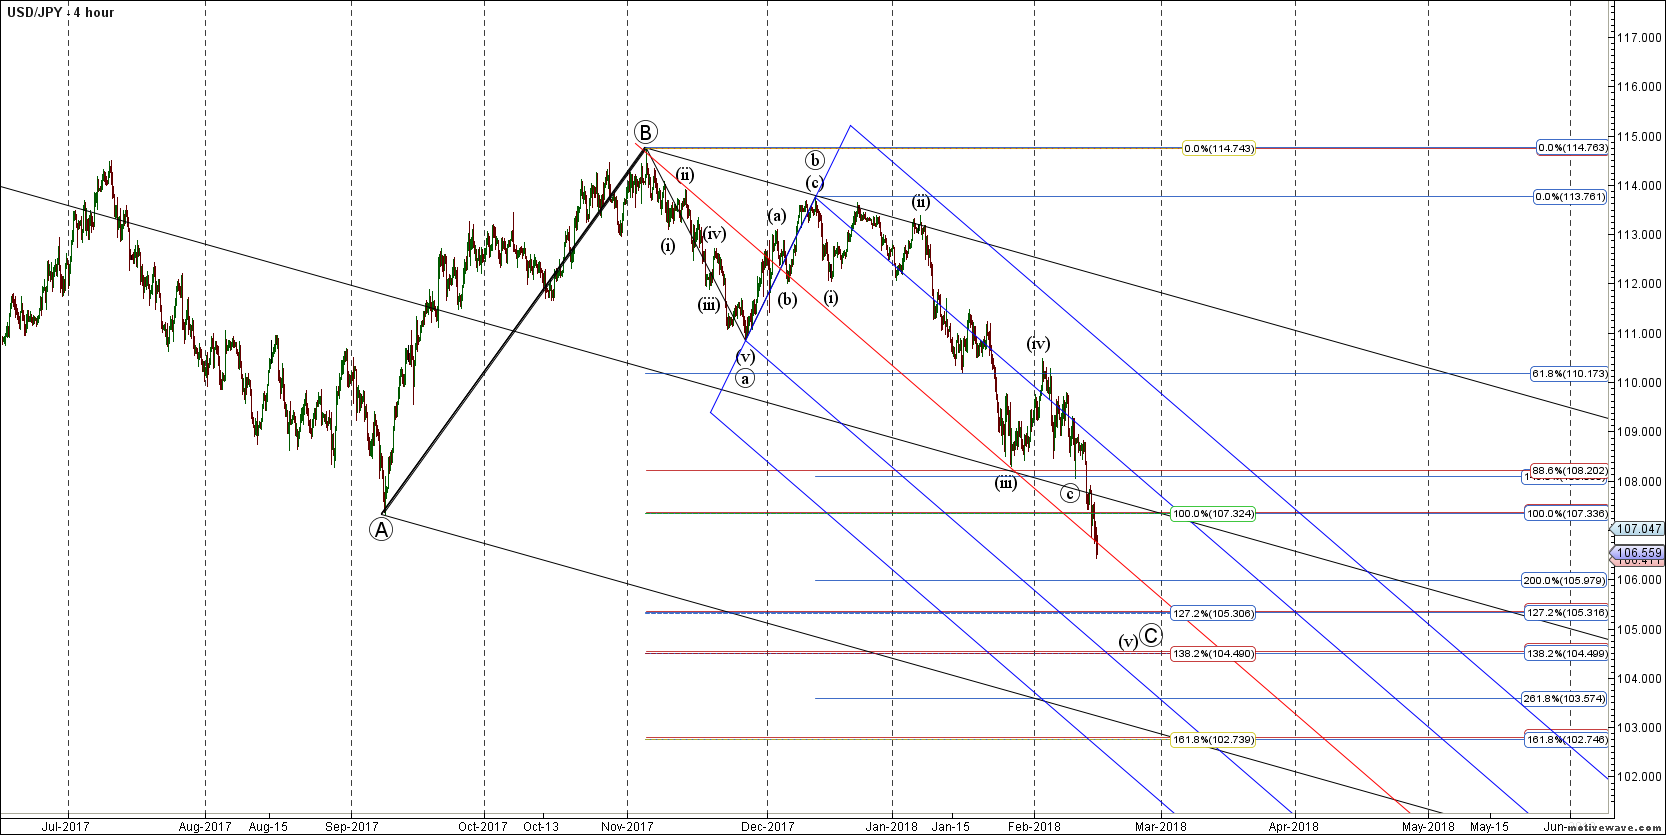
So happpI hope that all you USD traders were having lunch with your loved ones when all the action occurred,
So happy I was not at my charts at the time.......
When USD reverses I will go long against my bain USDJPY ....my bain...
Click image for original size
Click image for original size
Click image for original size
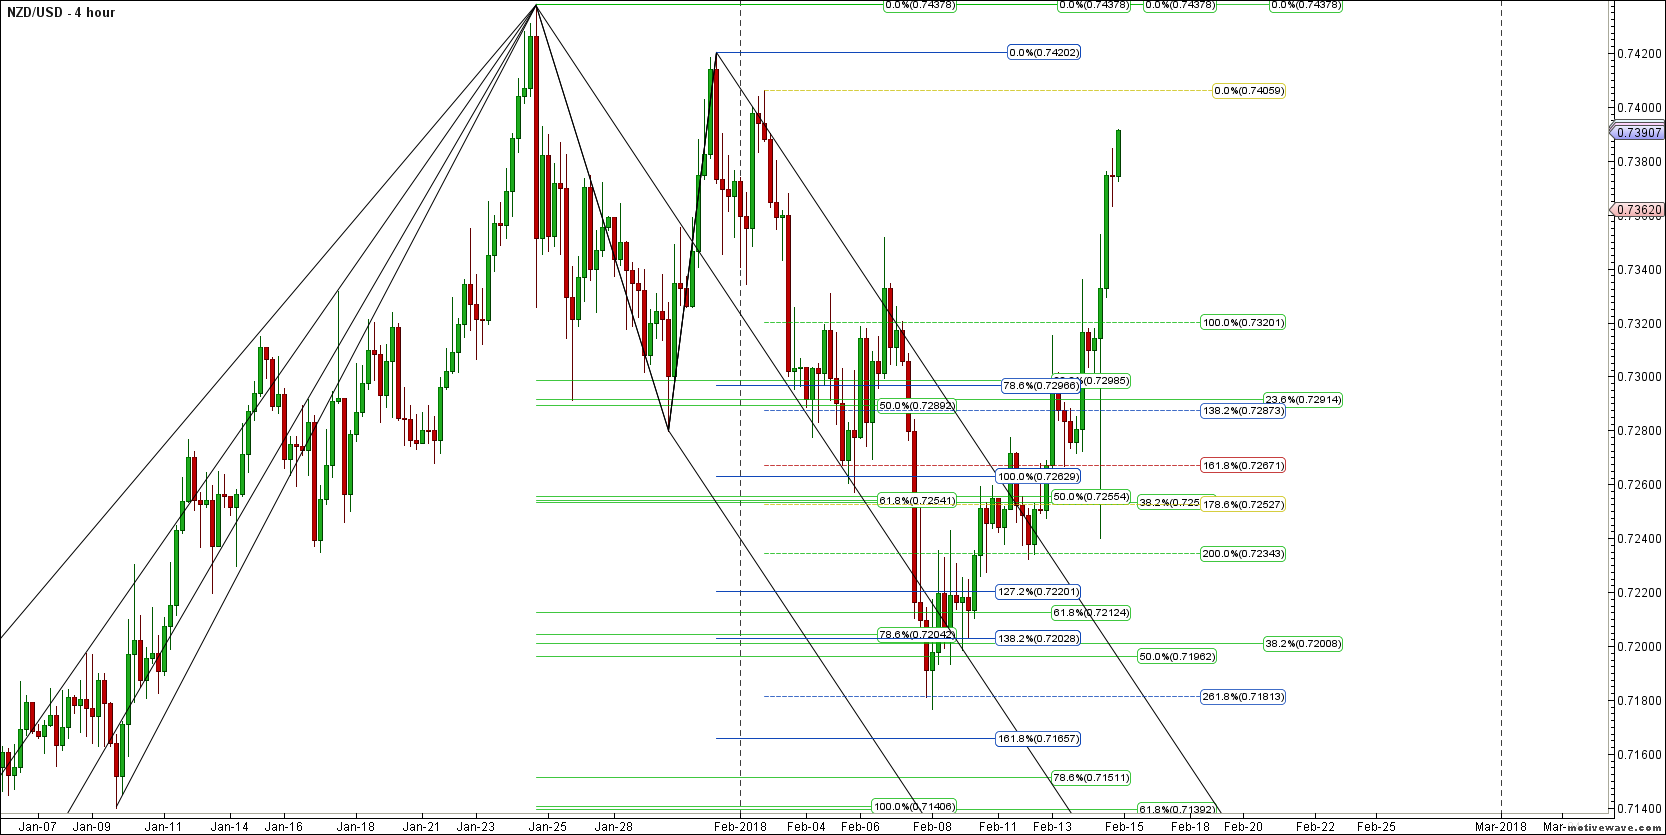
So happy I was not at my charts at the time.......
When USD reverses I will go long against my bain USDJPY ....my bain...
Click image for original size
RA
rat89
Rep: 0
Posts: 7,015
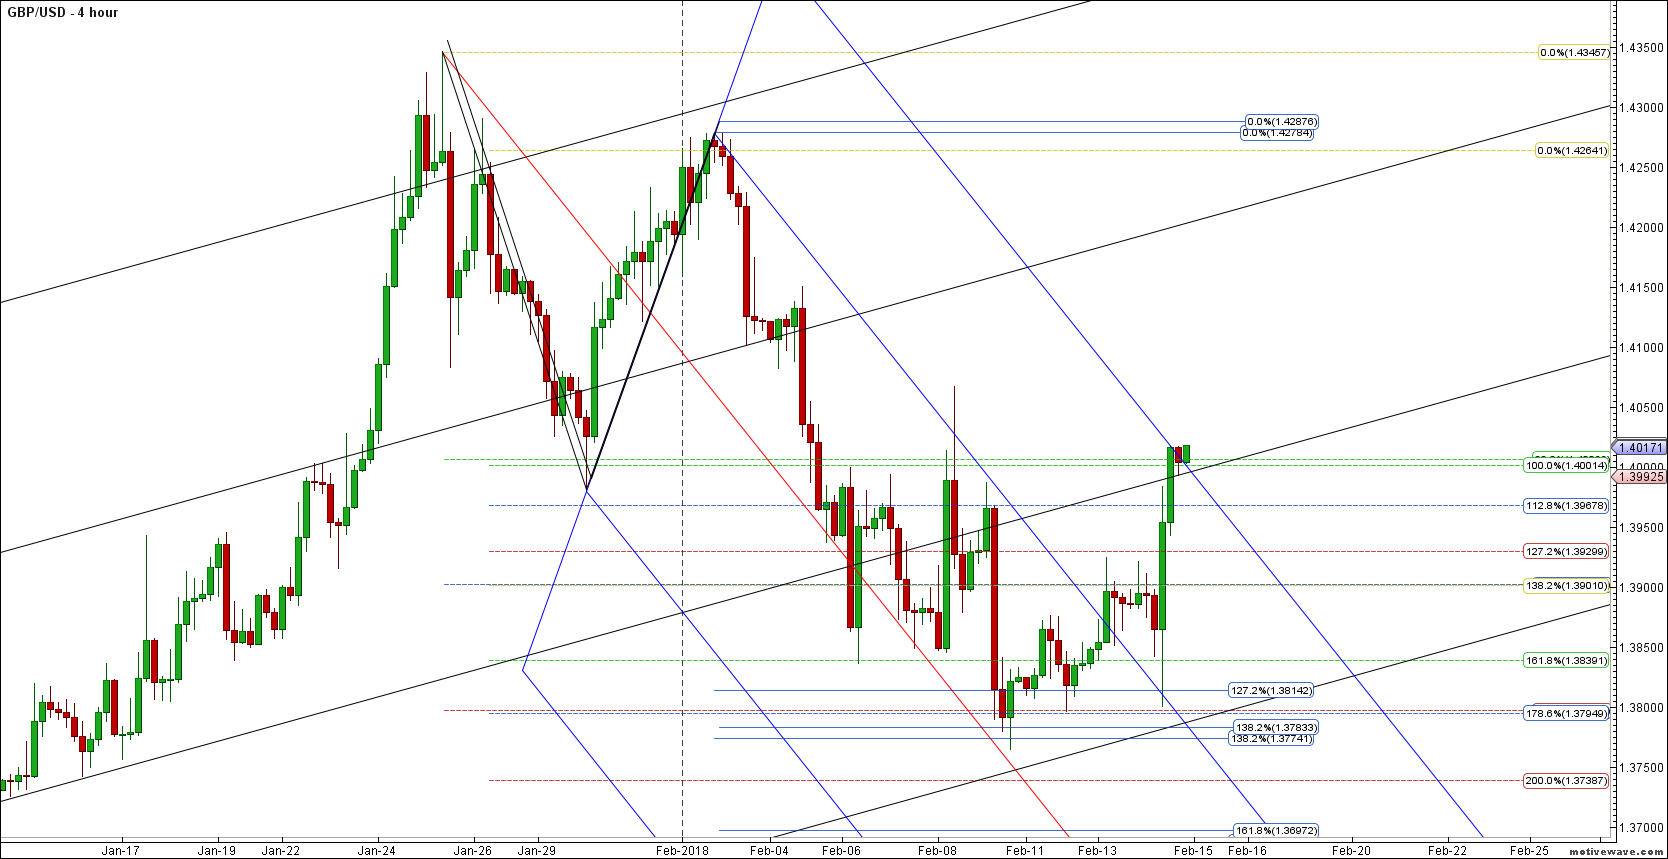
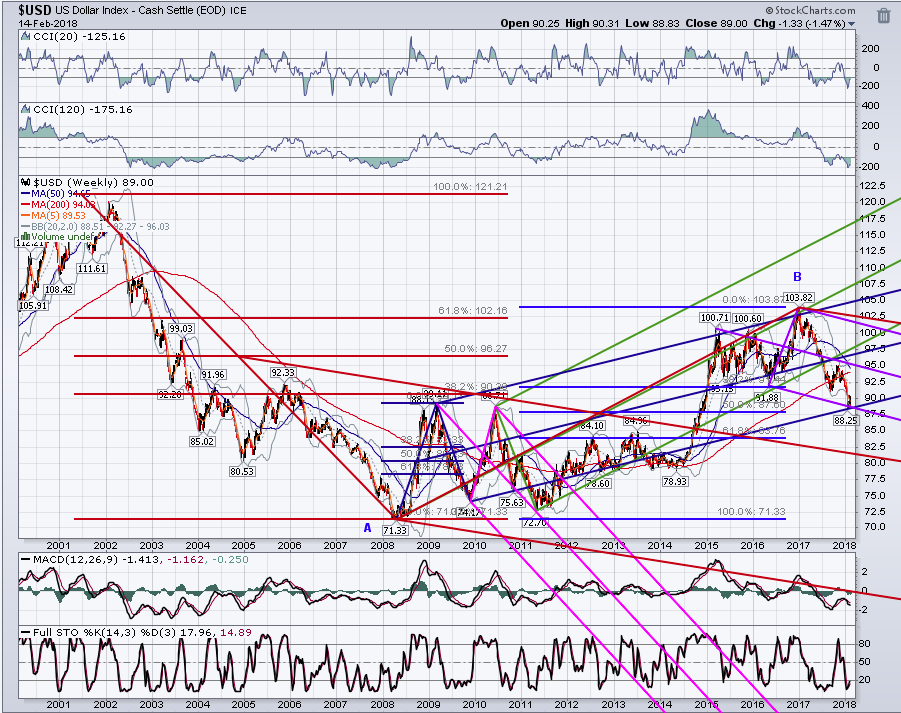
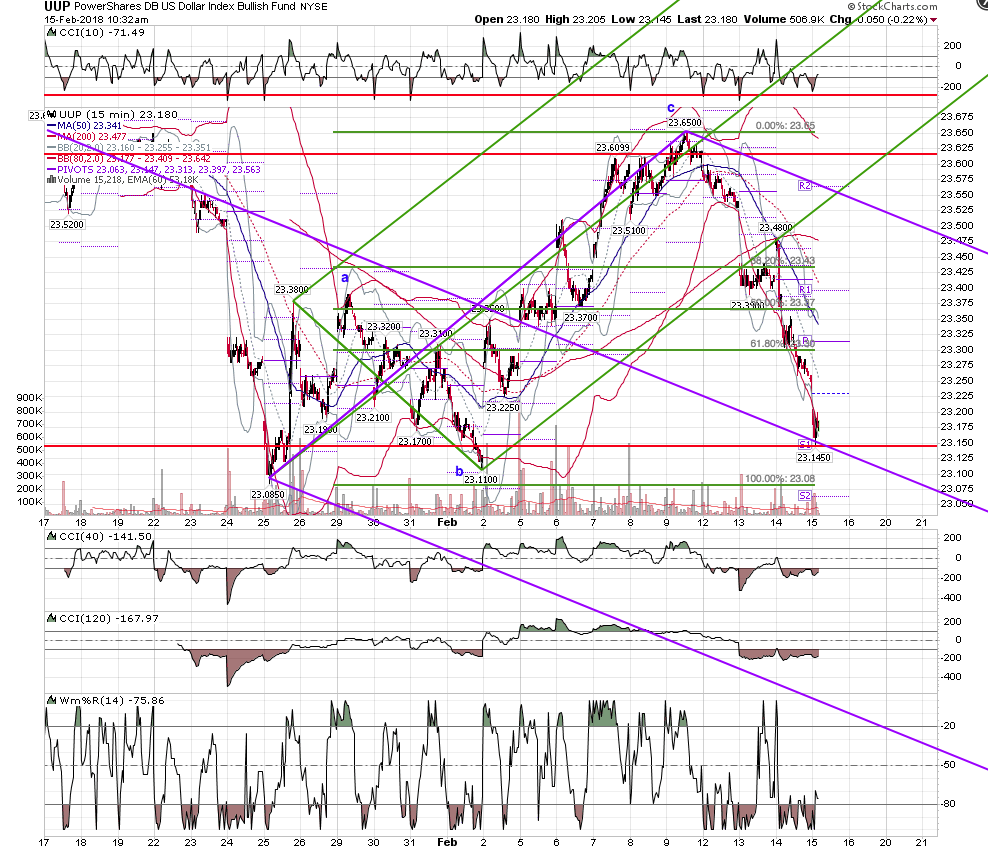
backing out a lot, there's a potential large ABC in progress, and this could be minor 3 of major [1] of C down....
Click image for original size
DU
Duane
Rep: 100
Posts: 1,095
Rat, great charts. please keep posting them. Learning a lot about forks. Thank you!
AL
albert
Rep: 99
Posts: 3,094
I second that!
Al
Al
Originally posted by Duane
Rat, great charts. please keep posting them. Learning a lot about forks. Thank you!
RA
rat89
Rep: 0
Posts: 7,015
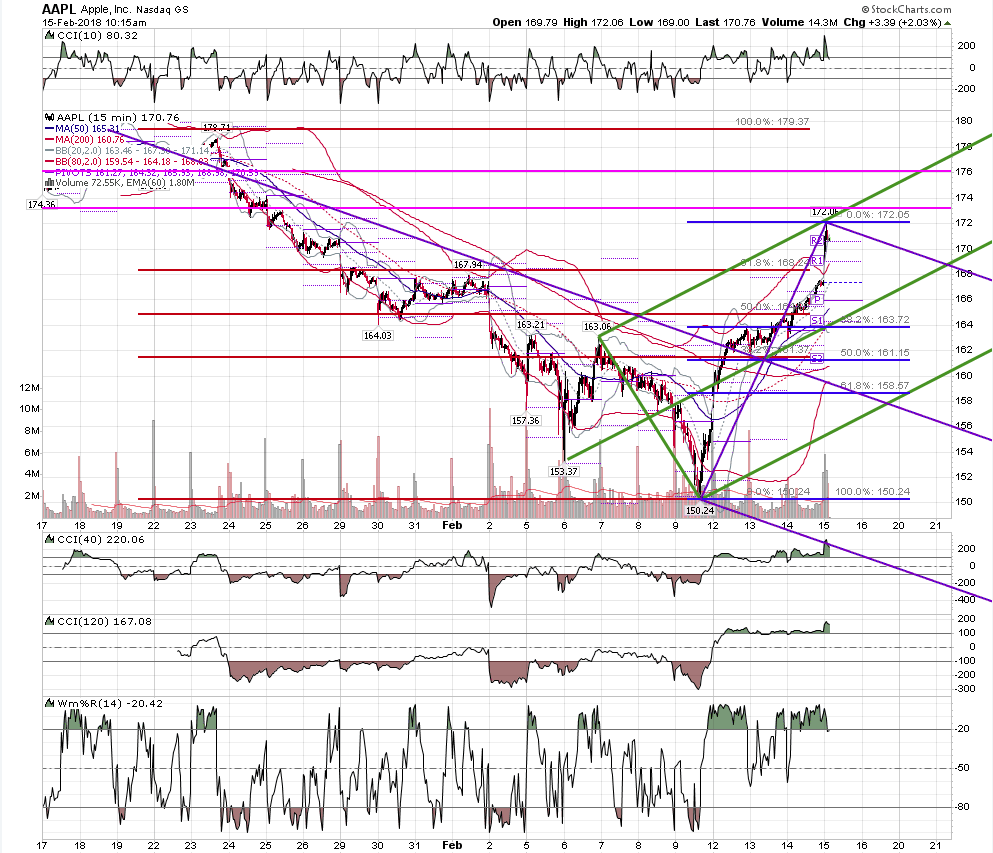
One thing to learn, is not to put what could be the next set on too soon, as in aapl 15 above ;)
The area from 173.18 - 176.06 is the .786 - .886 retrace
The area from 173.18 - 176.06 is the .786 - .886 retrace
Originally posted by albert
I second that!
Al
Originally posted by Duane
Rat, great charts. please keep posting them. Learning a lot about forks. Thank you!
RA
rat89
Rep: 0
Posts: 7,015
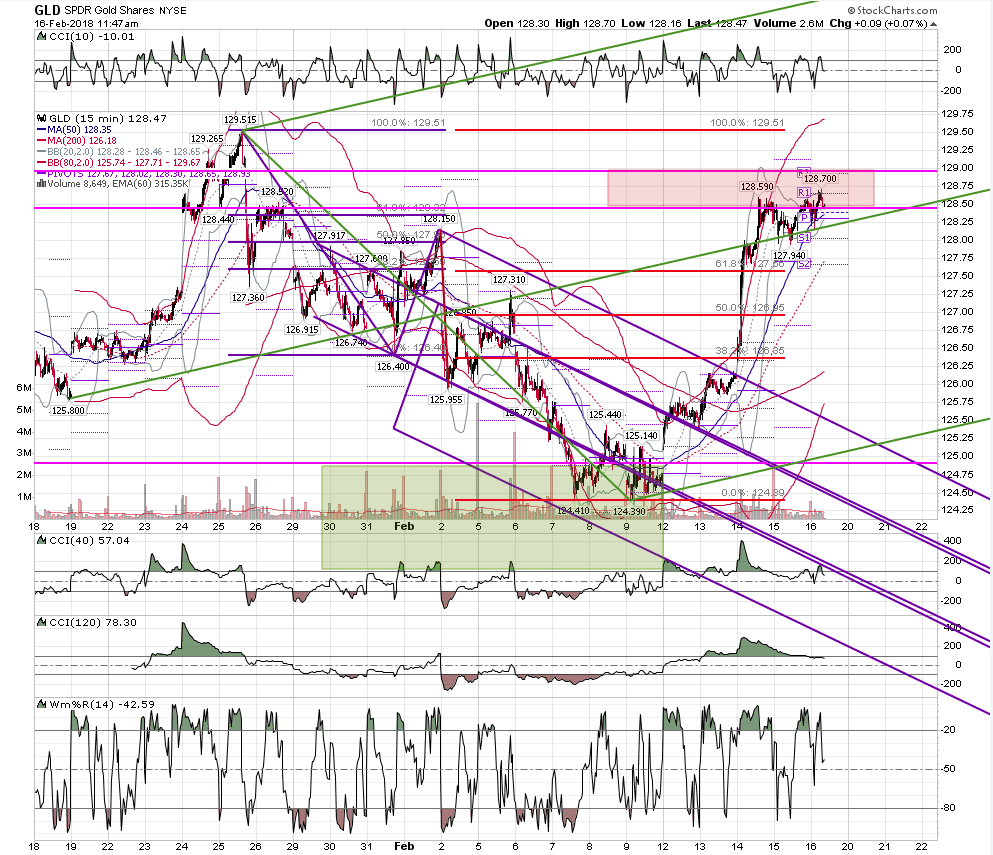
gld 15 - the green zone was the .50 - .382 fib area.....sure has come up a long way in a week. The red zone up here is the .786 - .886 retrace fib area. Likely in a wave major 3 up, so the question is, once this minor 1 ends, how deep will minor 2 be?
Click image for original size