Starting it off.
Al
MA
MarcinO
Rep: 67
Posts: 5,506
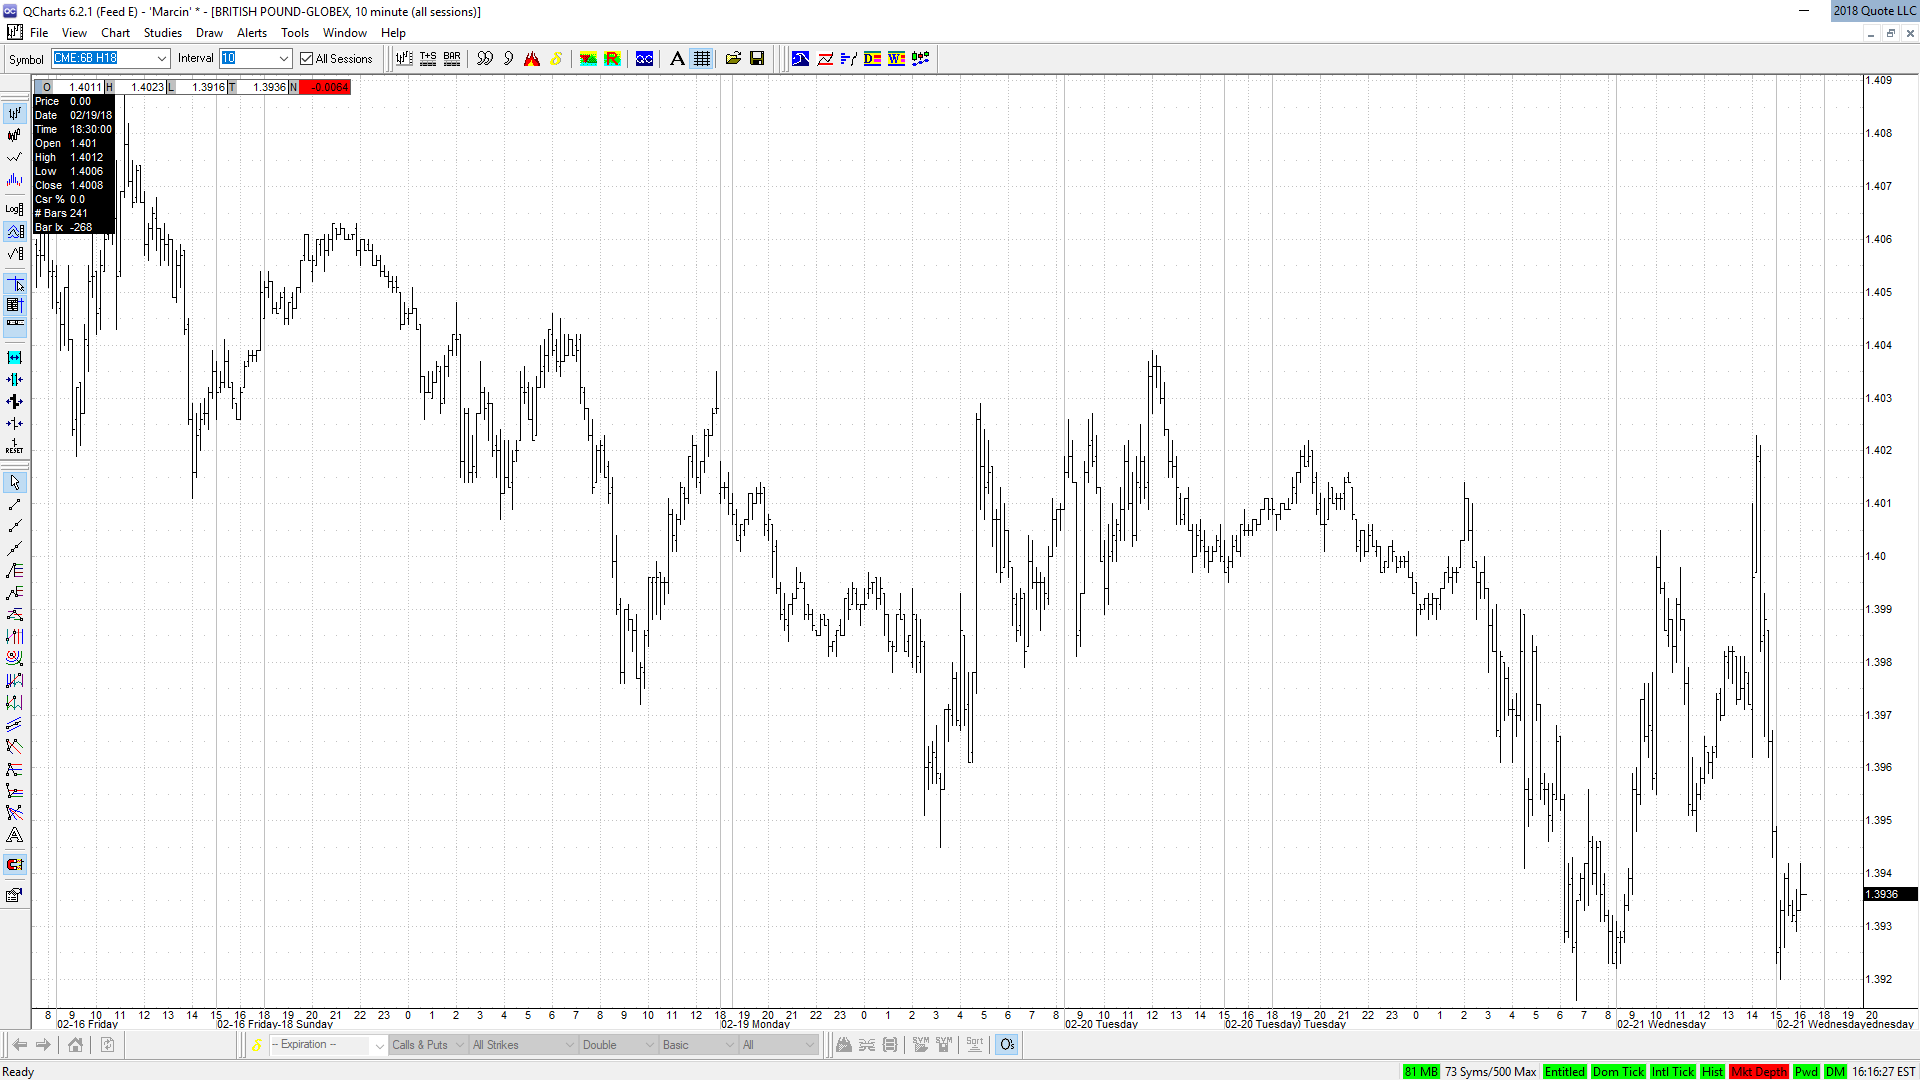
This is what I mean... Being long Cable (6B H18) here might seem crazy, but with all that mess it has been doing recently I wouldn't be surpriced if it breaks 20 pips above today's HOD and then start another leg down.
Originally posted by MarcinO
Not placing any charts for Cable for a while.
It switched to deep overlap mode again is pretty nasty to trade.
Click image for original size
AL
albert
Rep: 99
Posts: 3,094
Duane, Marcin, rat,
Great charts and Awesome work.
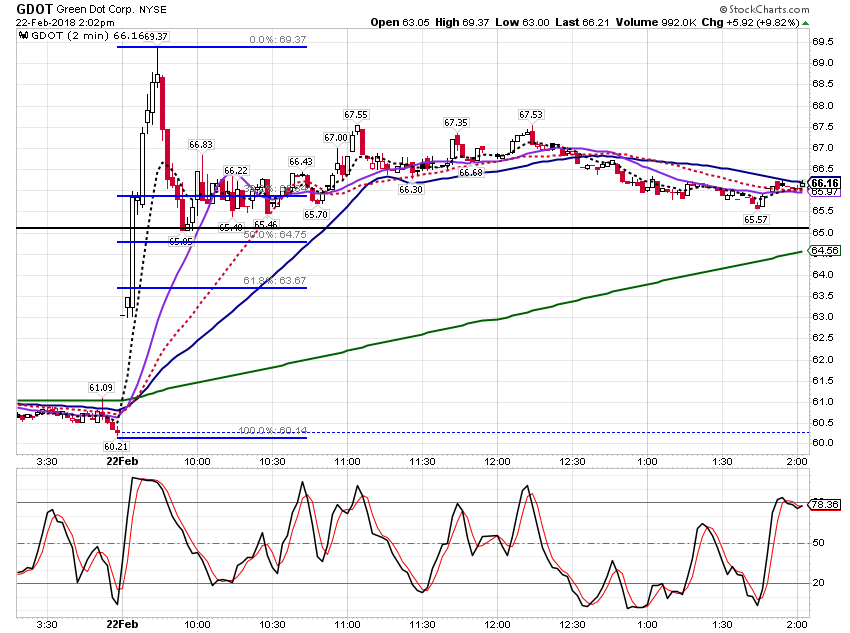
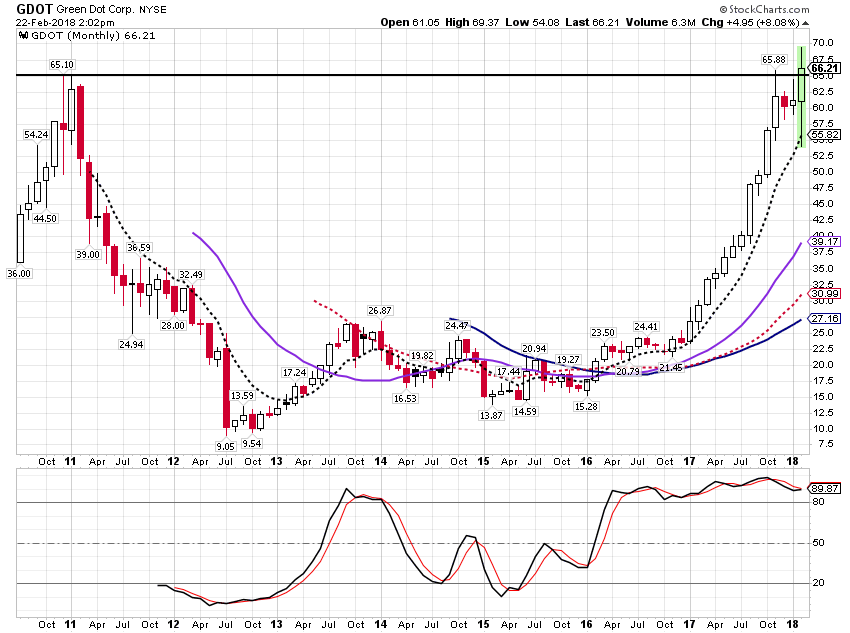
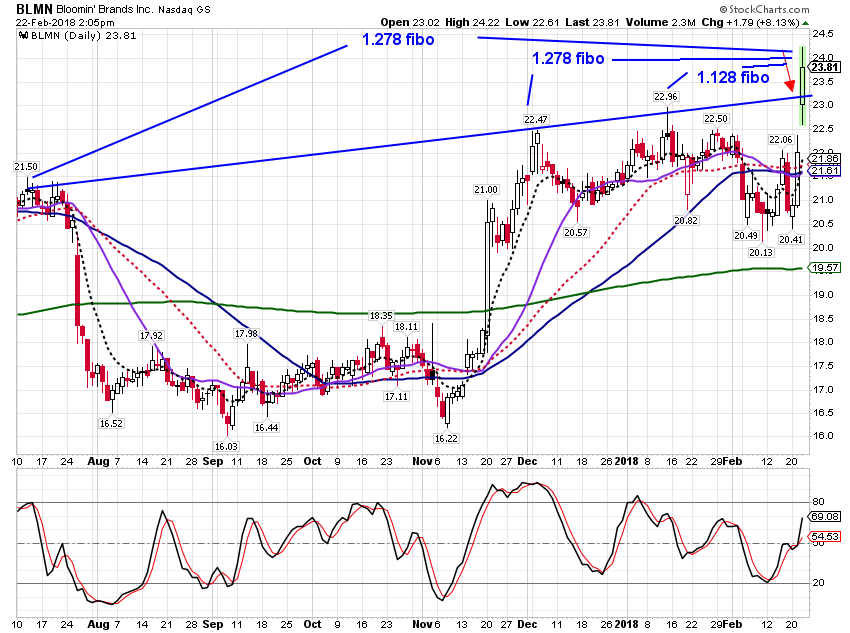
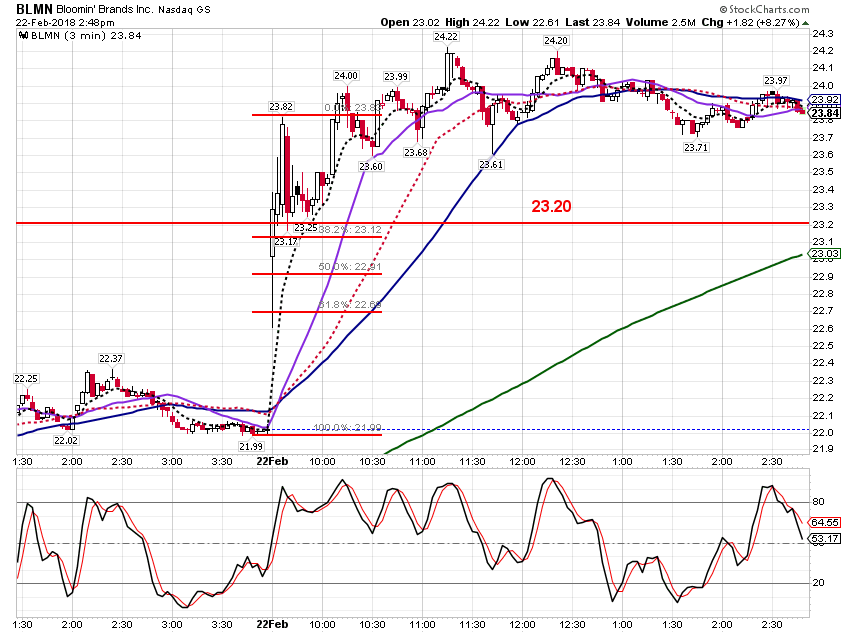
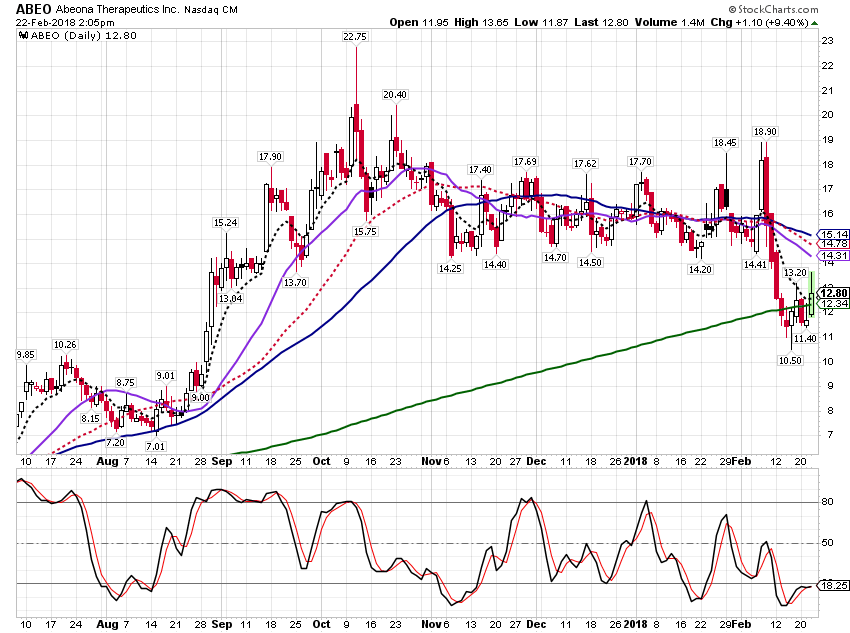
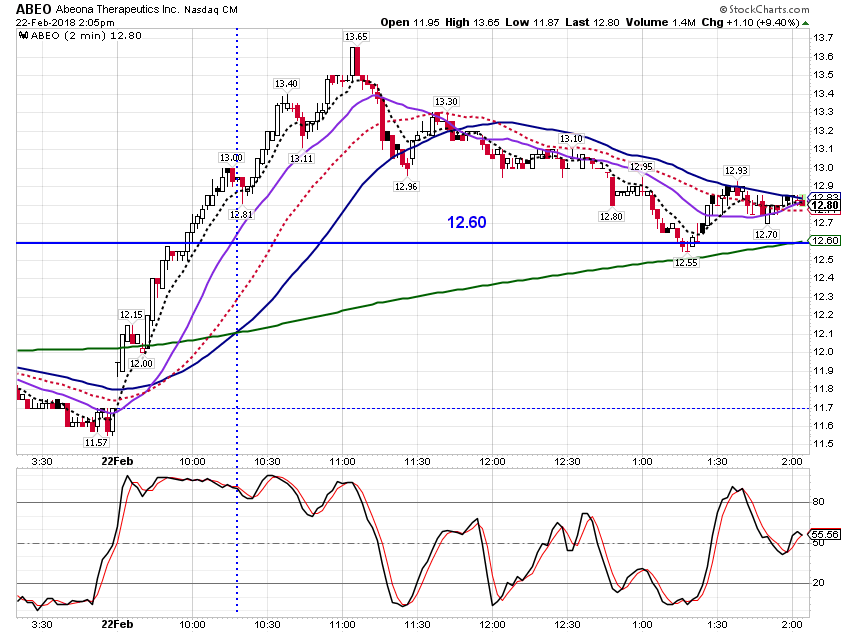
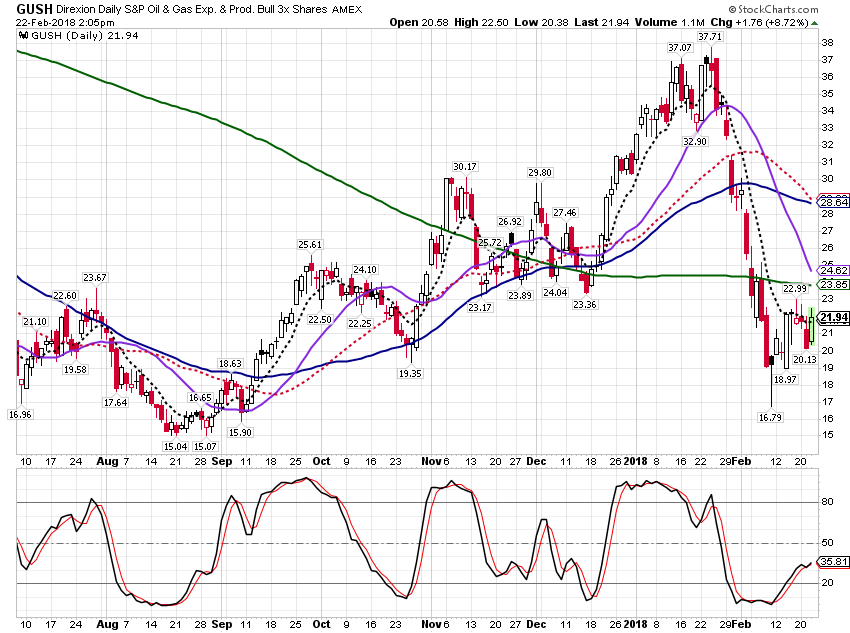
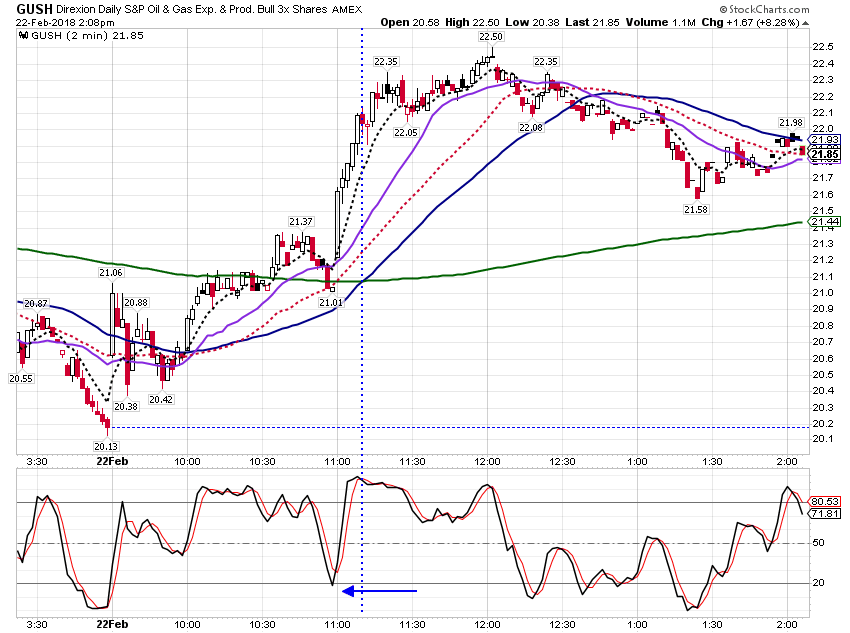
On the other hand, my scalping paper trading, is not so great today. I lost on long GDOT, chasing it, and it turned around very fast and down it went. DOH. Apparently price had just broken a seven year hi, which I did not do the work to research. Ouch. However I did a little better on BLMN, long paper trading. The fibo numbers I wrote on the daily chart (red arrow) are measured from a virtual point where today's price action crossed the Trendline (red arrow). I like ABEO and went long, but lost money. 12.60 is where the Daily price action met the Daily 8ema. I went Long GUSH after an EIA Petroleum Report, but lacked the patience to stay in on a pullback, and lost some money.
Click image for original size
Click image for original size
Click image for original size
Click image for original size
Click image for original size
Click image for original size
Click image for original size
Click image for original size
DU
Duane
Rep: 100
Posts: 1,095
Agreed ALbert, market wisdom there. Gained likely at quite a price. Thanks Rat !
Originally posted by albert
rat,
Thanks for the sound advice!
Al
Originally posted by rat89
the brainiest people fail in the markets. In fact, people who are smart and have been successful at other things often fail the most miserably. The markets teach humility because they don't know you're alive, or care what you think, or why. You don't have to figure out the why; that is the trap of the talking heads and the economists who use news to explain price moves. Remember: geometry leads news. The setup is always in place when the 'news' hits. Ignore the news, and try to discern the geometry. And know your timeframe. All you need to be successful is to figure out when a setup is there, the likely probable move for the setup, manage your risk, and don't forget to exit when the setup has either a) played out to its target area, or b) run into a known setup against the trade.
Originally posted by albert
I KNOW that's right!!
Al
Originally posted by Duane
“The market does not beat them. They beat themselves, because though they have brains they cannot sit tight.”
Al
AL
albert
Rep: 99
Posts: 3,094
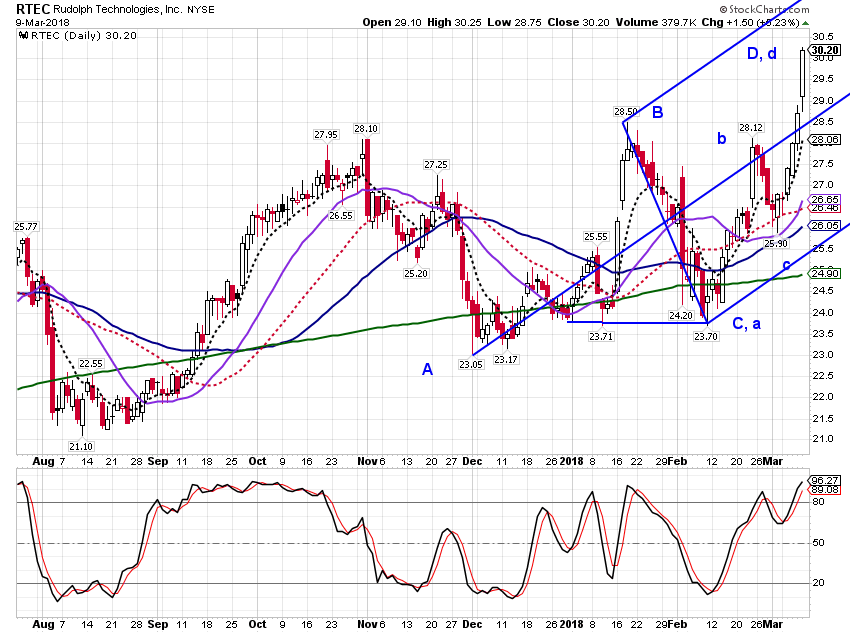
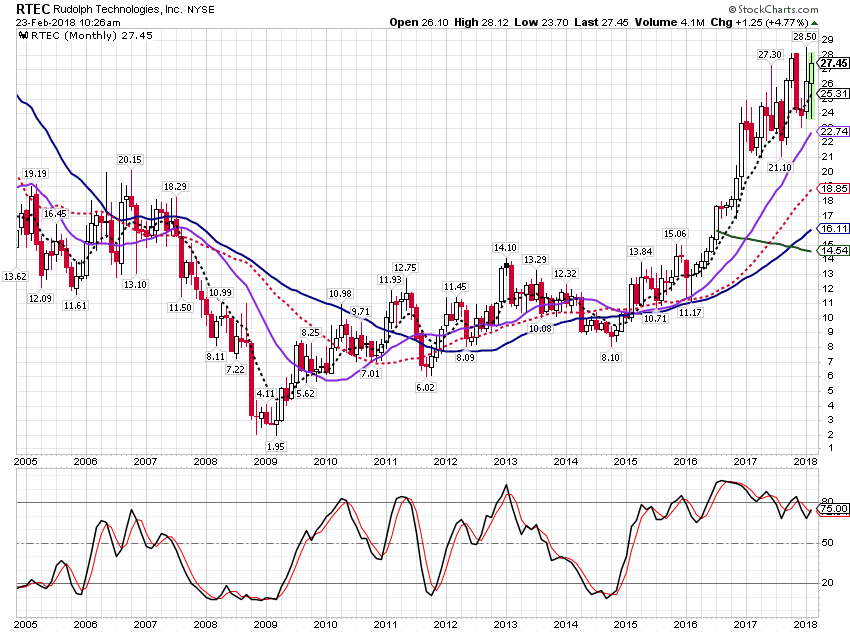
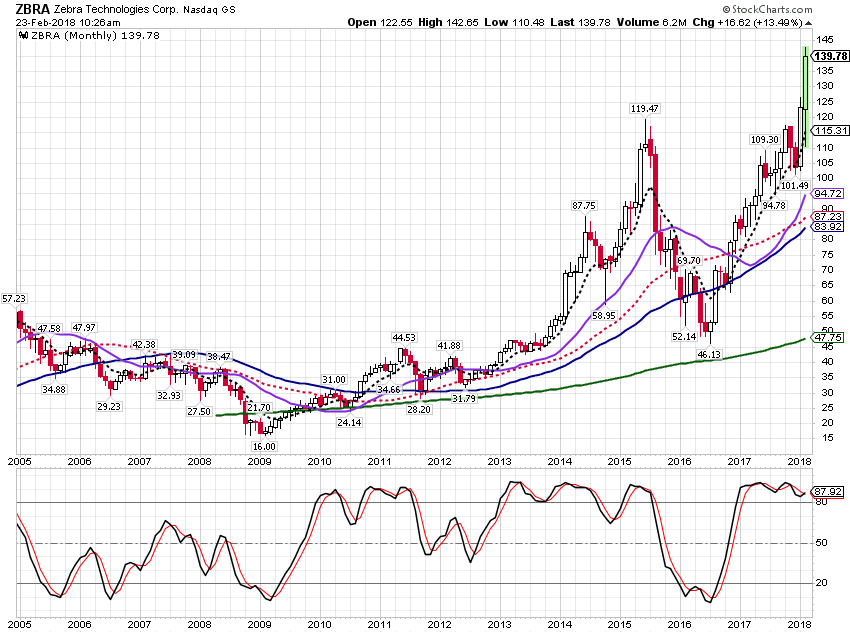
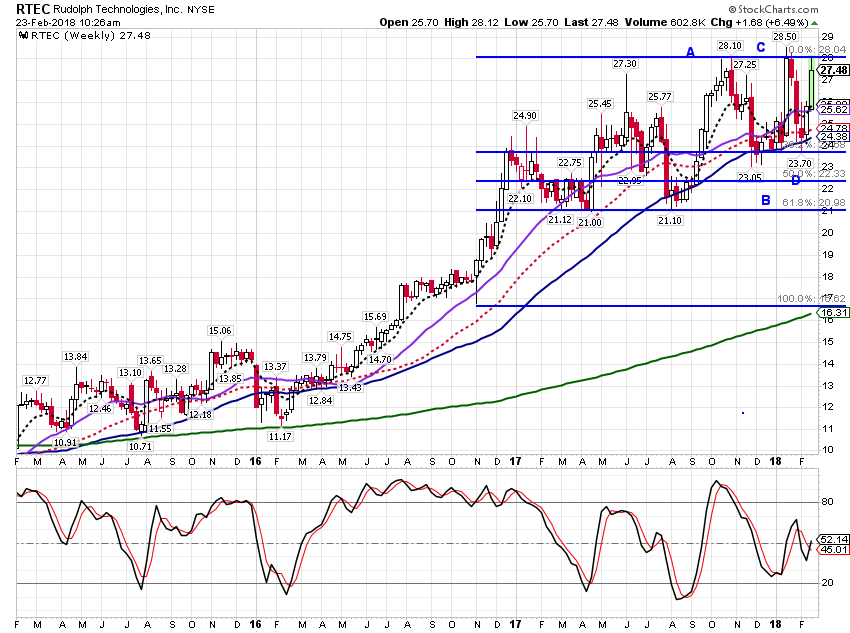
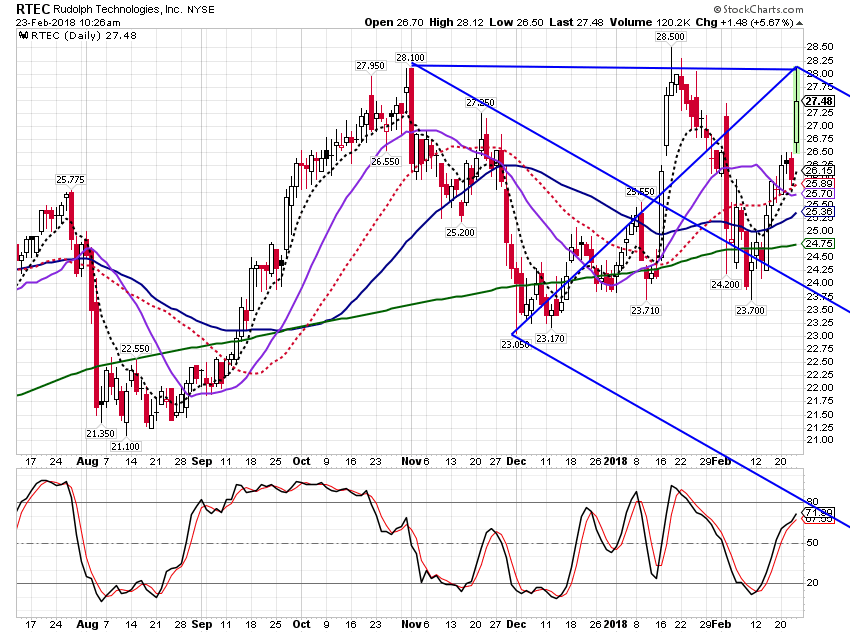
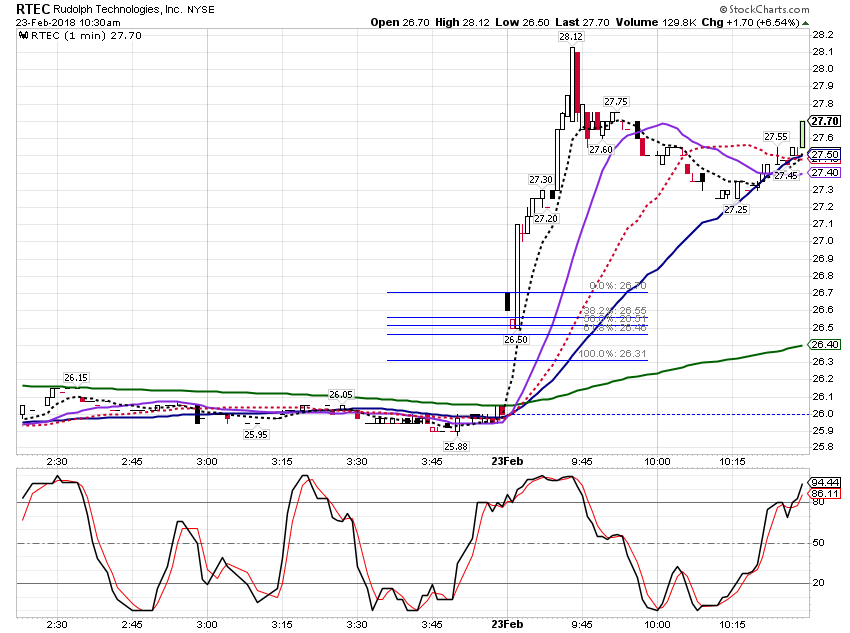
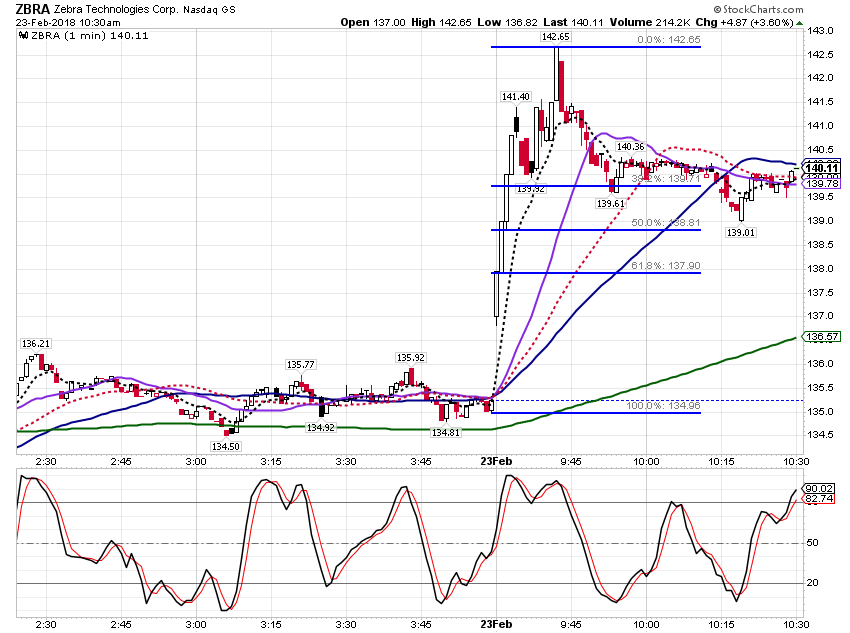
I am still paper trading and scalping. Thank goodness I did better today than I did yesterday! Squeeked out a bit on RTEC and ZBRA. RTEC and ZBRA look to be moving to 10-plus year high areas. RTEC weekly formed a Kane TD completing at 0.382 fibo. RTEC Daily price reversed in 0.886 fibo/Trendline area. ZTEC moved up nicely.
Good Trading to y'all.
Al :--)
Good Trading to y'all.
Click image for original size
Click image for original size
Click image for original size
Click image for original size
Click image for original size
Click image for original size
Al :--)
RA
rat89
Rep: 0
Posts: 7,015
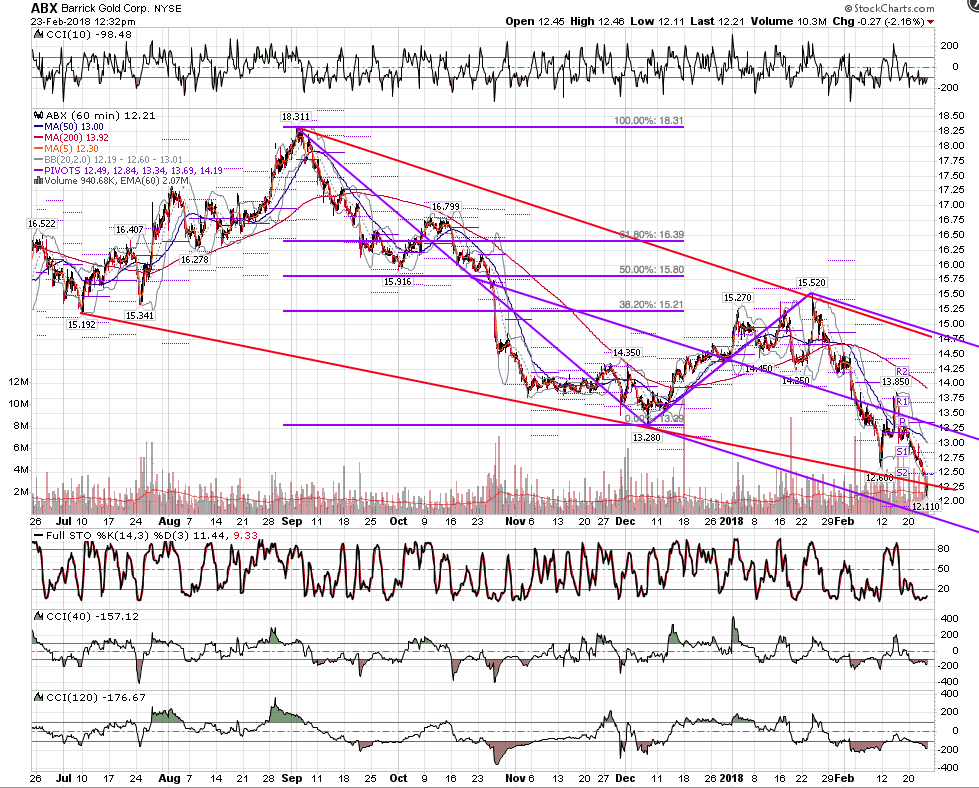
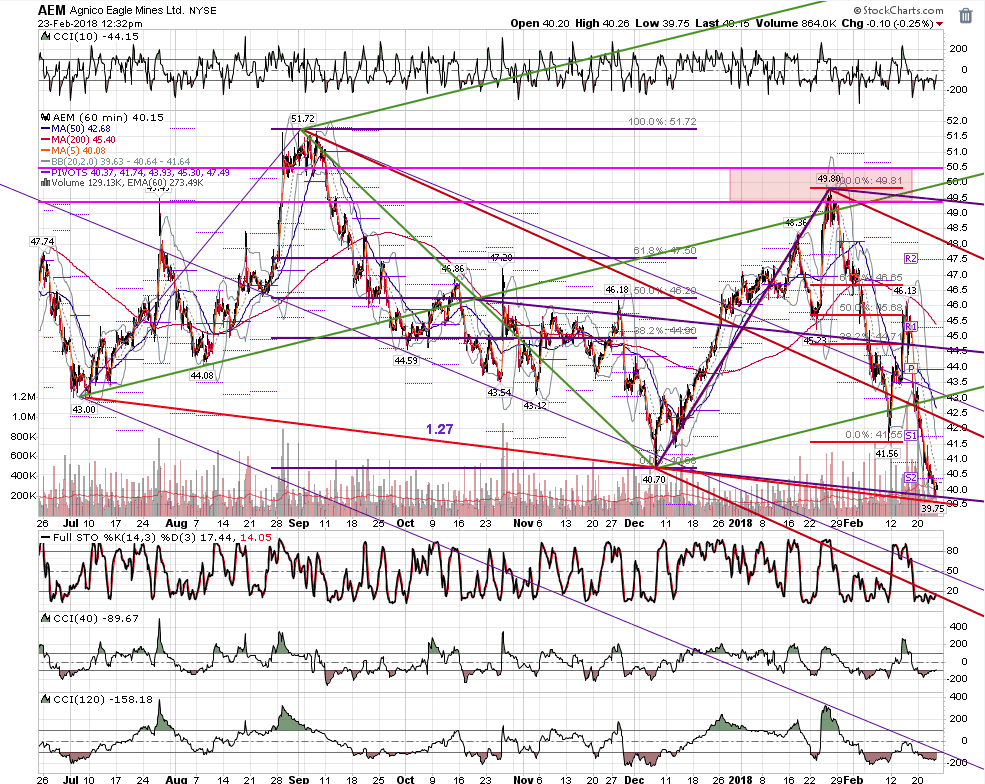
the laggards are setting up for a potential reversal here
Click image for original size
Click image for original size
AL
albert
Rep: 99
Posts: 3,094
Originally posted by albert
I am still paper trading and scalping. Thank goodness I did better today than I did yesterday! Squeeked out a bit on RTEC and ZBRA. RTEC and ZBRA look to be moving to 10-plus year high areas. RTEC weekly formed a Kane TD completing at 0.382 fibo. RTEC Daily price reversed in 0.886 fibo/Trendline area. ZTEC moved up nicely.
Good Trading to y'all.
Click image for original size
Click image for original size
Click image for original size
Click image for original size
Click image for original size
Click image for original size
Al :--)
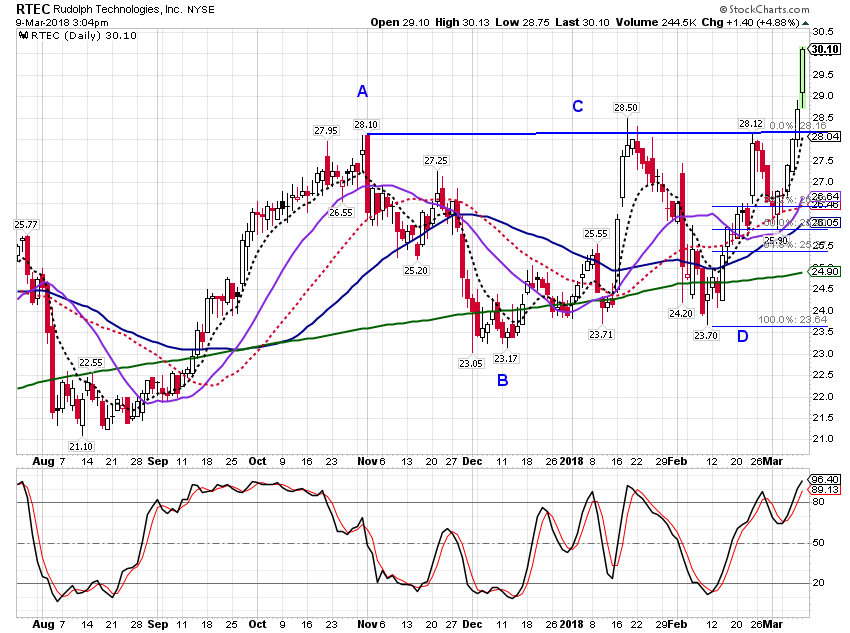
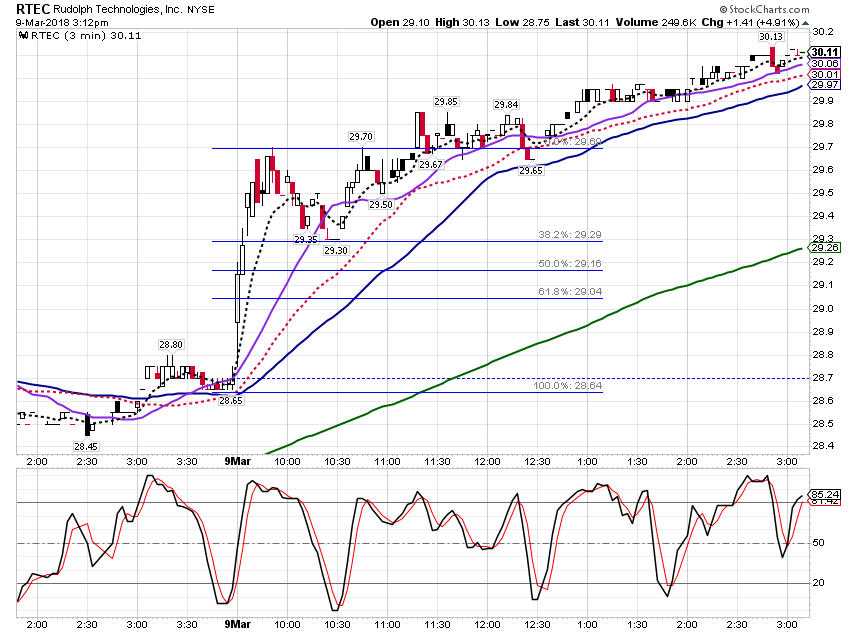
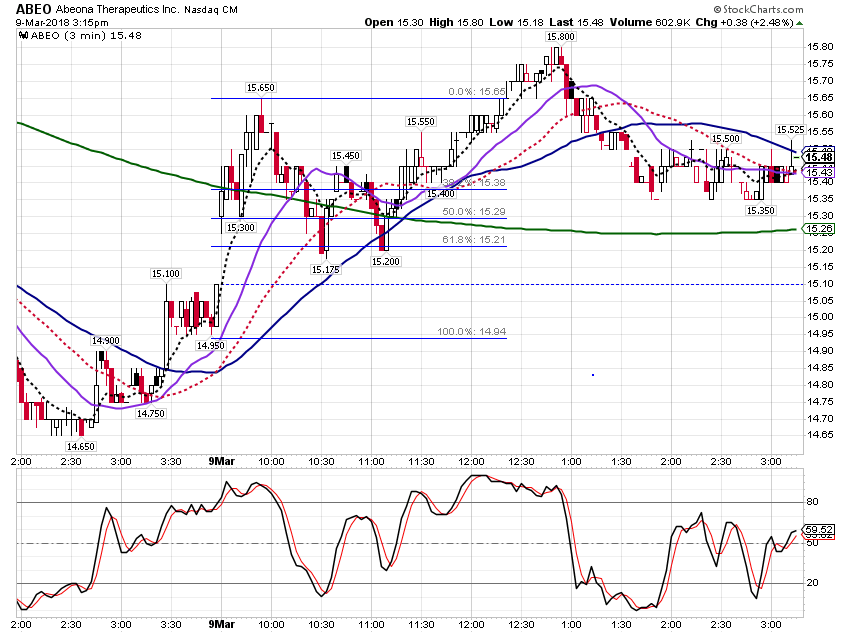
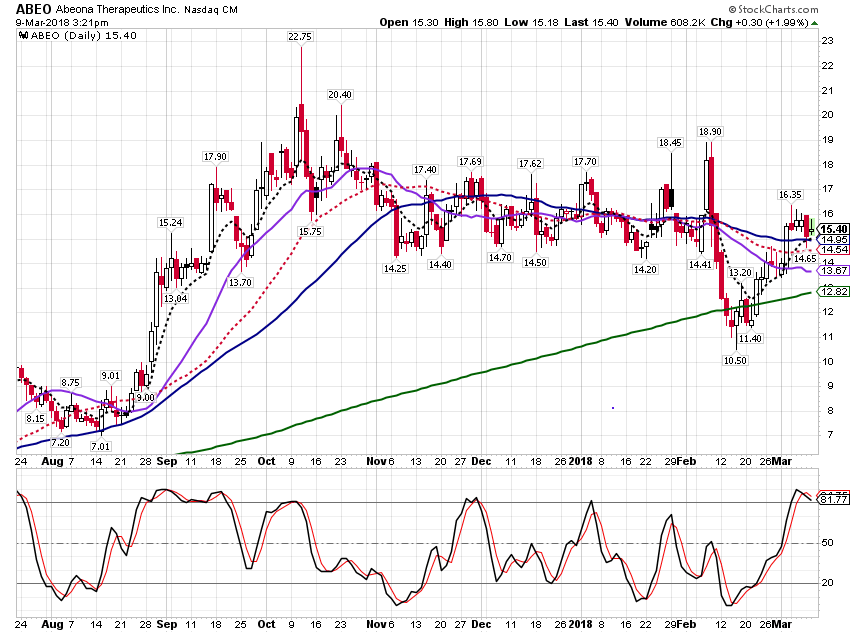
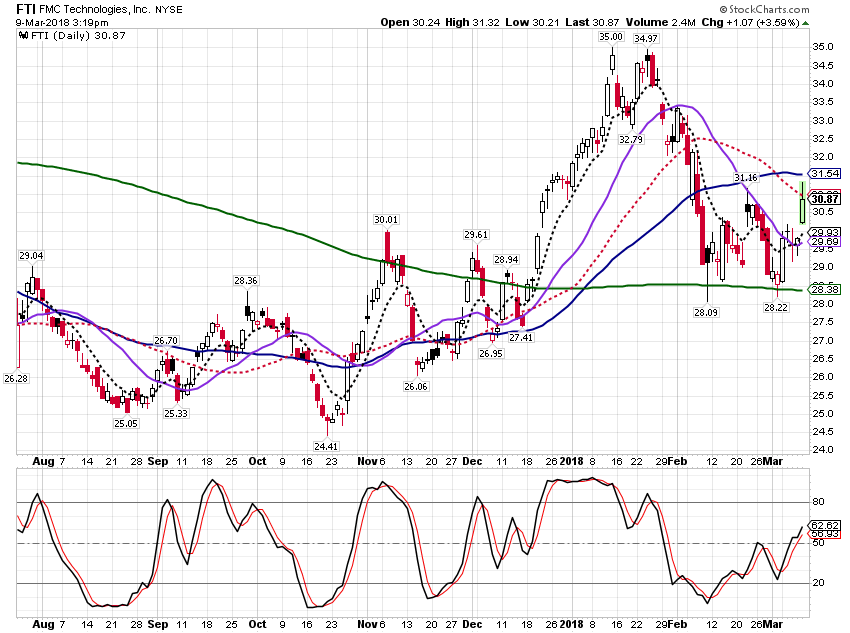
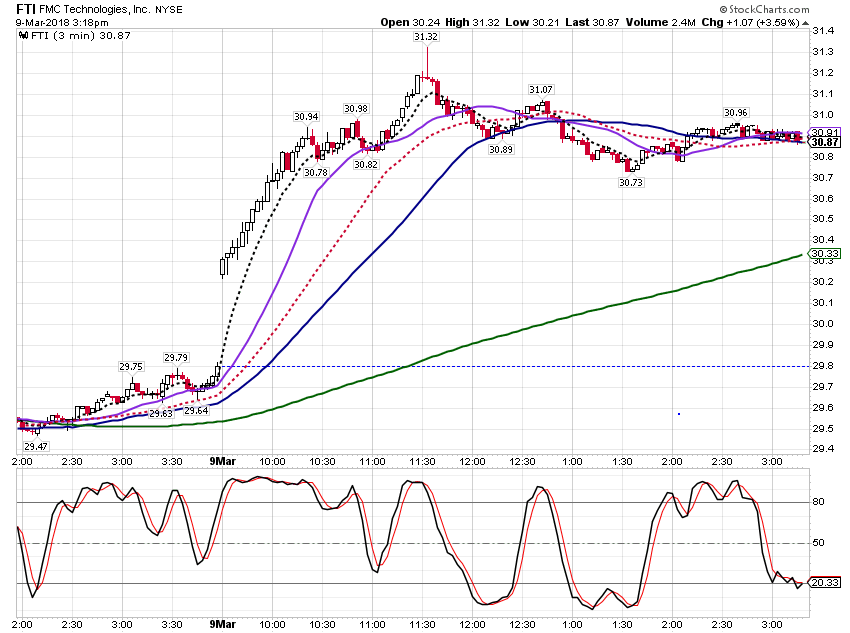
Update on RTEC. Paper trading. Made a bit on RTEC this morning. Wash on ABEO and a bit on FTI.
Click image for original size
Click image for original size
Click image for original size
Click image for original size
Click image for original size
Click image for original size
Al