Starting it off.
Al
RA
rat89
Rep: 0
Posts: 7,015
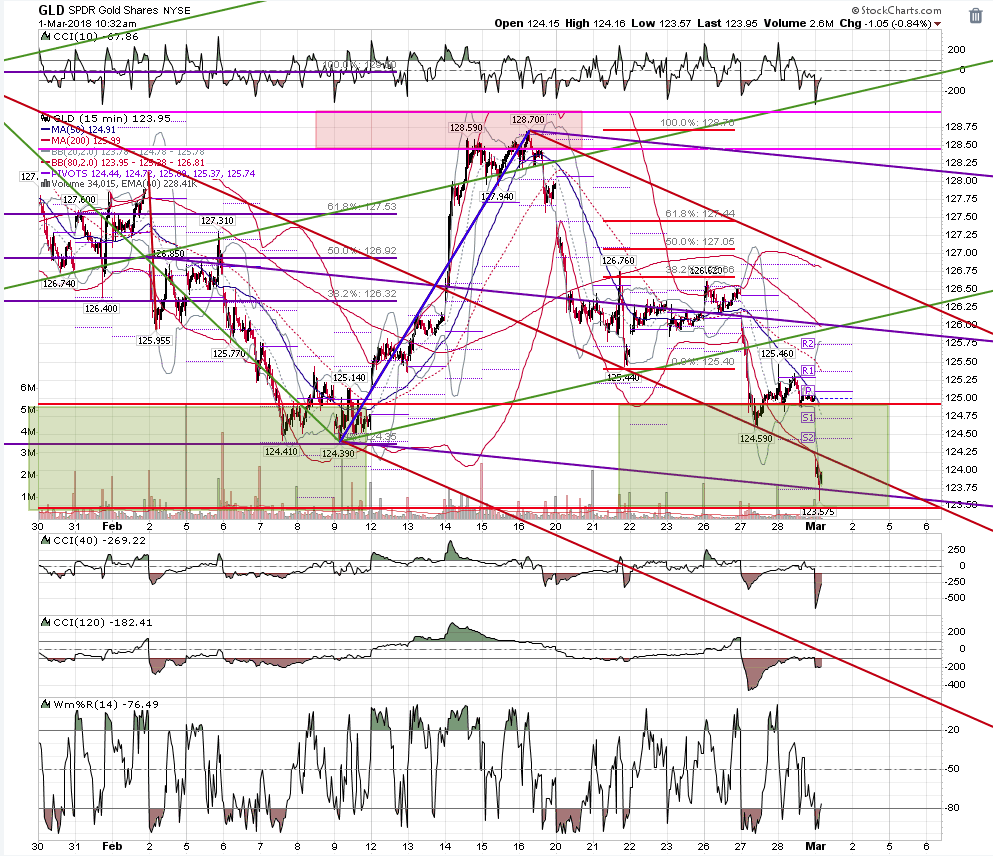
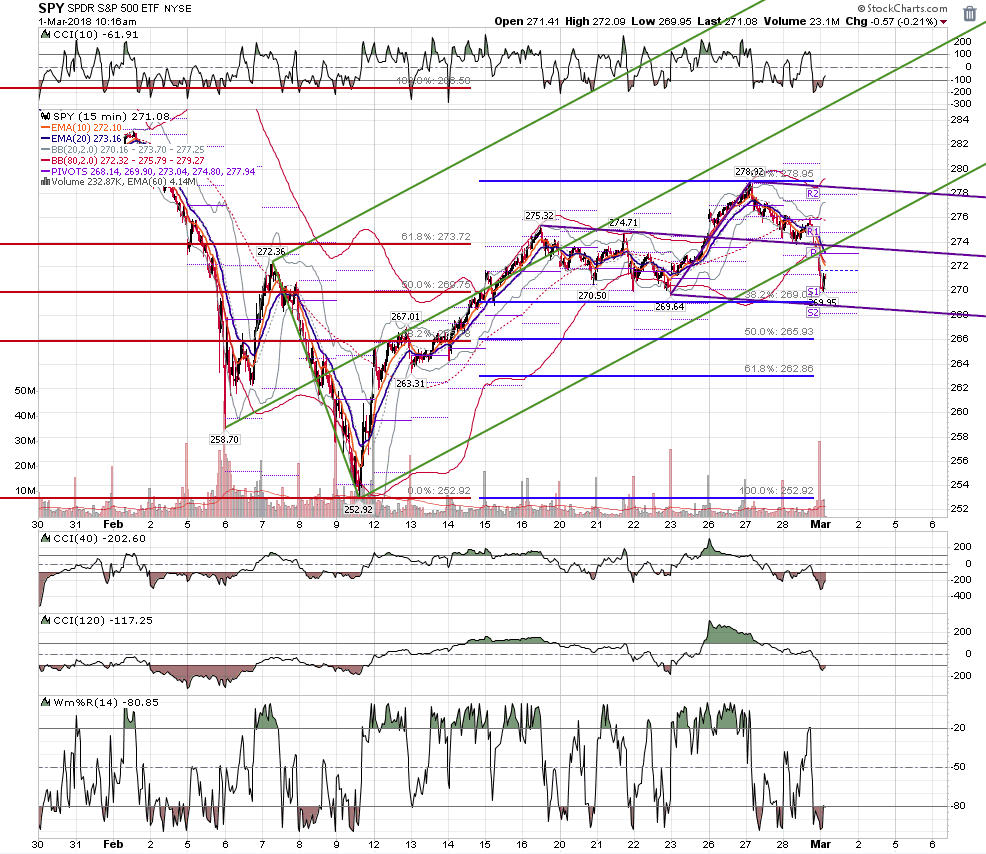
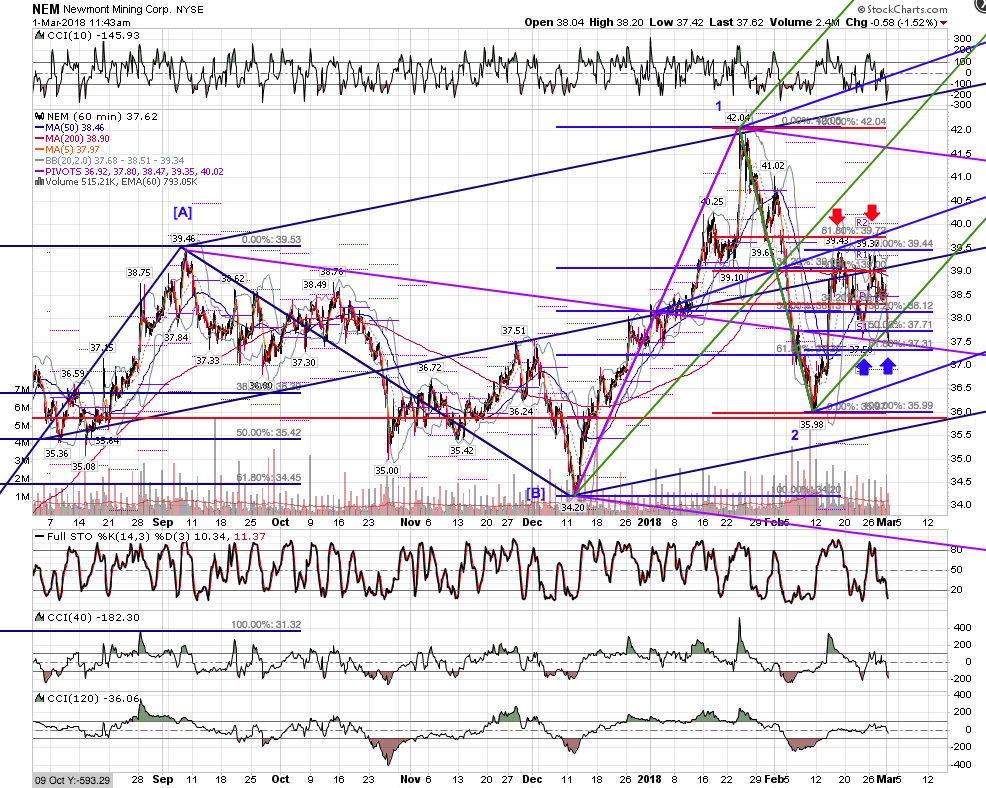
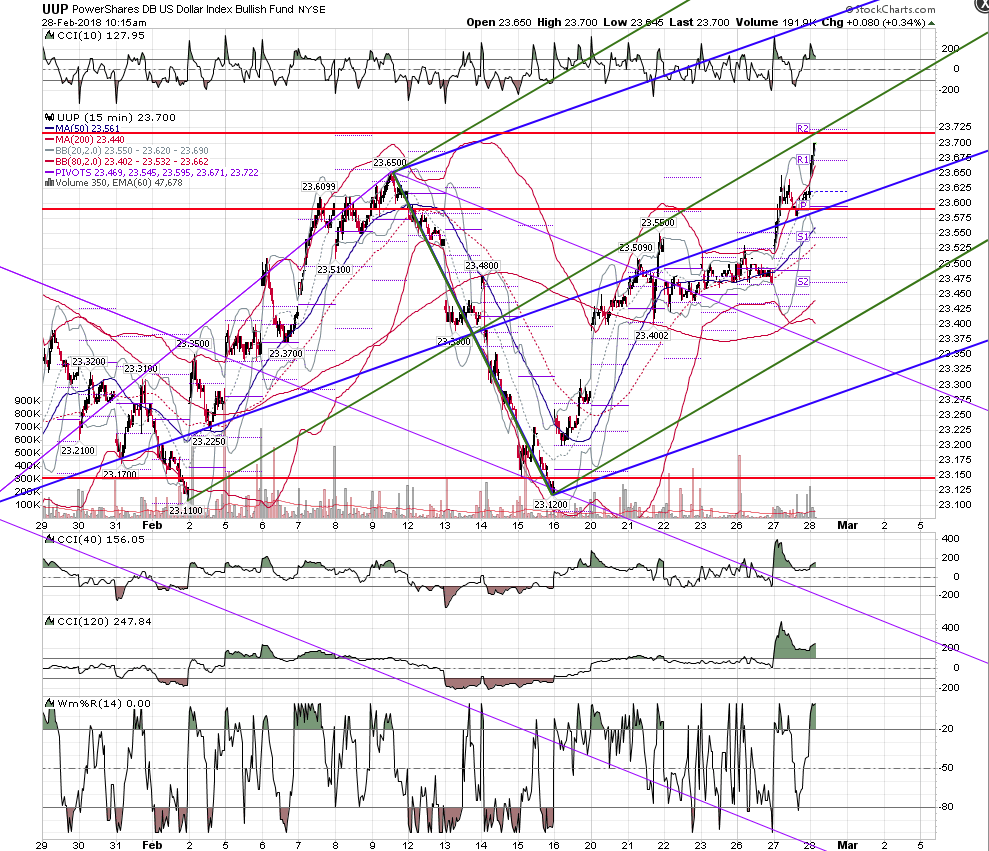
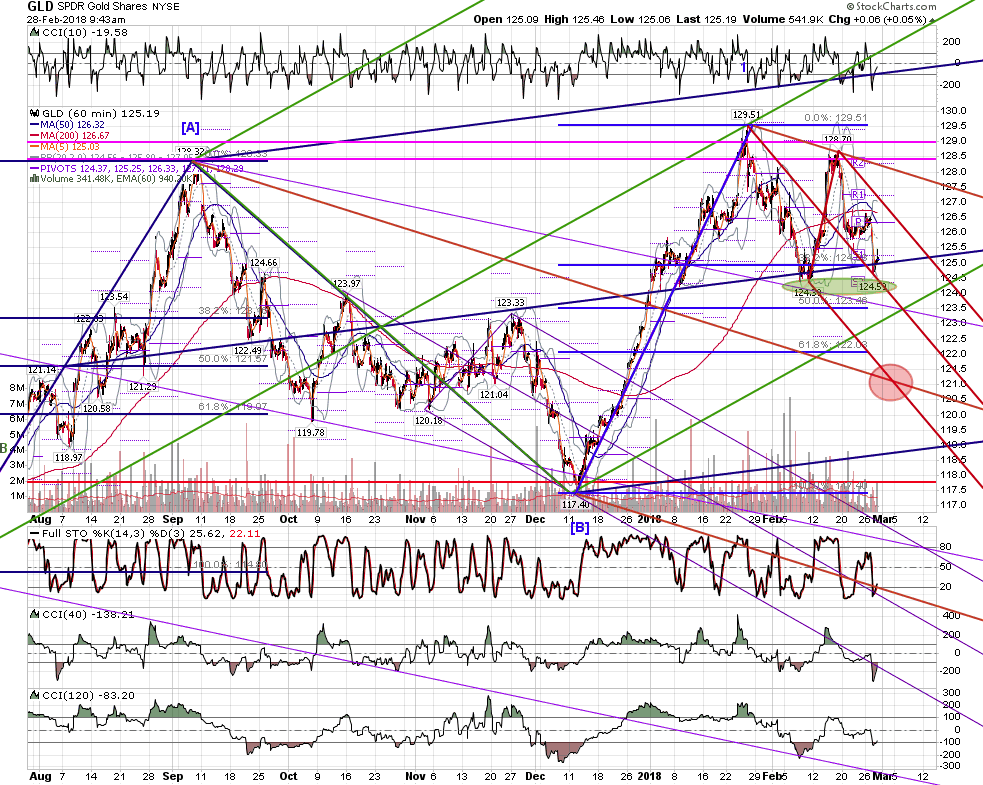
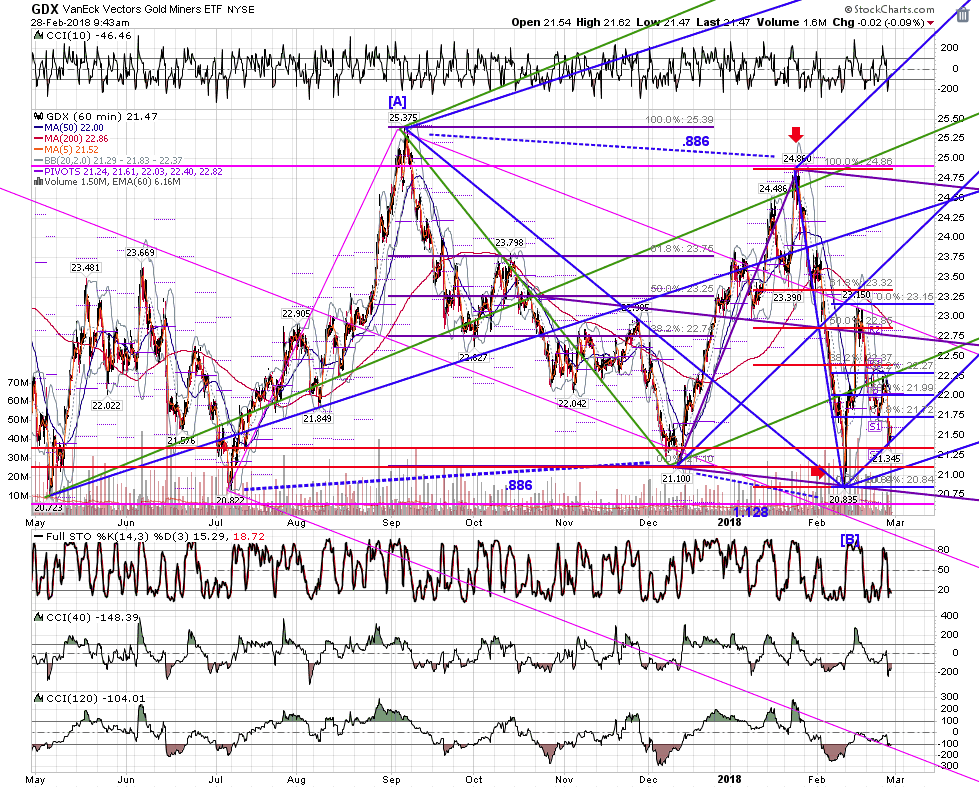
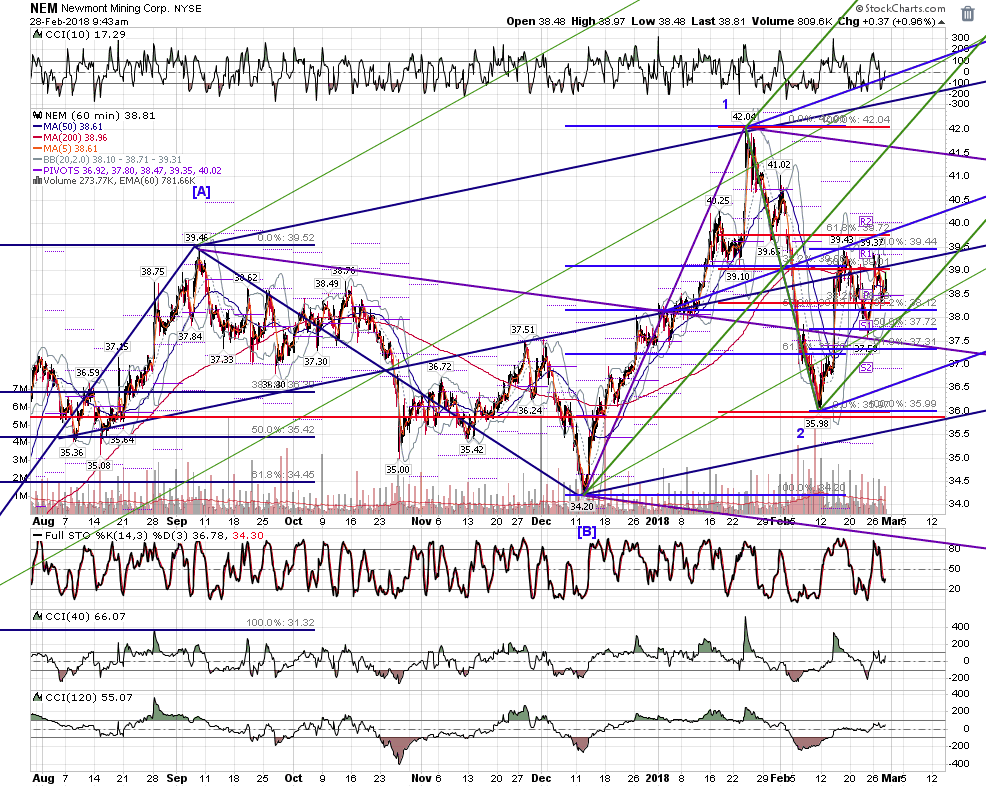
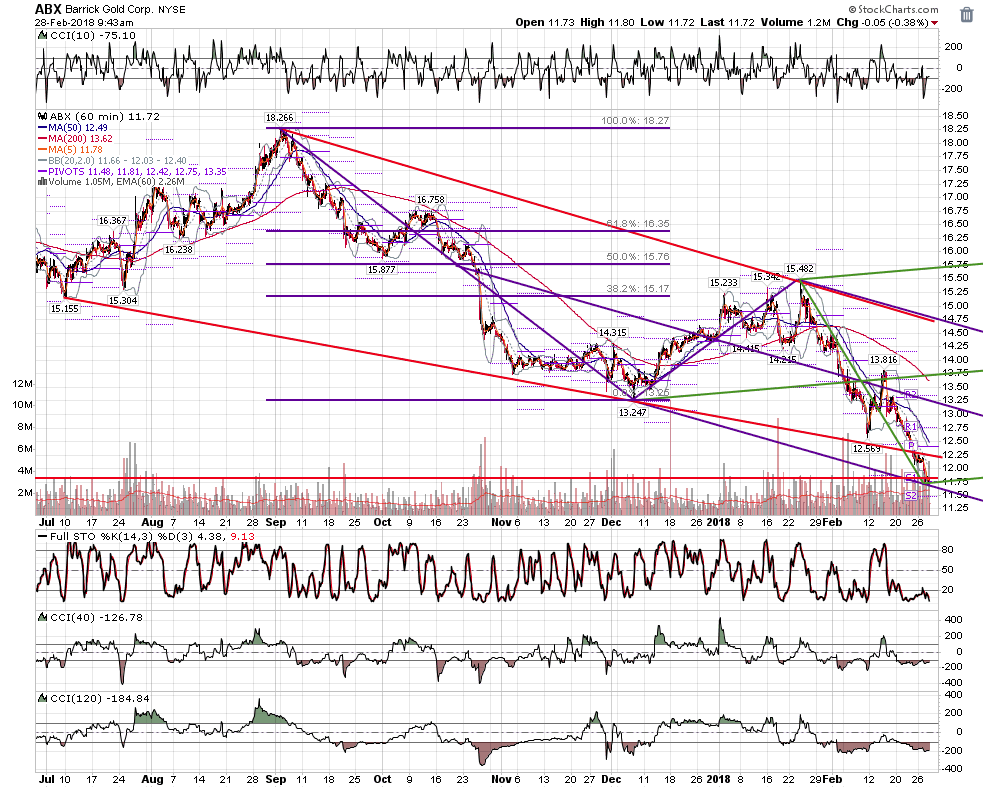
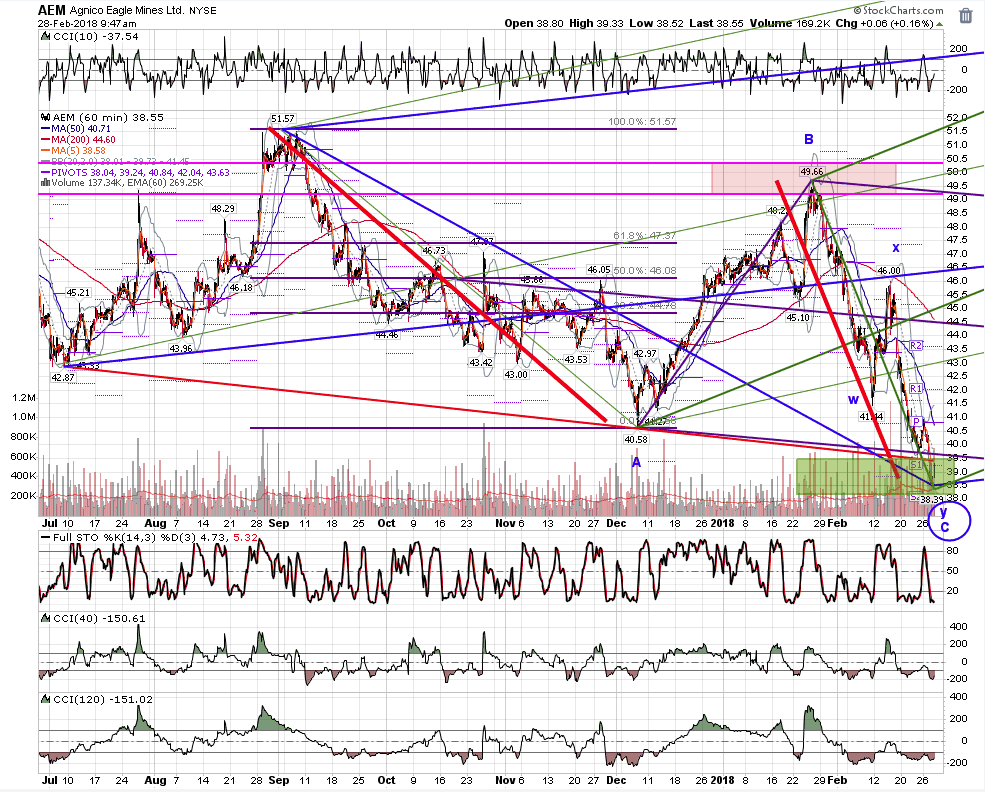
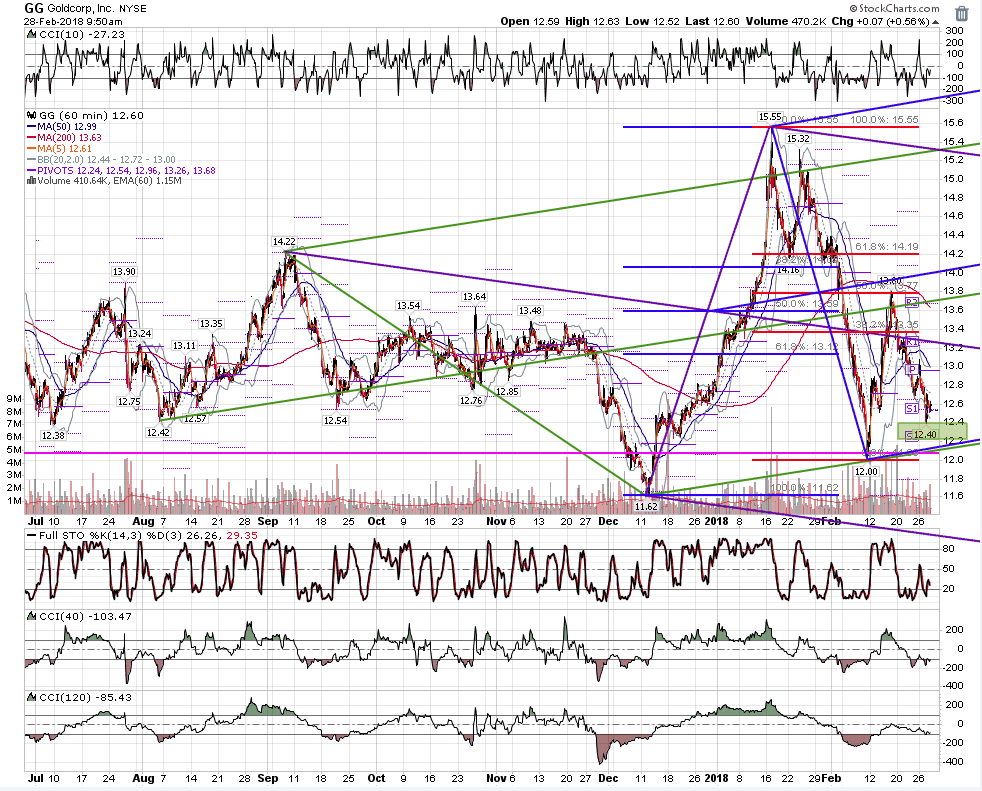
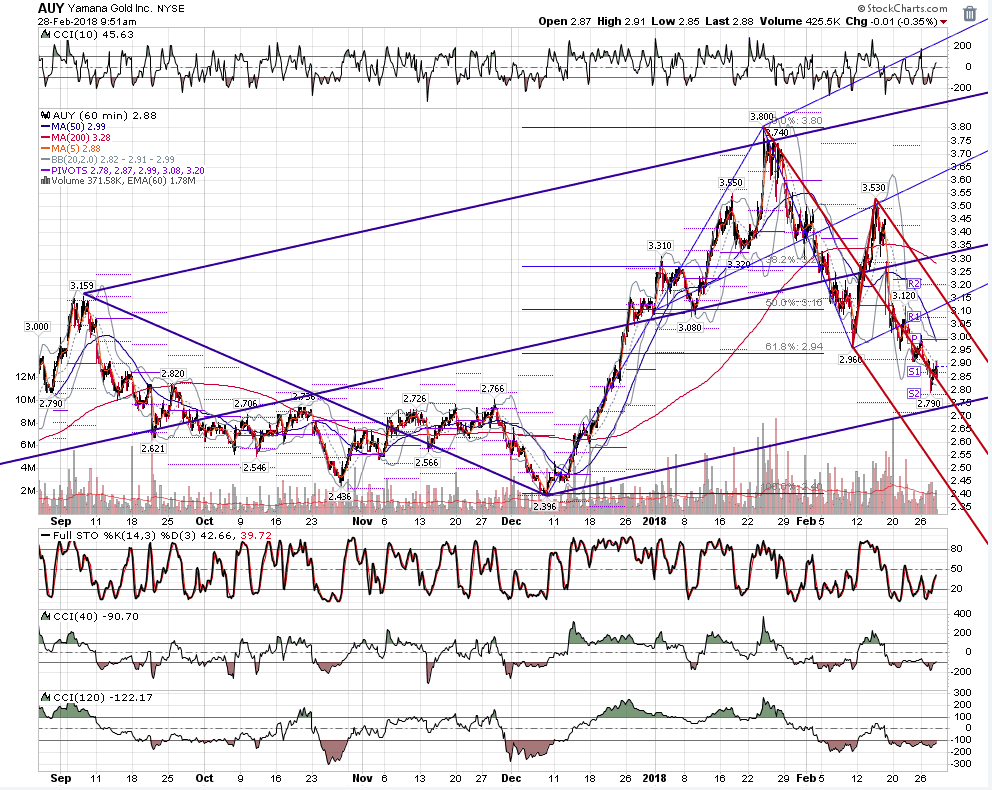
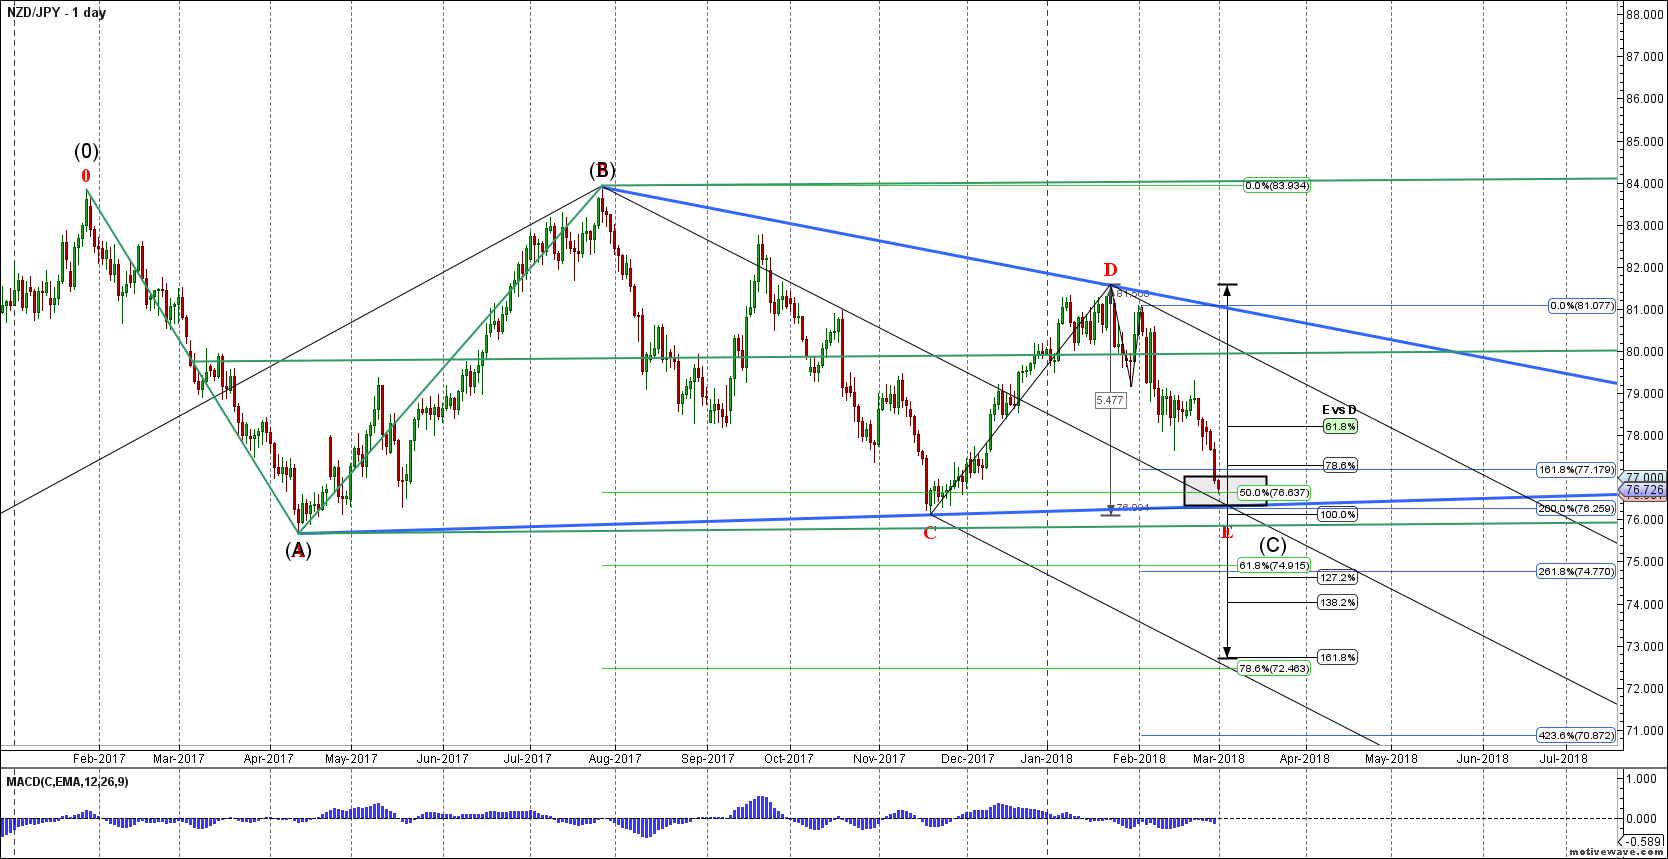
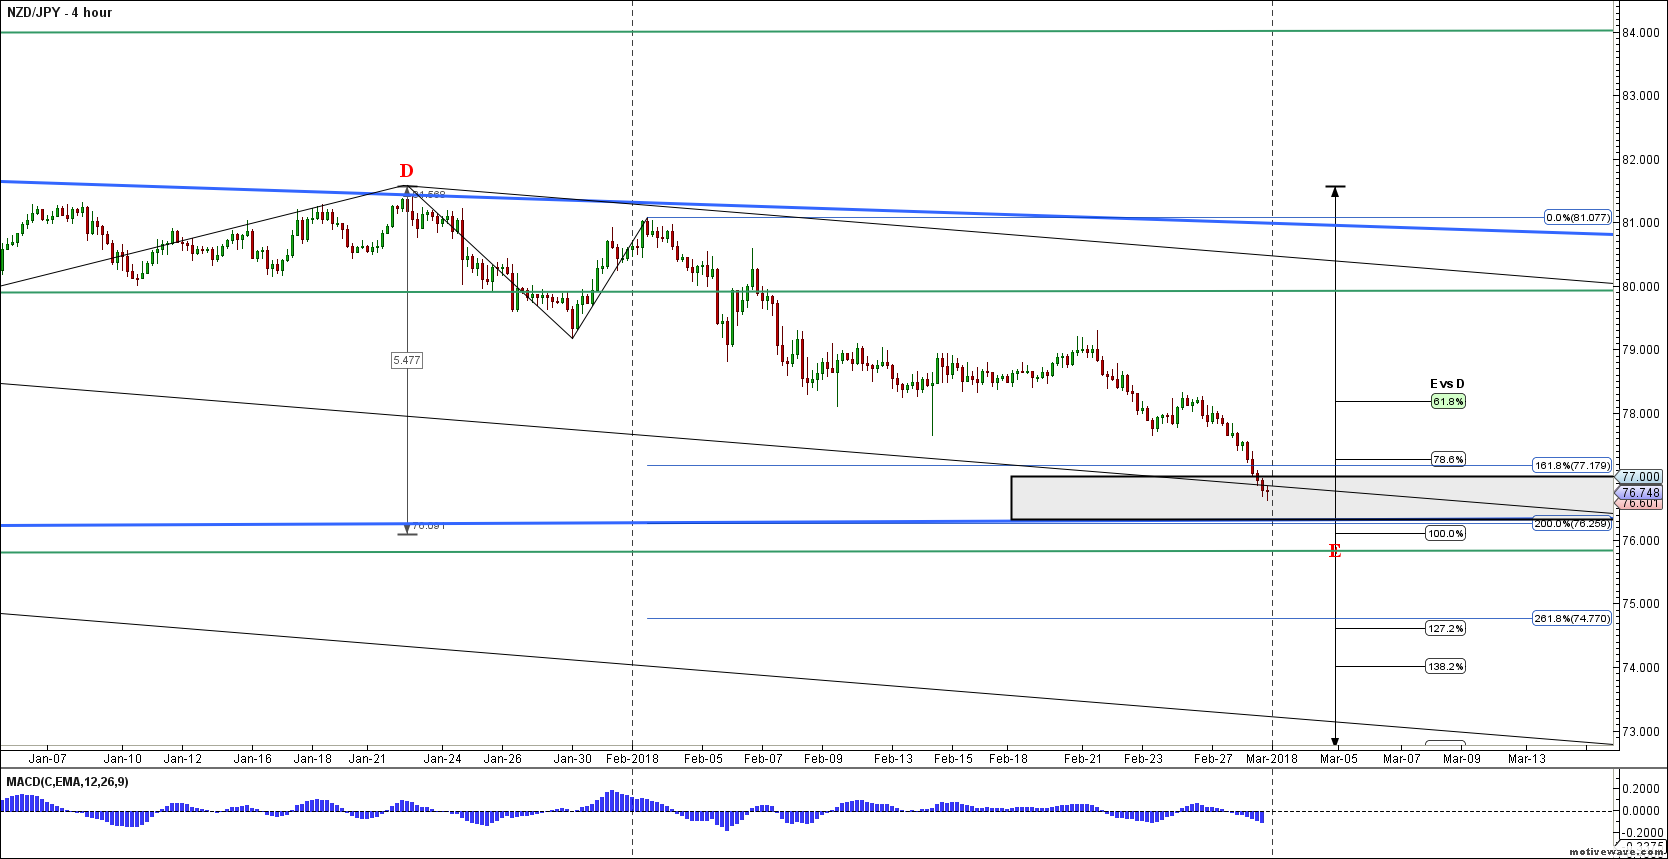
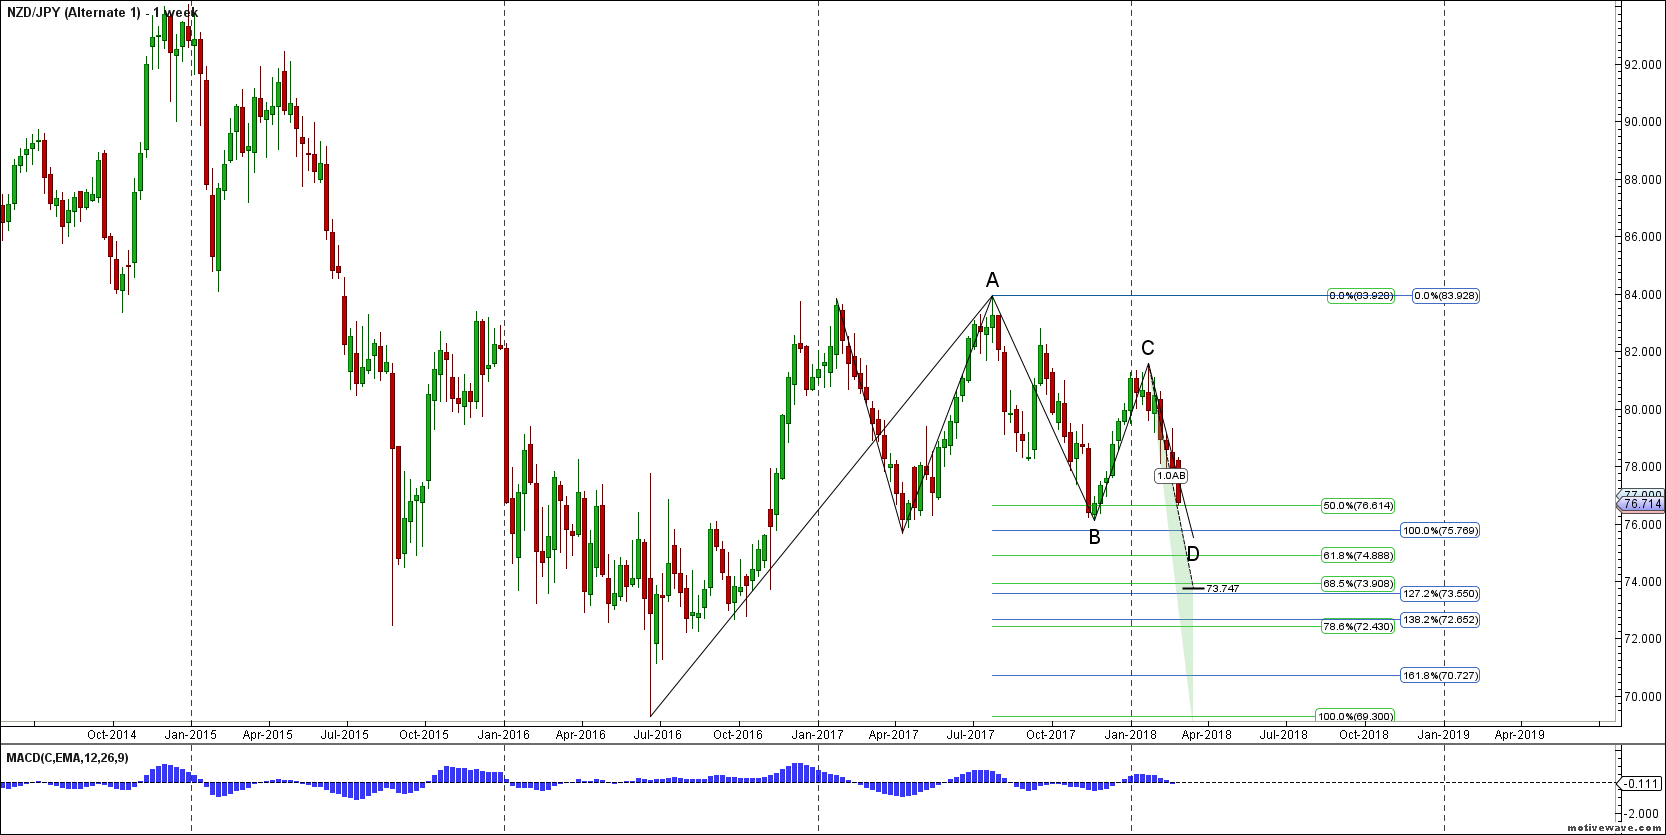
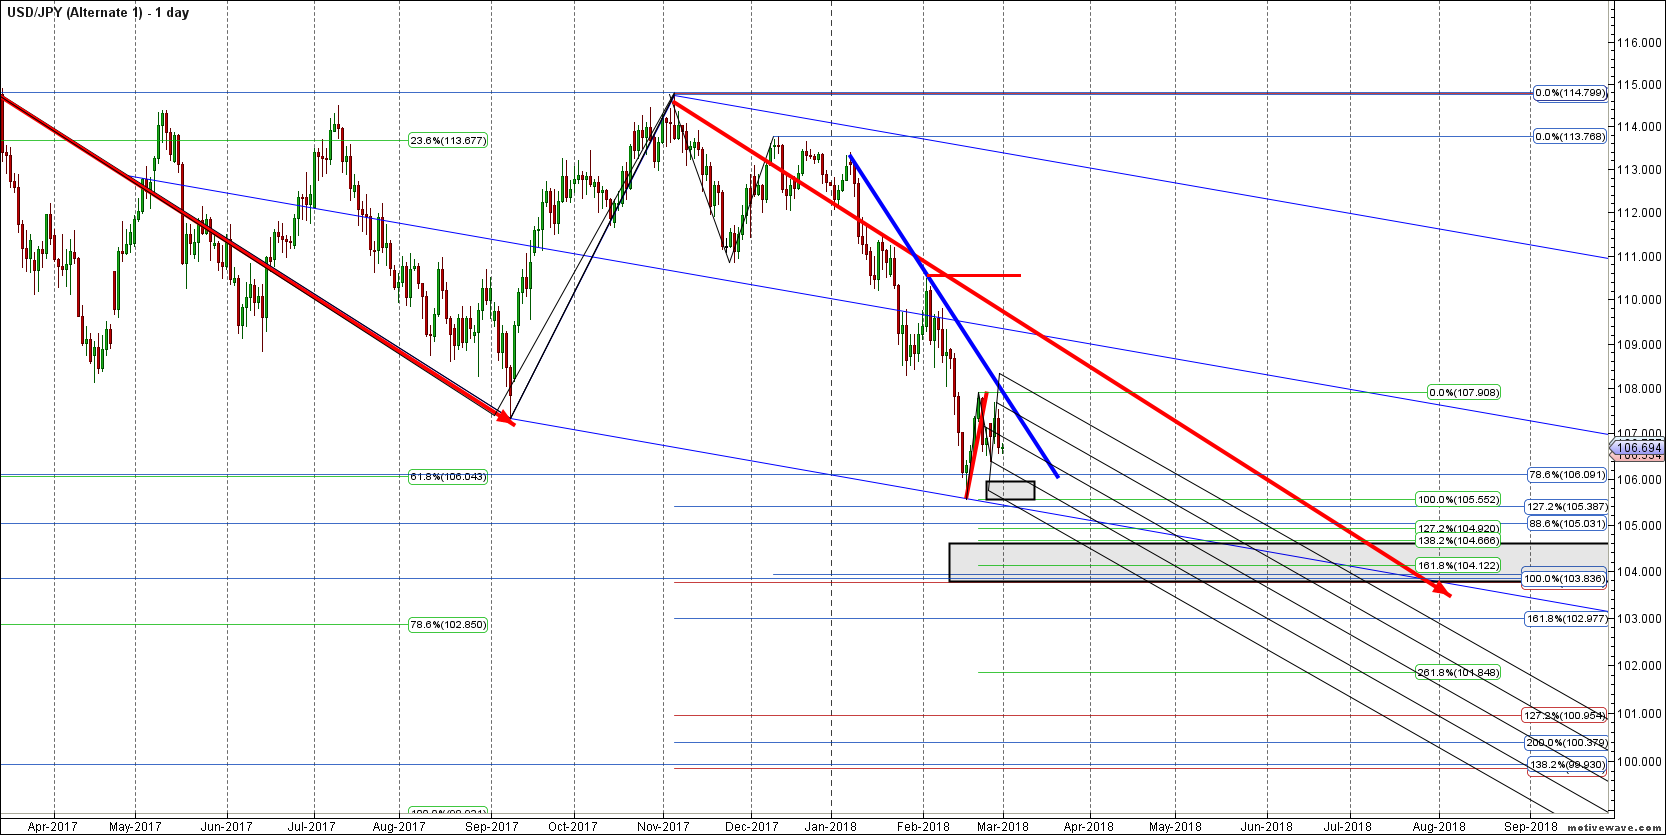
setting up for a likely reversal....gld 124.88 continues to be key
Click image for original size
Click image for original size
Click image for original size
Click image for original size
Click image for original size
Click image for original size
Click image for original size
DU
Duane
Rep: 100
Posts: 1,095
You also AL nice charts! How do you use the Moving Averages?
Marcino, sad to hear that, I need your GBPUSD perspective. Handle you business.
Rat, your lines are crazy, do you ever use warning lines? I find them quite effective at times.
Charts !
Marcino, I still think we are going higher.
Obviously if .886 and the trend line do not hold, price could go much lower.
Next stop trend line
Marcino, sad to hear that, I need your GBPUSD perspective. Handle you business.
Rat, your lines are crazy, do you ever use warning lines? I find them quite effective at times.
Charts !
Marcino, I still think we are going higher.
Click image for original size
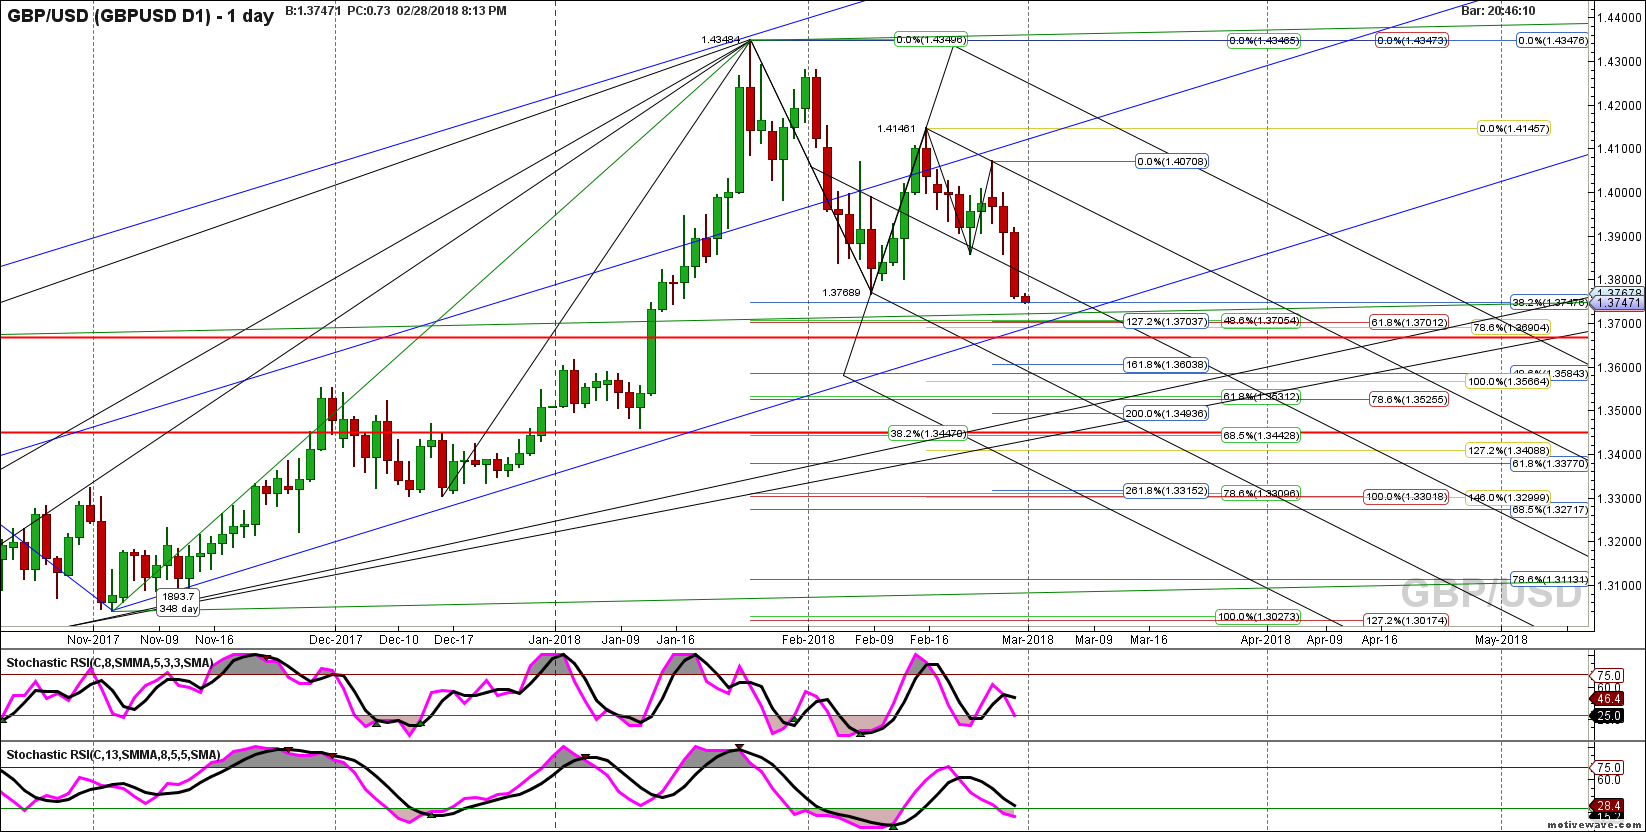
Obviously if .886 and the trend line do not hold, price could go much lower.
Click image for original size
Next stop trend line
Click image for original size
AL
albert
Rep: 99
Posts: 3,094
Duane - Super charts!
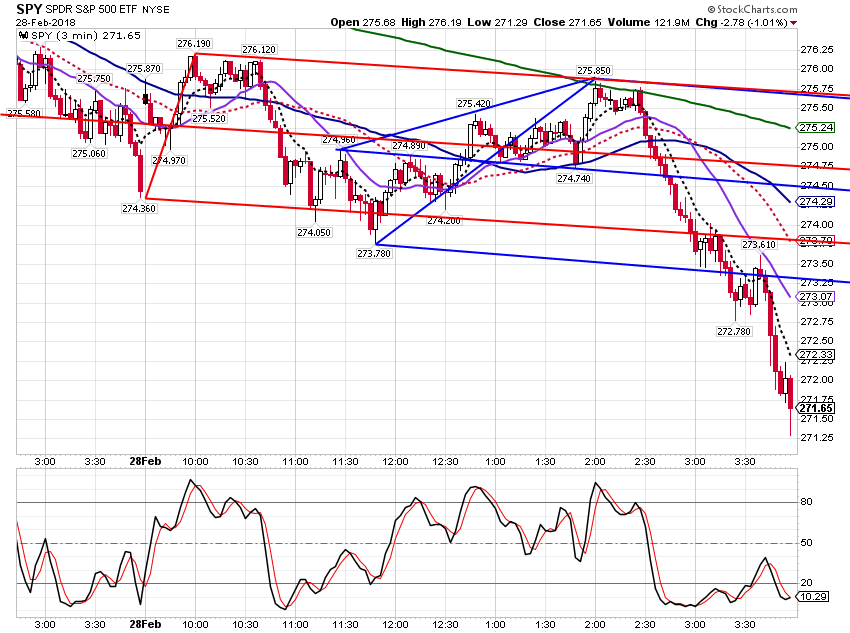
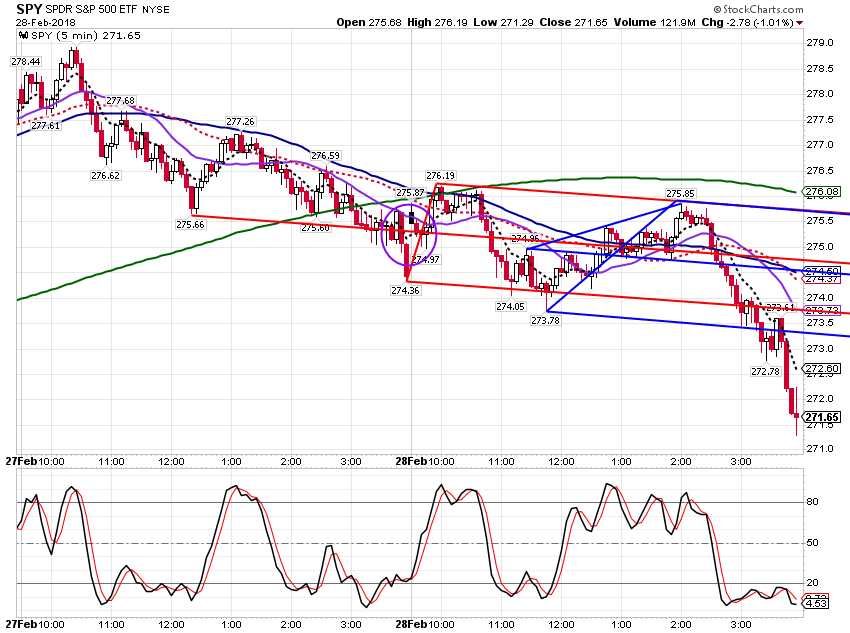
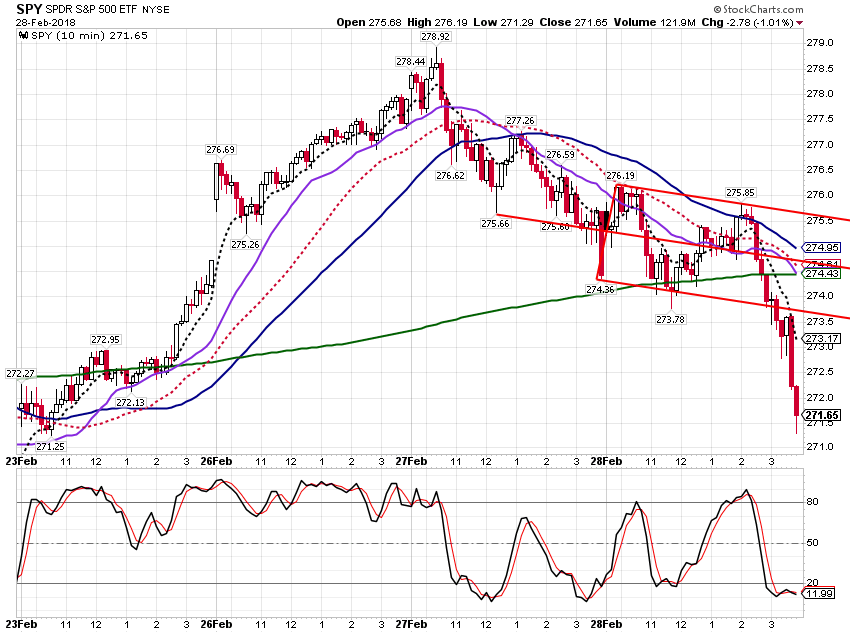
In answer to your question "....How do you use the Moving Averages?" I say, Short answer, I like to watch the 50 (blue line) 200 (green line) crossovers. Also, as Support/Resistance Areas (see price action reversal - 200 area - 0.886 fibo on 3 min chart.) Here are some charts. I like roofer's work a lot, also. Charts show roofer's "Gap on 5 leads to Trend Days" and roofer's "Beauty and Simplicity."
More later.
Al
In answer to your question "....How do you use the Moving Averages?" I say, Short answer, I like to watch the 50 (blue line) 200 (green line) crossovers. Also, as Support/Resistance Areas (see price action reversal - 200 area - 0.886 fibo on 3 min chart.) Here are some charts. I like roofer's work a lot, also. Charts show roofer's "Gap on 5 leads to Trend Days" and roofer's "Beauty and Simplicity."
Originally posted by Duane
You also AL nice charts! How do you use the Moving Averages?
Marcino, sad to hear that, I need your GBPUSD perspective. Handle you business.
Rat, your lines are crazy, do you ever use warning lines? I find them quite effective at times.
Charts !
Marcino, I still think we are going higher.
Click image for original size
Obviously if .886 and the trend line do not hold, price could go much lower.
Click image for original size
Next stop trend line
Click image for original size
Click image for original size
Click image for original size
Click image for original size
More later.
Al
AL
albert
Rep: 99
Posts: 3,094
rat,
I need to give you proper credit for "doing the work" to figure out how roofer traded his setups. I hope I got those two roofer setups discussed here correct. Your posts have been very helpful to me.
Al :--)
I need to give you proper credit for "doing the work" to figure out how roofer traded his setups. I hope I got those two roofer setups discussed here correct. Your posts have been very helpful to me.
Al :--)
Originally posted by albert
Duane - Super charts!
In answer to your question "....How do you use the Moving Averages?" I say, Short answer, I like to watch the 50 (blue line) 200 (green line) crossovers. Also, as Support/Resistance Areas (see price action reversal - 200 area - 0.886 fibo on 3 min chart.) Here are some charts. I like roofer's work a lot, also. Charts show roofer's "Gap on 5 leads to Trend Days" and roofer's "Beauty and Simplicity."
Originally posted by Duane
You also AL nice charts! How do you use the Moving Averages?
Marcino, sad to hear that, I need your GBPUSD perspective. Handle you business.
Rat, your lines are crazy, do you ever use warning lines? I find them quite effective at times.
Charts !
Marcino, I still think we are going higher.
Click image for original size
Obviously if .886 and the trend line do not hold, price could go much lower.
Click image for original size
Next stop trend line
Click image for original size
Click image for original size
Click image for original size
Click image for original size
More later.
Al