Starting it off.
Al
RA
rat89
Rep: 0
Posts: 7,015
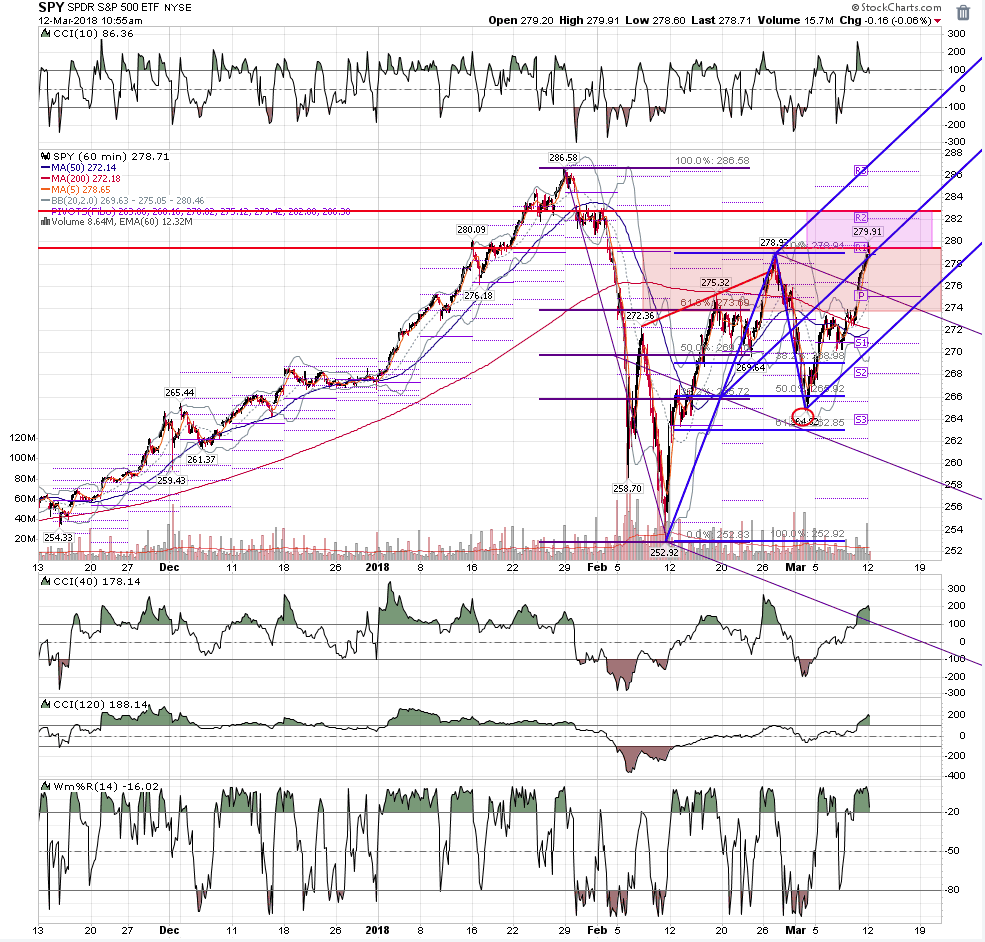
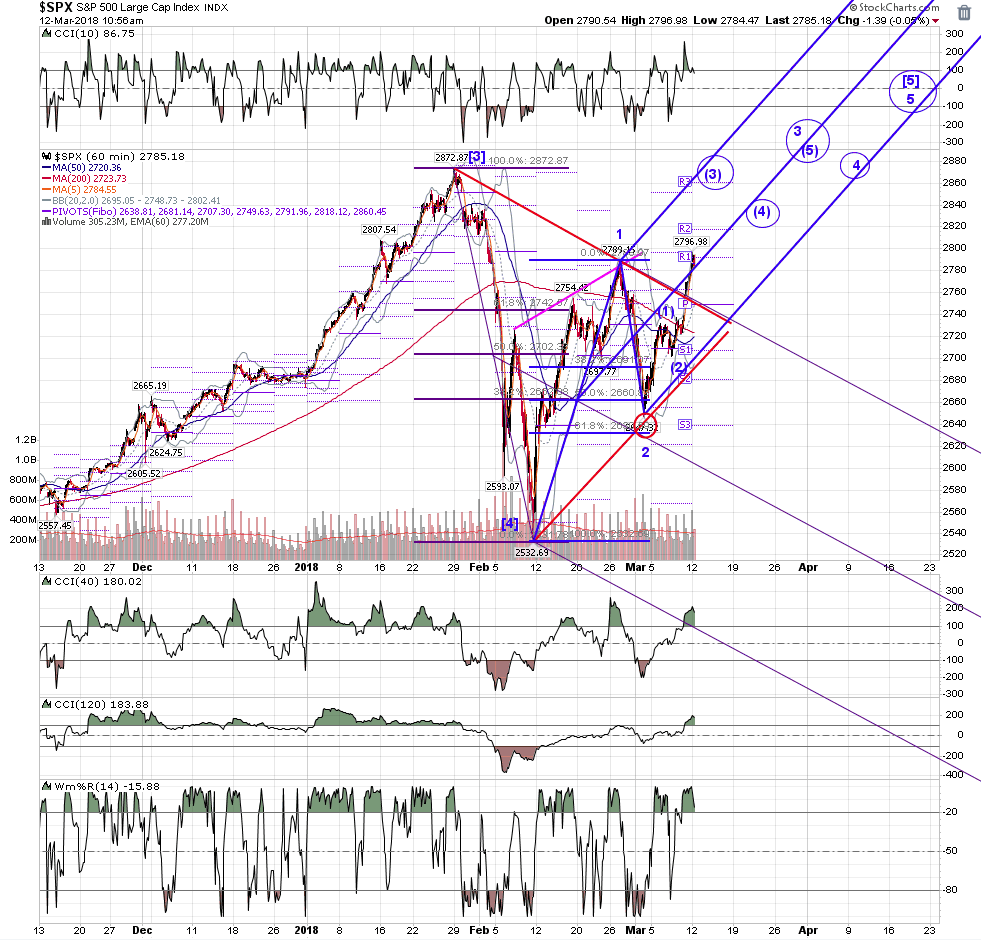
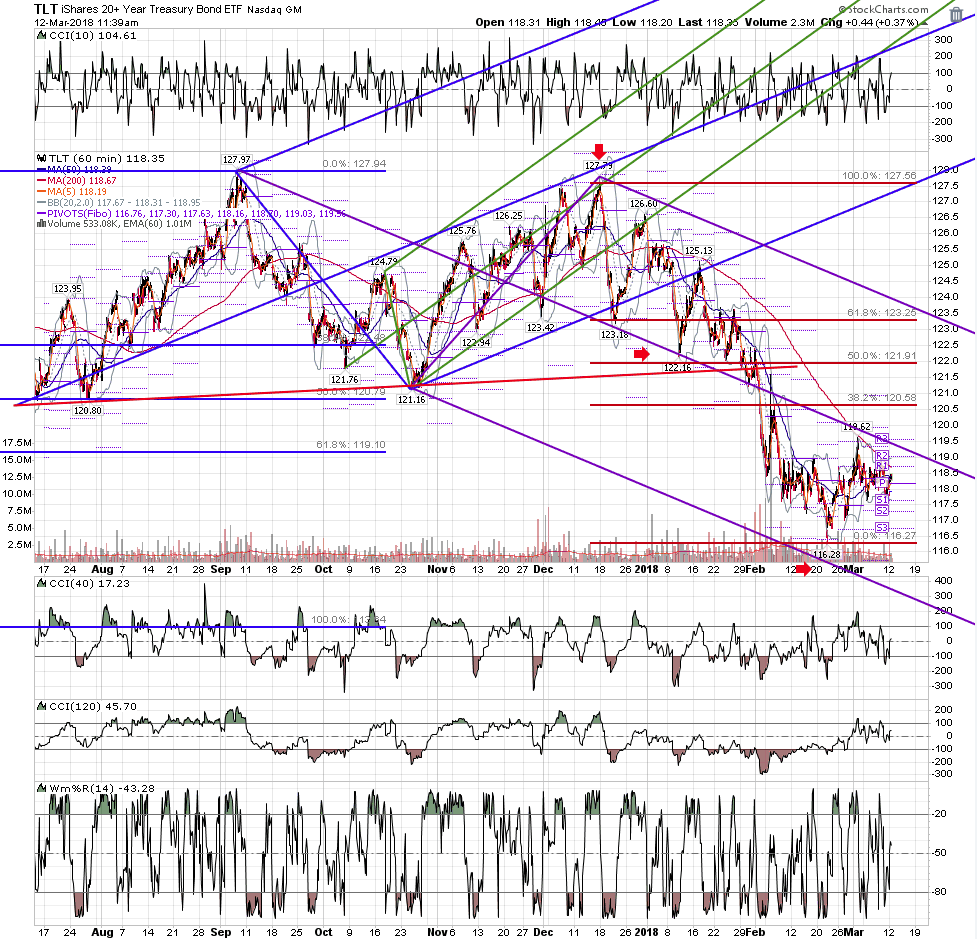
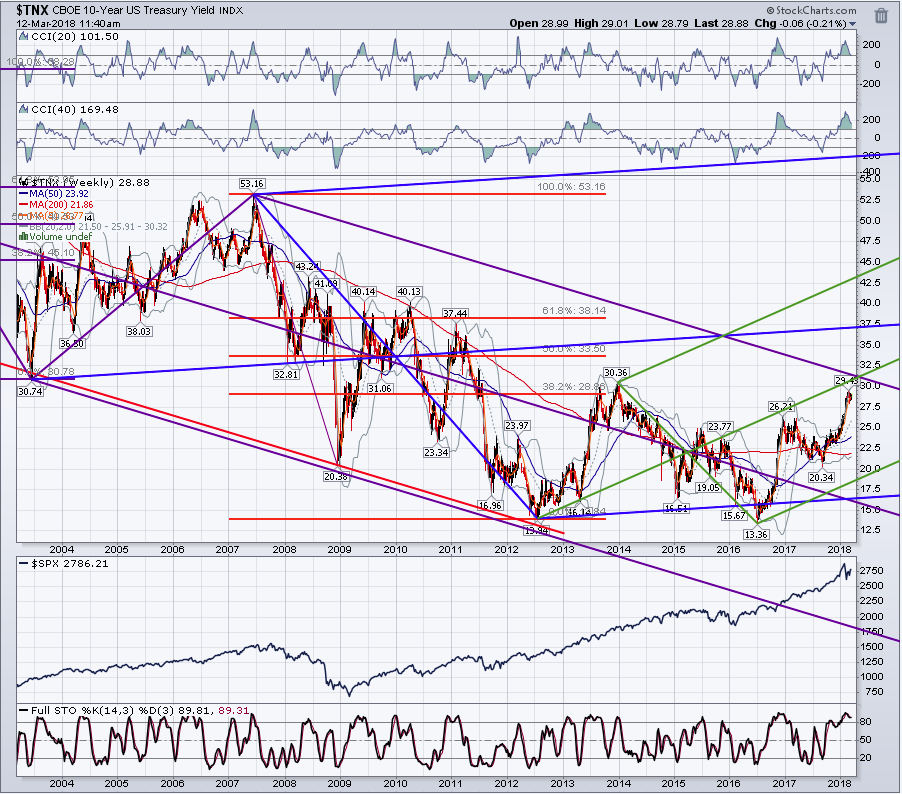
spy and spx 60 - resistance area shown on spy where traders will attempt to short, but the confirmed wave 3 will trap them. Spx shows the probably count to finish out the move. Remember what roofer taught about when price does not hit the median line (red circle) - it will go back to the upper (lower line).....and often beyond.
Click image for original size
Click image for original size
RA
rat89
Rep: 0
Posts: 7,015
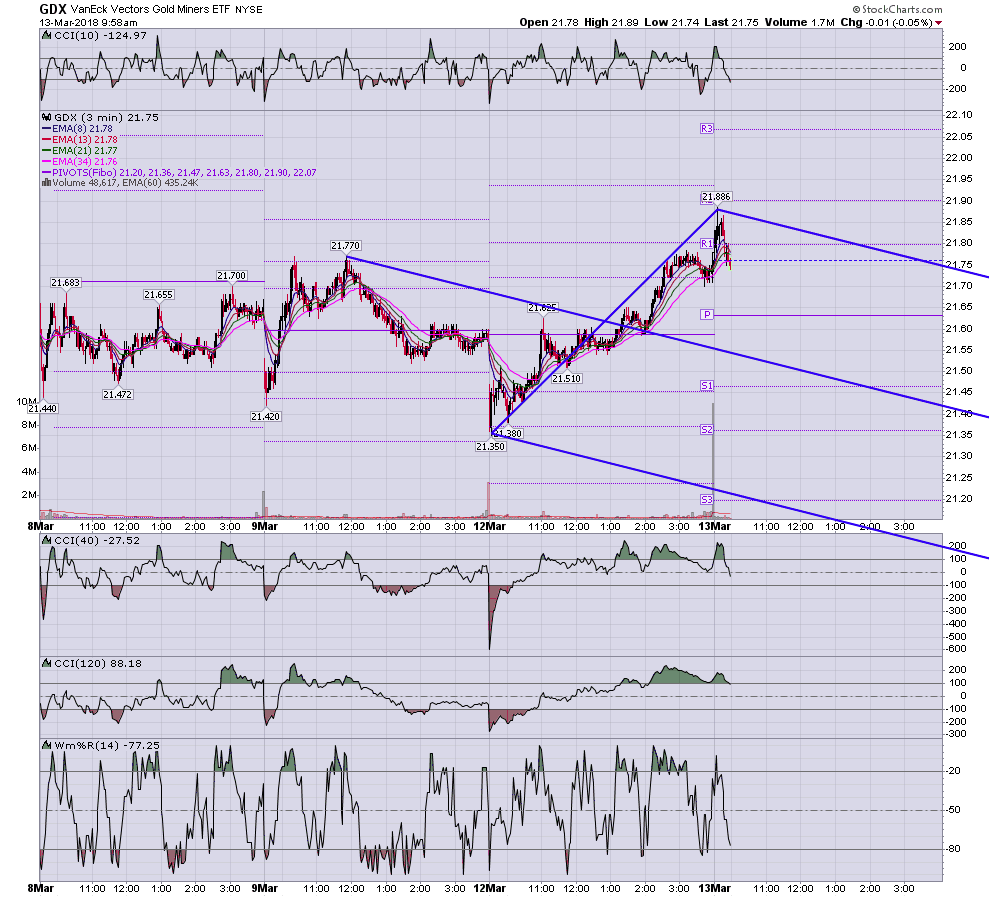
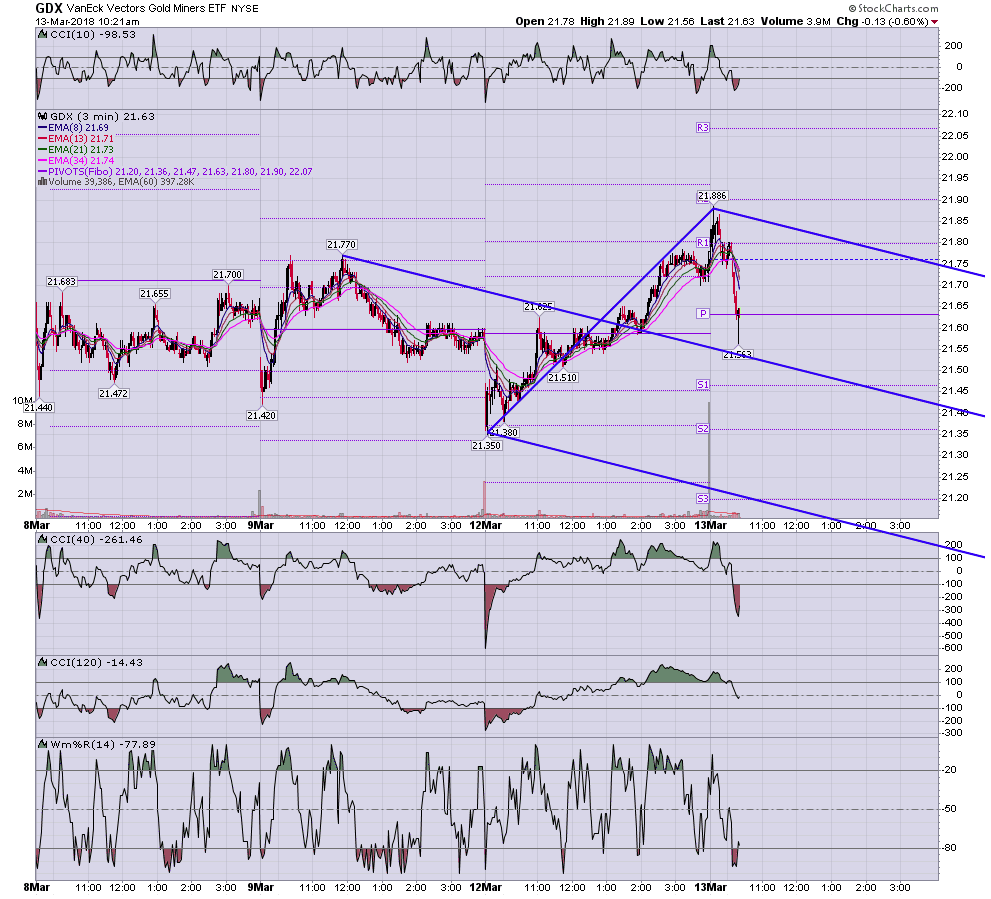
trend line and fib resistance and 1.27 short
Click image for original size
Click image for original size
Click image for original size
AL
albert
Rep: 99
Posts: 3,094
rat,
Very nice charts.
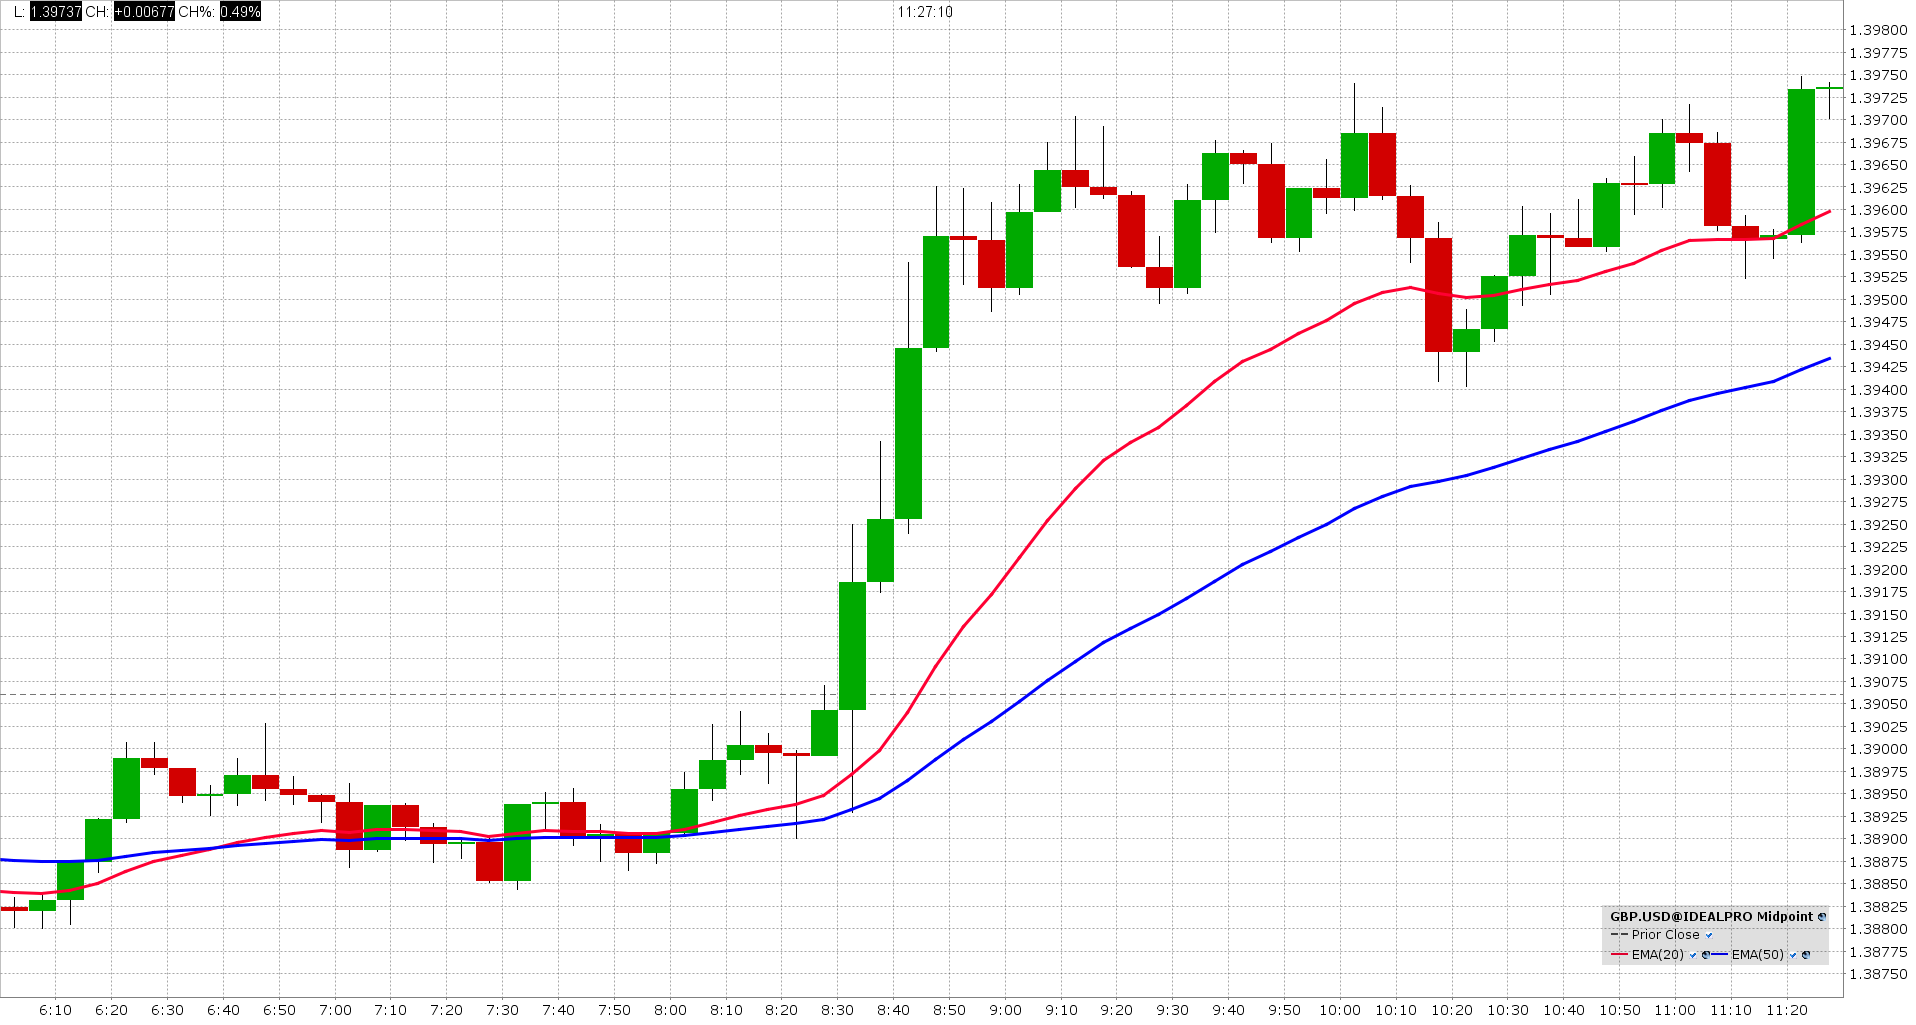
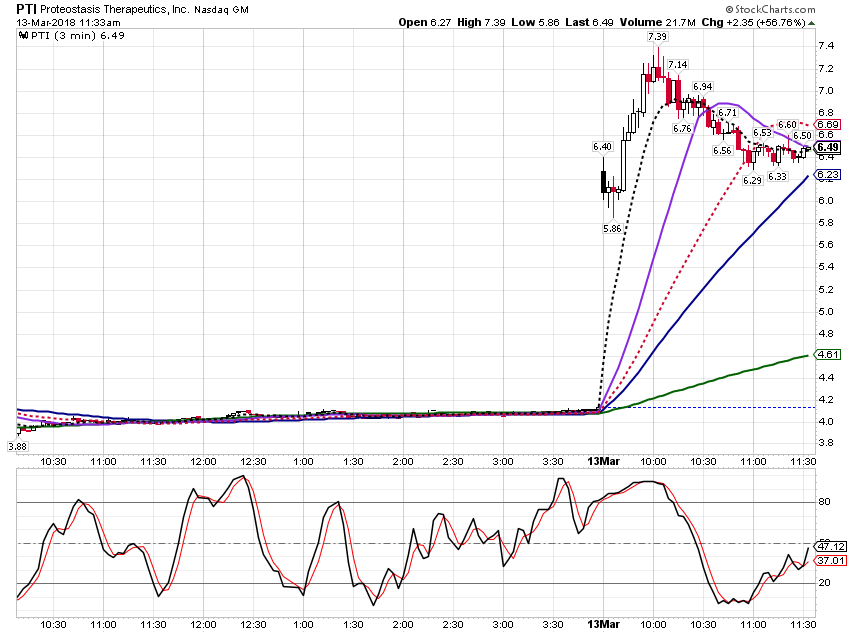
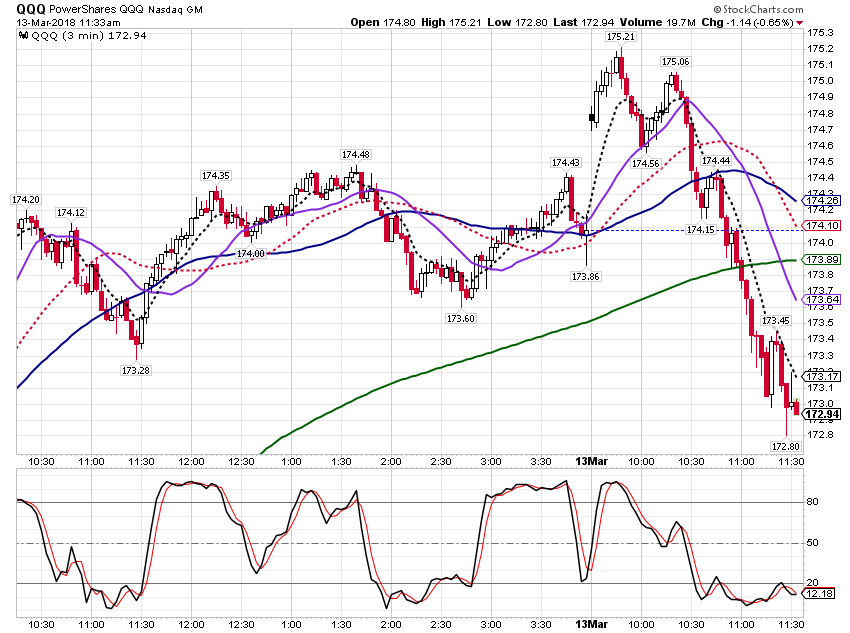
I am paper trading. Made a bit in GBP.USD, PTI, and QQQ. Trying to learn to think in terms of probabilities. The mas on the GBP are 20 and 50 emas.
Al
Very nice charts.
I am paper trading. Made a bit in GBP.USD, PTI, and QQQ. Trying to learn to think in terms of probabilities. The mas on the GBP are 20 and 50 emas.
Click image for original size
Click image for original size
Click image for original size
Al
RA
rat89
Rep: 0
Posts: 7,015
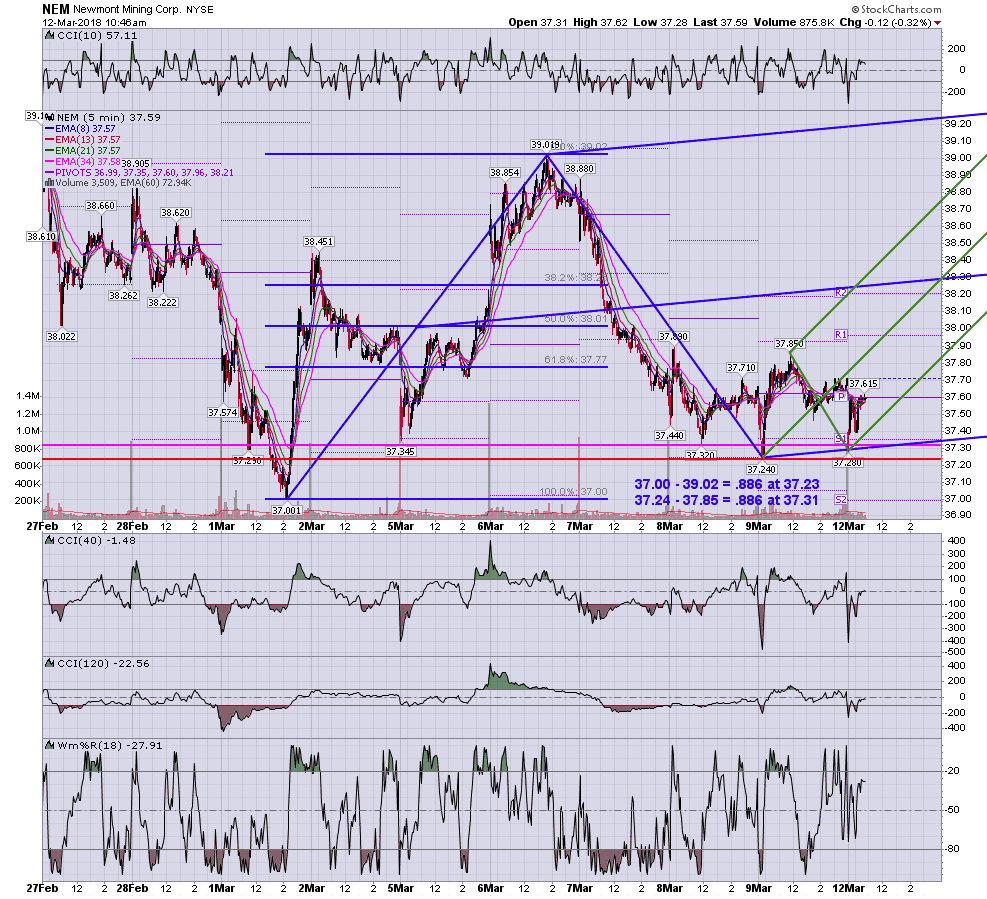
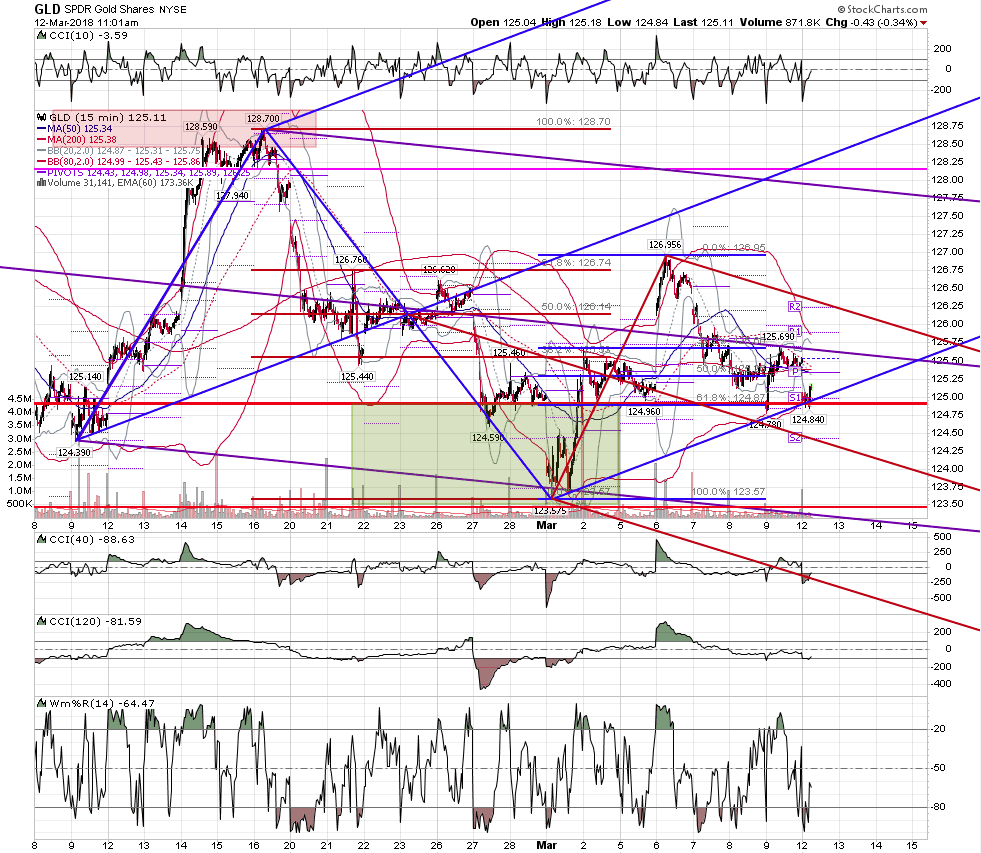
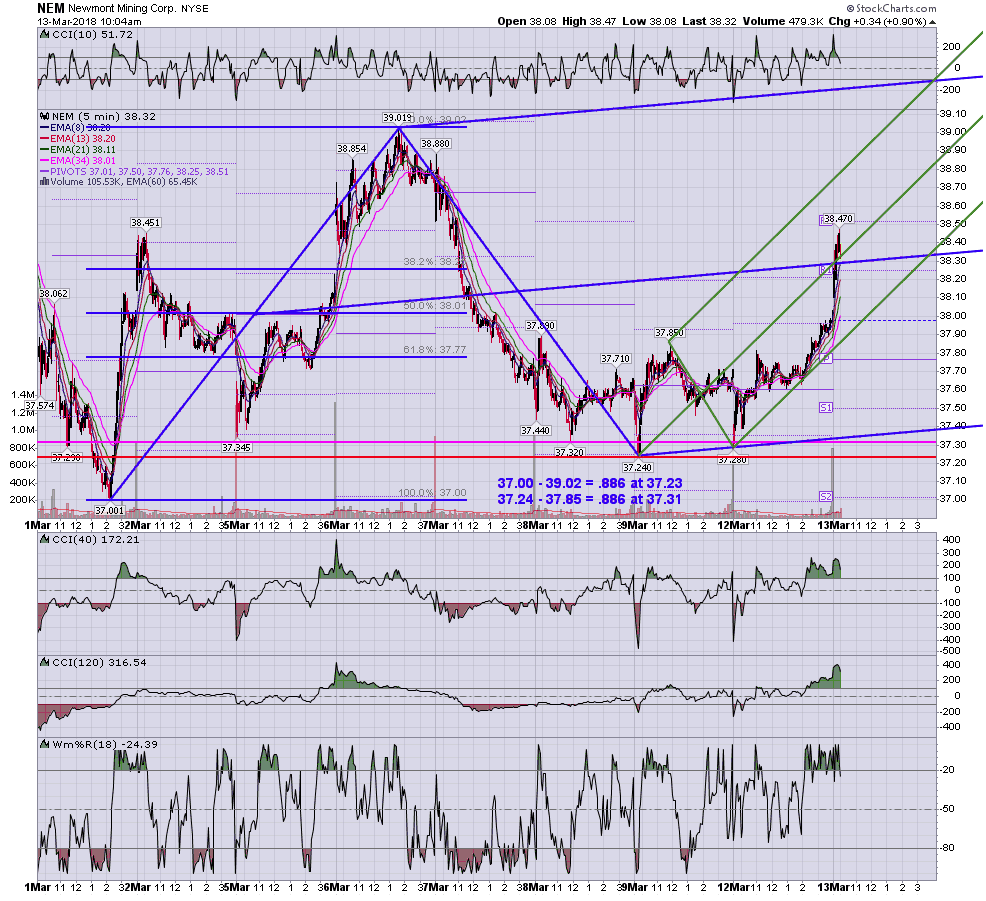
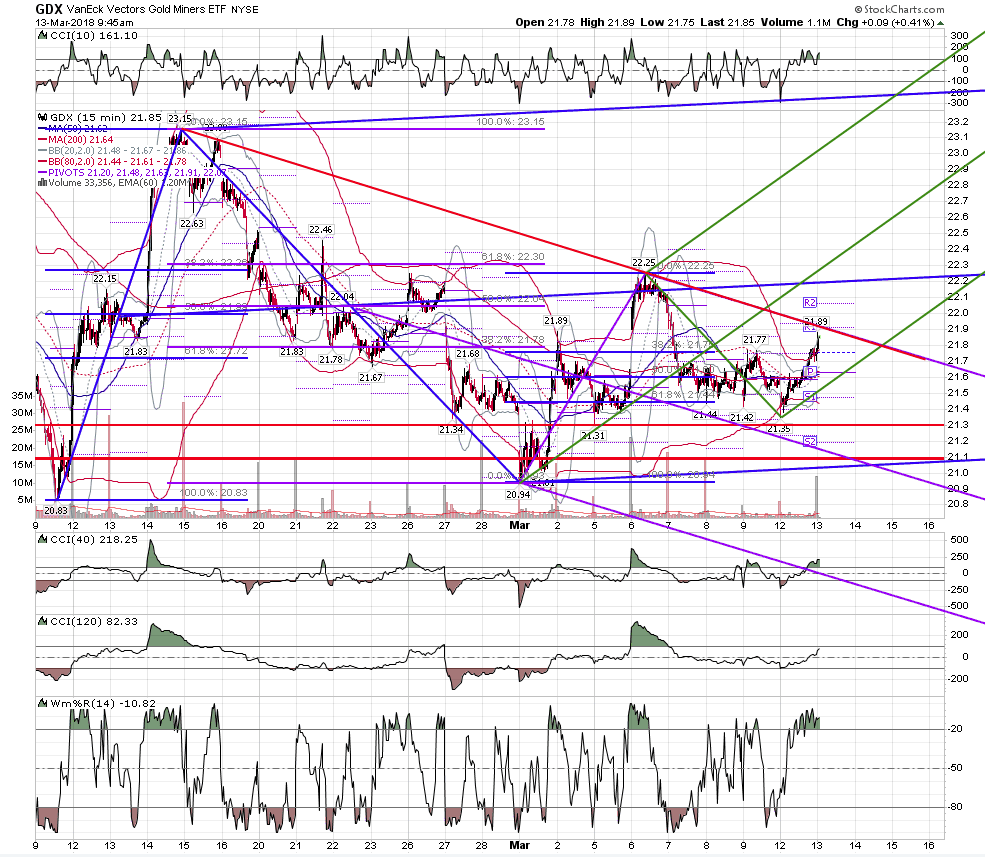
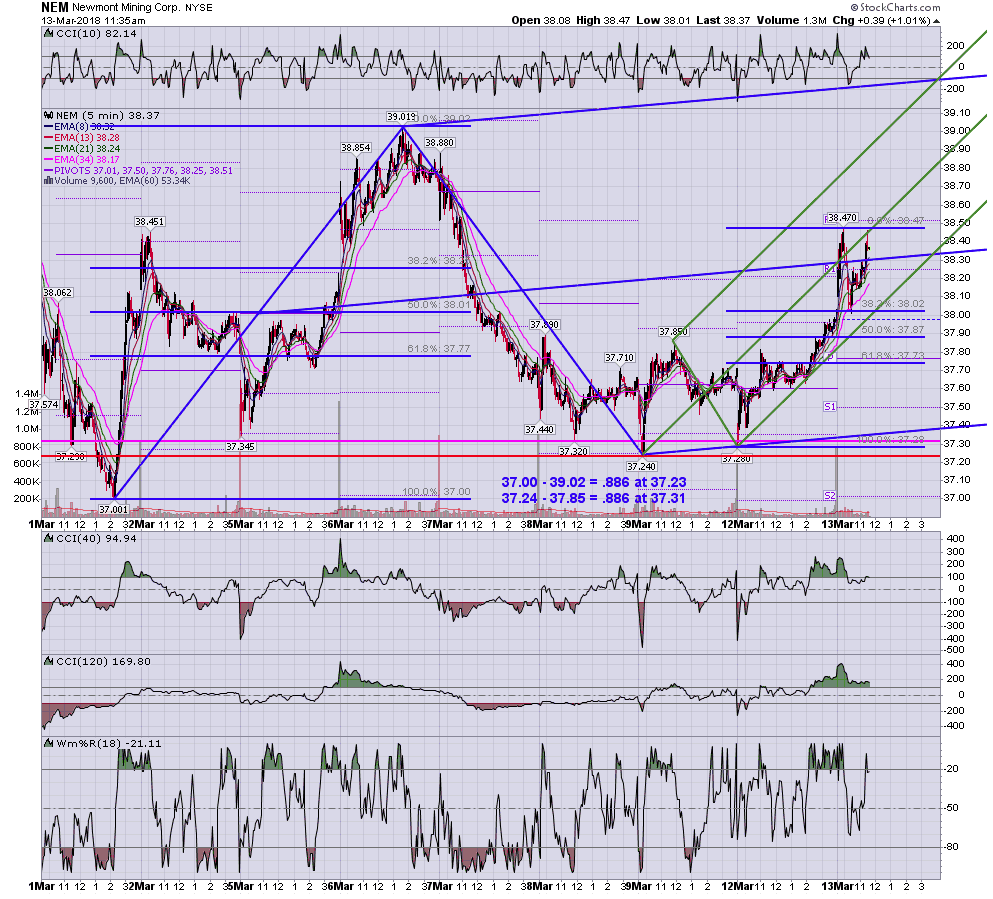
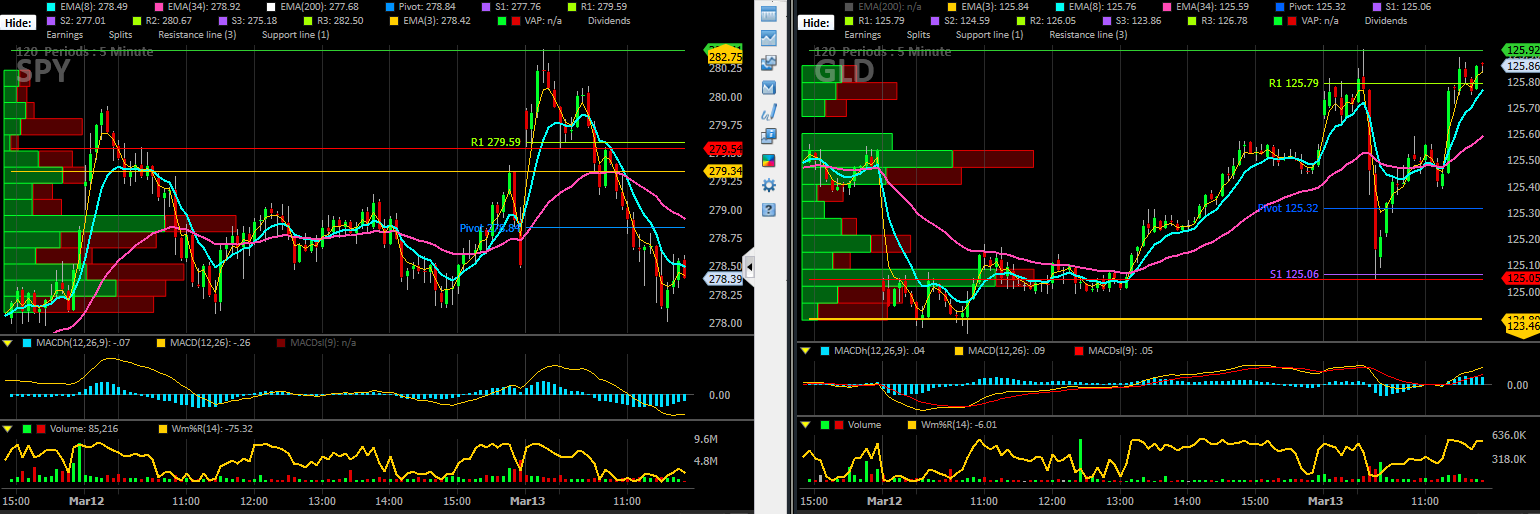
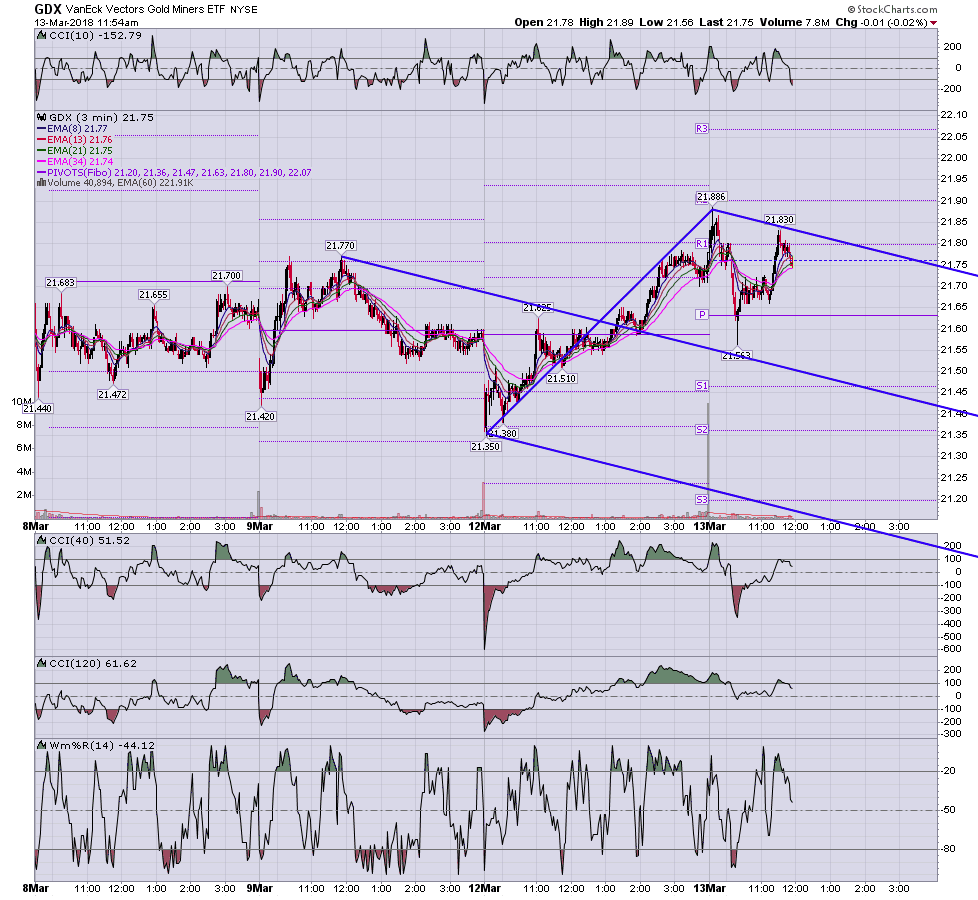
thanks Al....following the short on gdx, there was a nice long on nem at the .382 back up to the median line and early am high. Not that spy and gld, which have been mostly correlated lately, are not today...
Game zone retest for gdx?
Click image for original size
Click image for original size
Game zone retest for gdx?
Click image for original size
RA
rat89
Rep: 0
Posts: 7,015
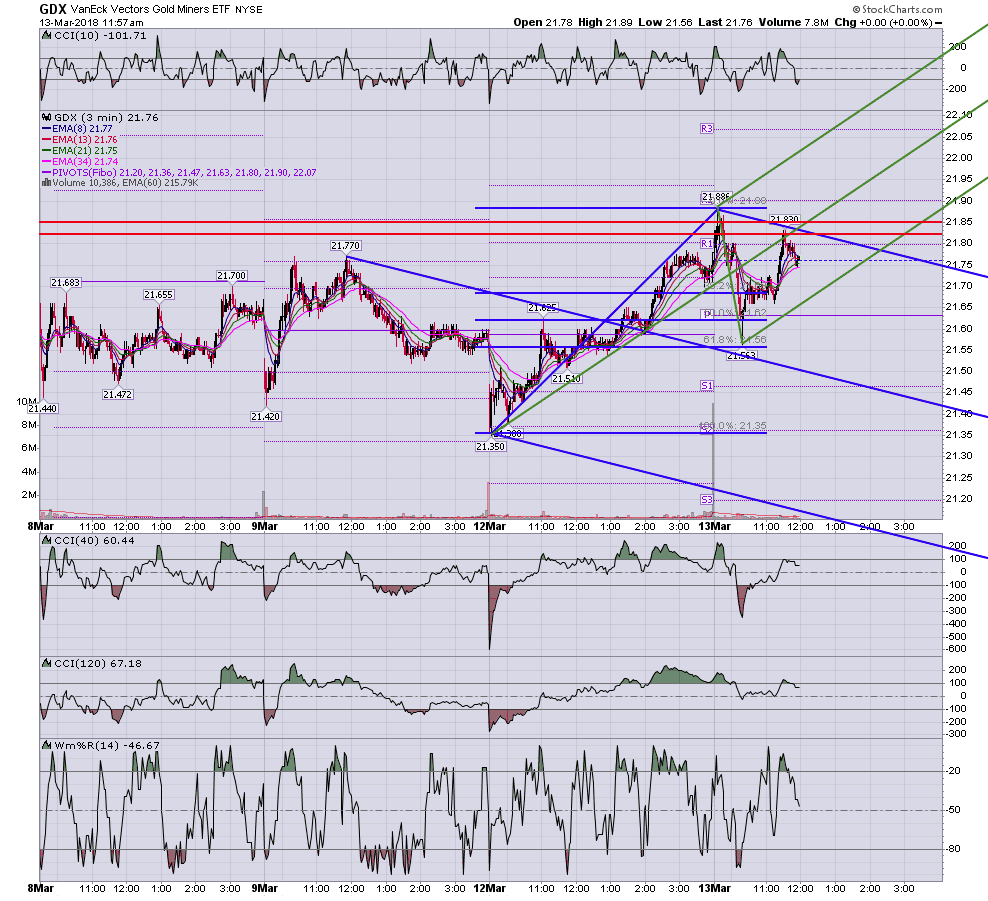
better view of gdx 3 - see the early am short at the 1.27 external retrace, the drop to the median line area at .618, and the long back up to the retest in the .786 - 886 zone? Both these trades occurred where most traders would tell you "but it's going the other way"
Click image for original size
AL
albert
Rep: 99
Posts: 3,094
rat,
Cool charts!
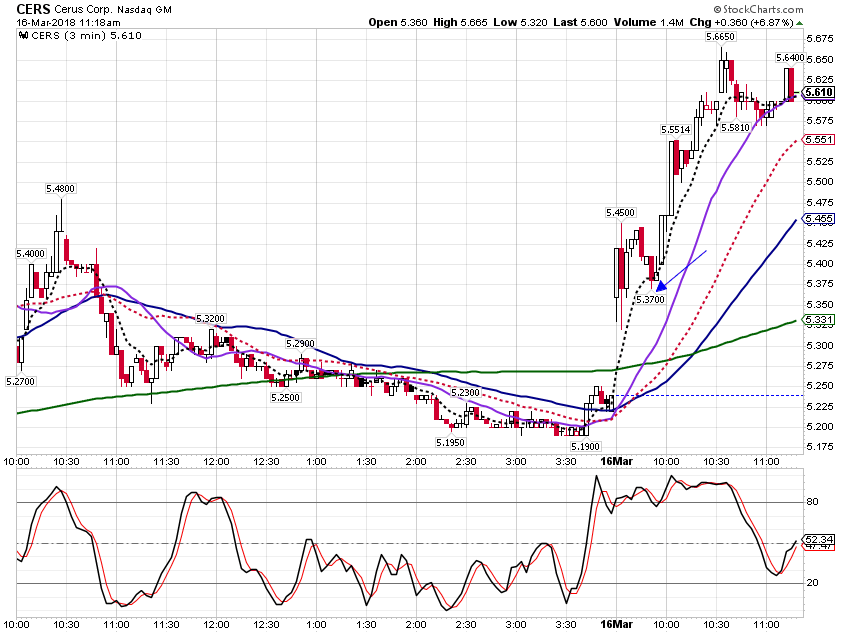
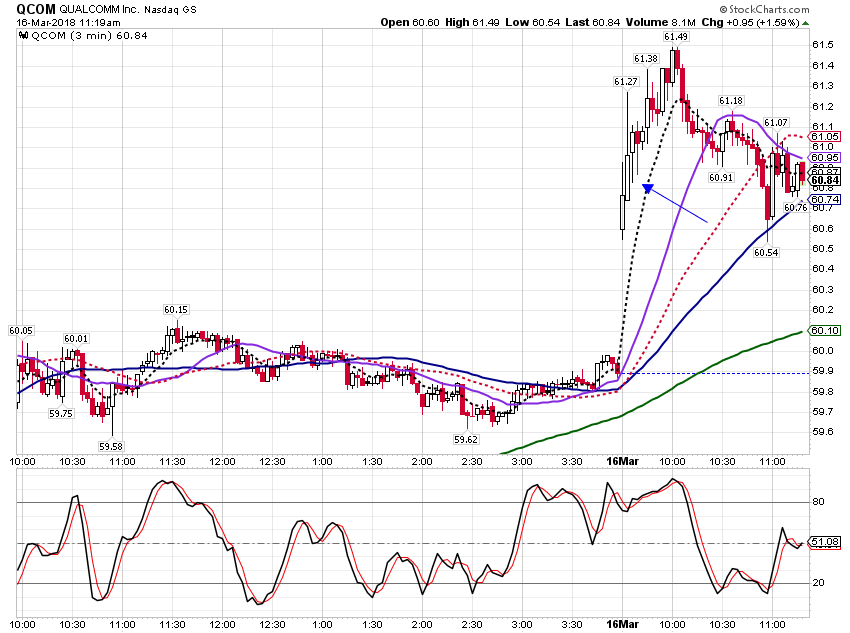
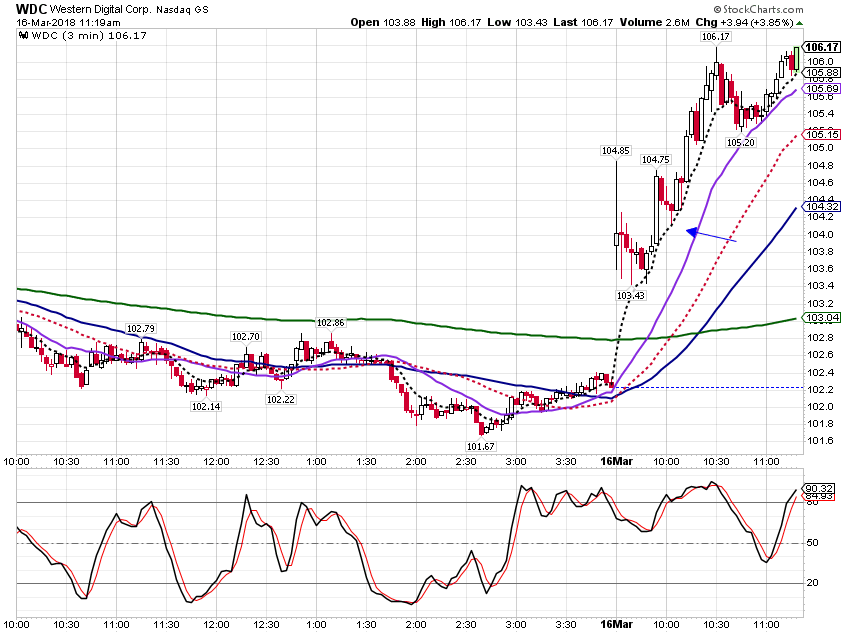
I am still paper trading. I got stopped out of two trades this morning - CERS and QCOM. I set my stops too close to the price action. Drat. I exited a third trade, WDC, too soon, for a loss. Double Drat.
Al
Cool charts!
I am still paper trading. I got stopped out of two trades this morning - CERS and QCOM. I set my stops too close to the price action. Drat. I exited a third trade, WDC, too soon, for a loss. Double Drat.
Click image for original size
Click image for original size
Click image for original size
Al