Starting it off.
Al
MA
MarcinO
Rep: 67
Posts: 5,506
They couldn't make it below 1.4340 yet.
Another day with 70 pips range...
Another day with 70 pips range...
Originally posted by MarcinO
Cable bounced off of 1.4342. At 75-80 this reaction is likely to be done and maybe we will see another wave down to 1.43.
MA
MarcinO
Rep: 67
Posts: 5,506
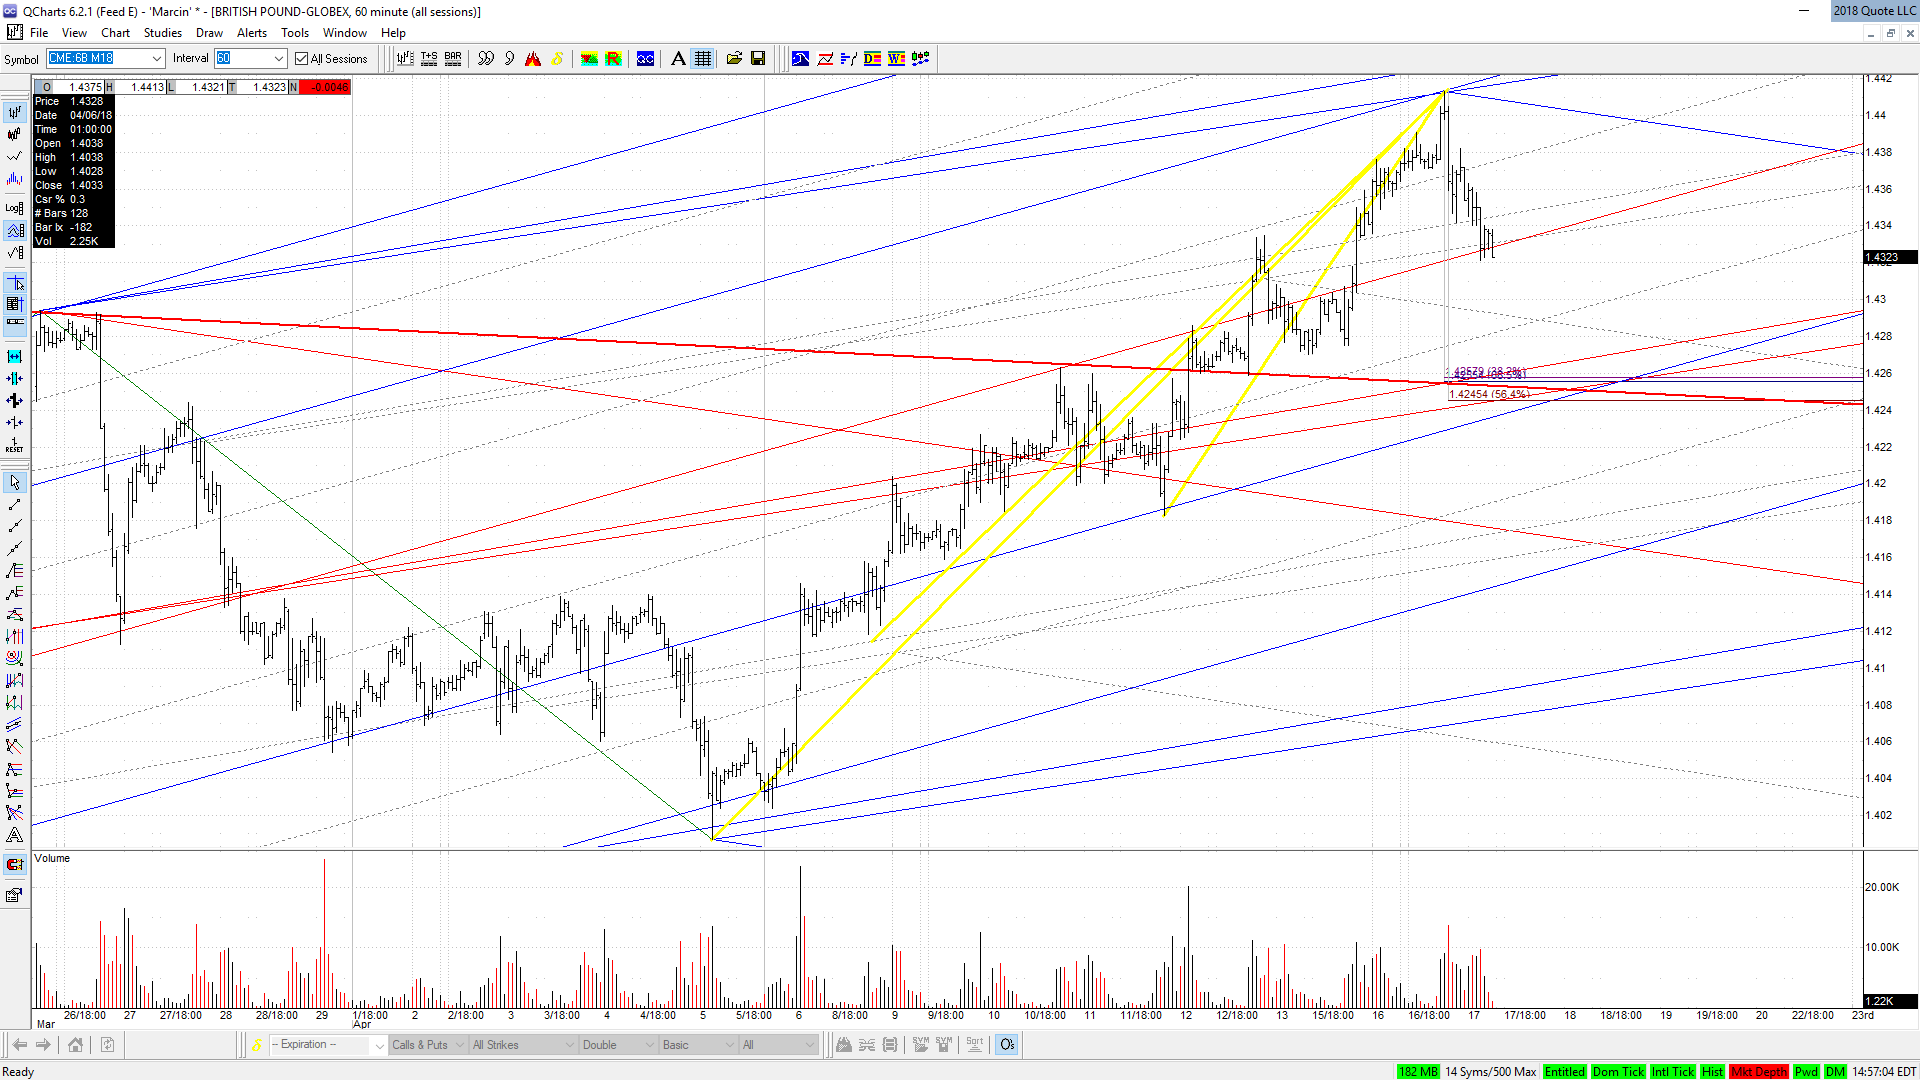
This time I was too sceptical about daily range. After London session they decided to drop the Pound, so 1.4300 is still in play.
I guess it will be all for today. Tomorrow one more push lower to 1.4250-60 is very likely but data from UK at 4:40 AM EST may change everything.
I guess it will be all for today. Tomorrow one more push lower to 1.4250-60 is very likely but data from UK at 4:40 AM EST may change everything.
Click image for original size
MA
MarcinO
Rep: 67
Posts: 5,506
Thanks, Al. Don't be afraid to place your charts here whenever possible.
Originally posted by albert
Marcin and rat,
Great work, guys.
Al
MA
MarcinO
Rep: 67
Posts: 5,506
It seems not only I am bitching on low volatility these days.
https://www.zerohedge.com/news/2018-04-17/vix-crashes-14-handle
VIX is strongly correlated with intraday range in the Cable this year, although theoretically they are not dependent instruments..
https://www.zerohedge.com/news/2018-04-17/vix-crashes-14-handle
VIX is strongly correlated with intraday range in the Cable this year, although theoretically they are not dependent instruments..
MA
MarcinO
Rep: 67
Posts: 5,506
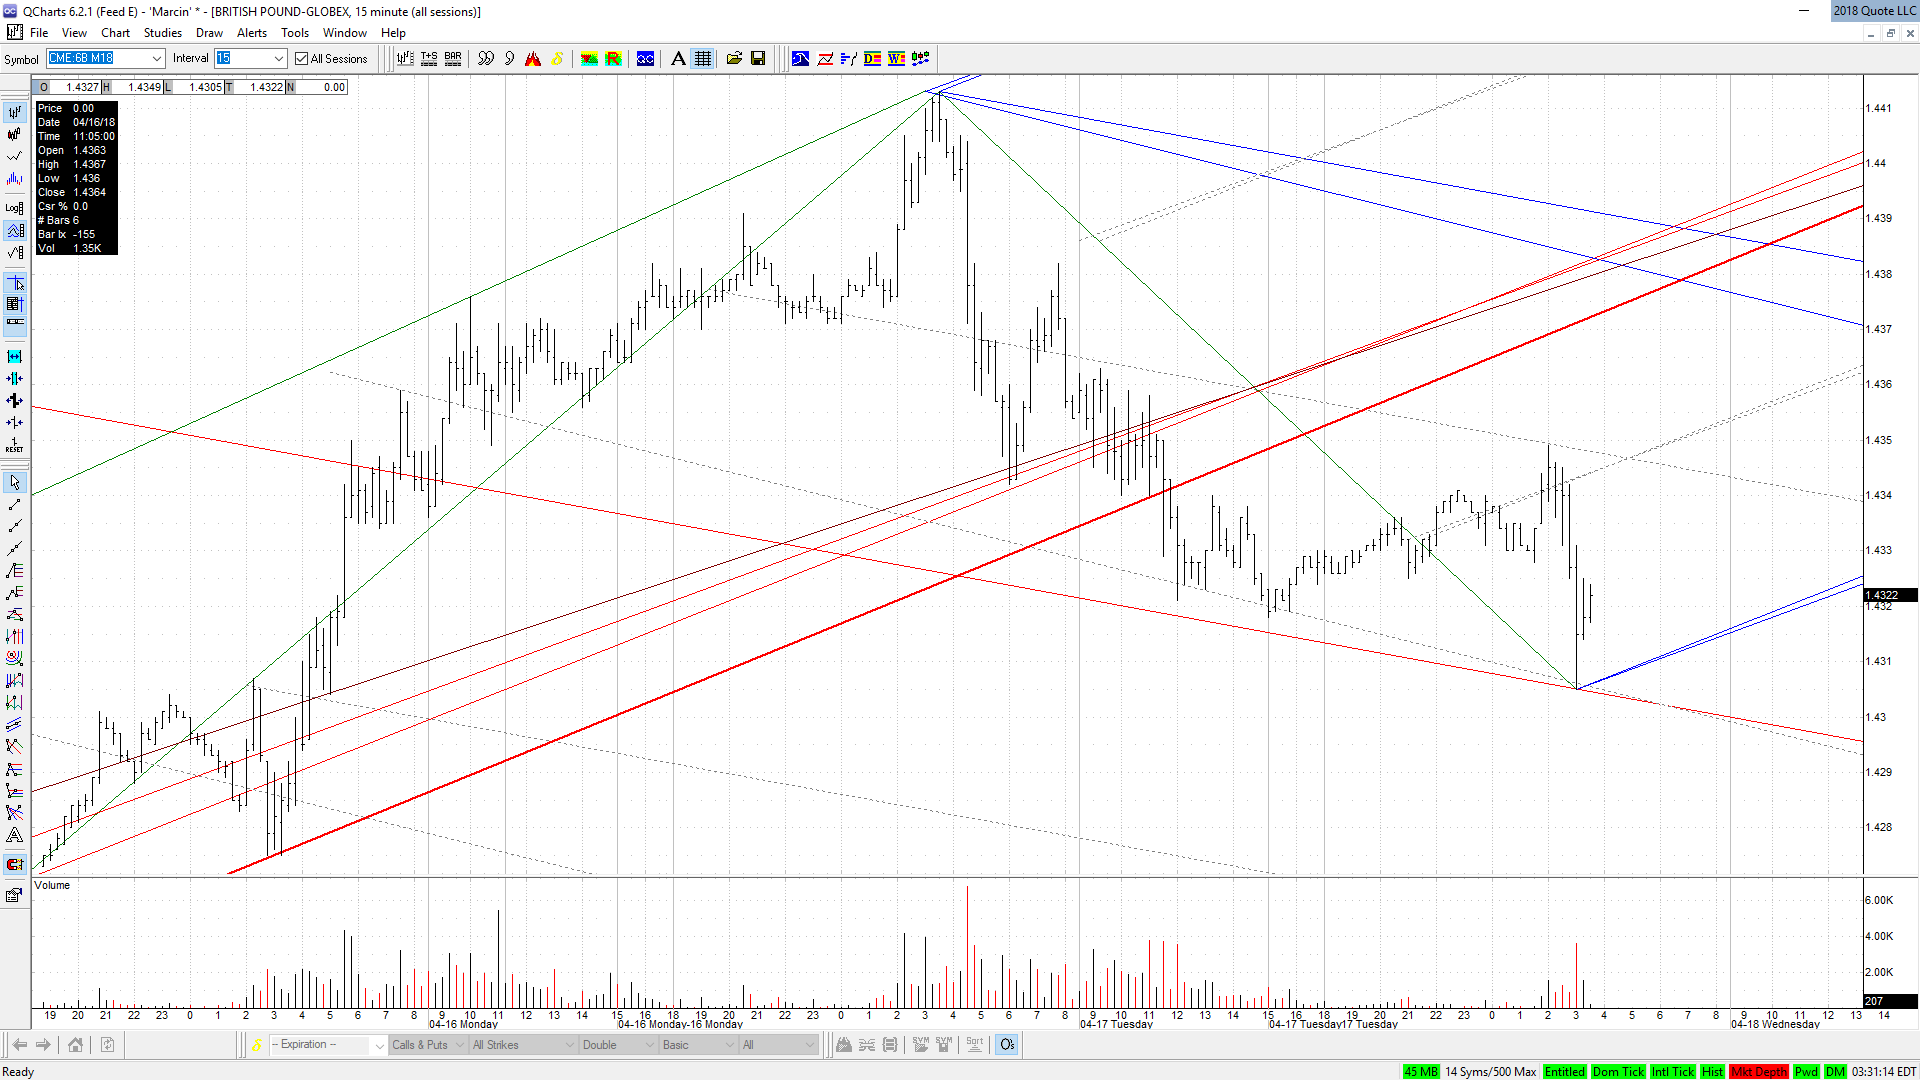
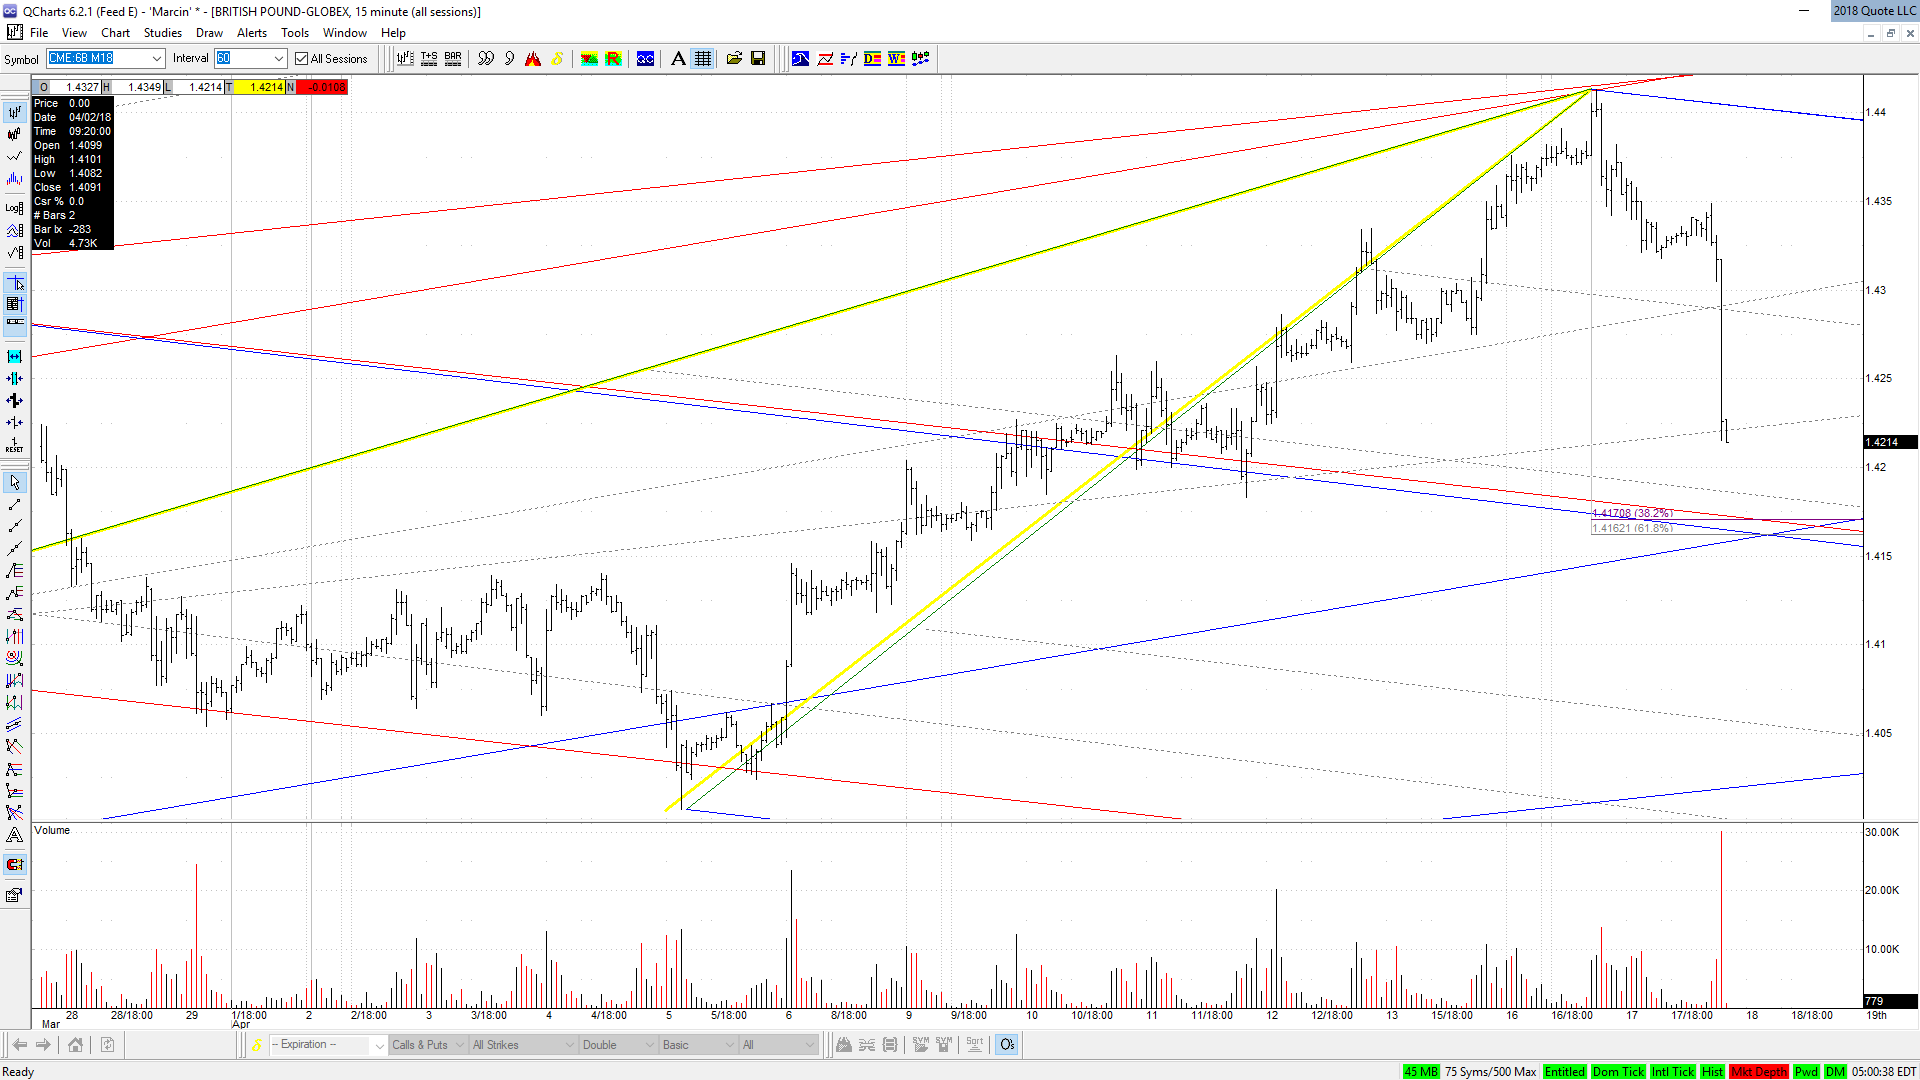
My most preferable scenario now is a bearish correction to 1.4380-90 (prices for 6B H18 trading 35 pips above the spot now).
Click image for original size
AL
albert
Rep: 99
Posts: 3,094
Marcin,
Of course. Here are some things that I have been looking at.
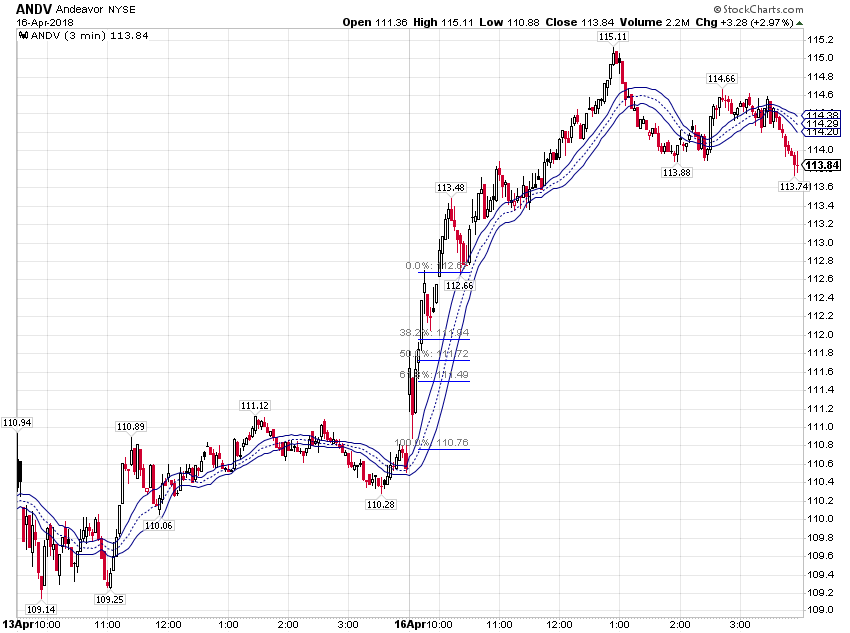
Most of these I did not trade. The ANDV I did trade, paper trading, with a call option and with stock trade.
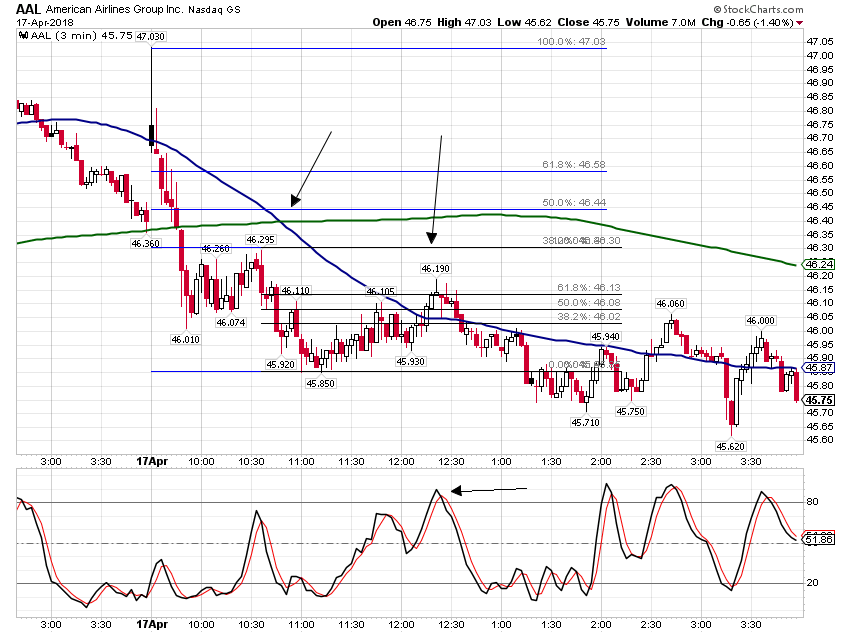
AAL - Death Cross, 50 sma (blue) crossing below the 200 sma (green). (This is about the only takeaway I got from researching the Golden Cross and Death Cross charts that I look at). After a Death Cross, the STO OverBought level sometimes gives good SELL setups, kind of a vestige of a 50 and/or a 200 price retest and reversal.
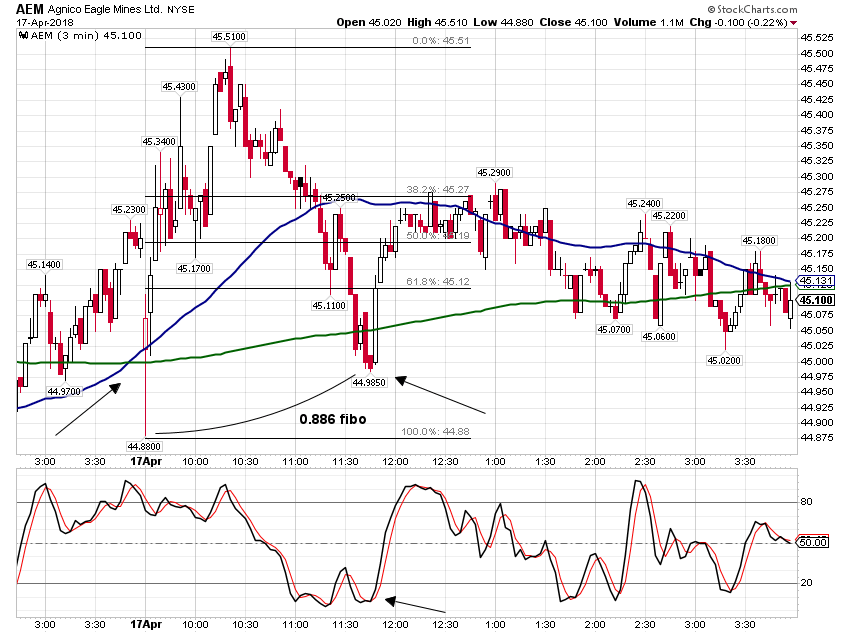
AEM - Gold Cross, 50 sma (blue) crossing above the 200 sma. Same general idea as above, for AAL, except after a Gold Cross I look at STO Oversold levels for BUYs, possibly kind of a vestige of a 200 price retest and reversal. Jim's very important 0.886 fibo here!
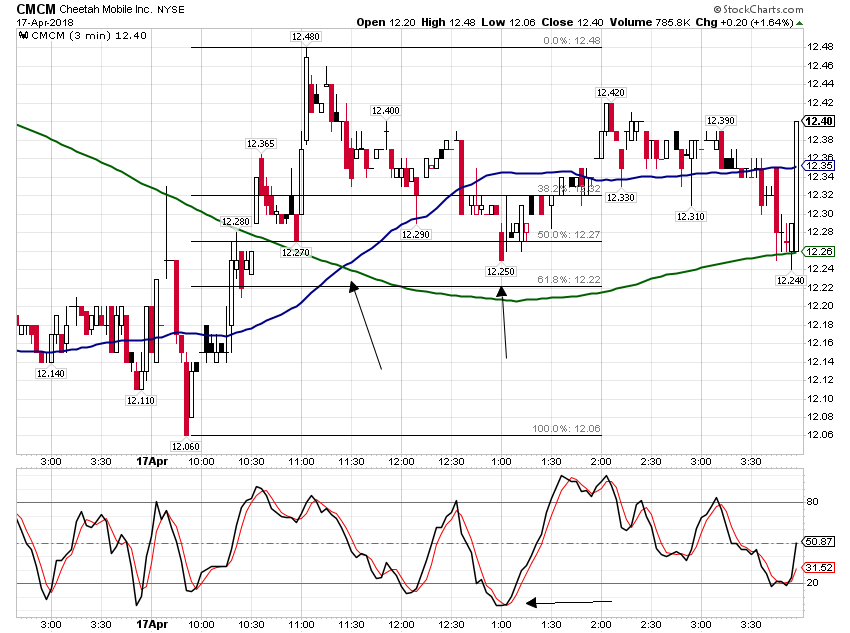
CMCM - Gold Cross, basically same idea as for AEM possibly kind of a vestige of a 50 and/or a 200 price retest and reversal. . Looks like a 0.564 fibo.
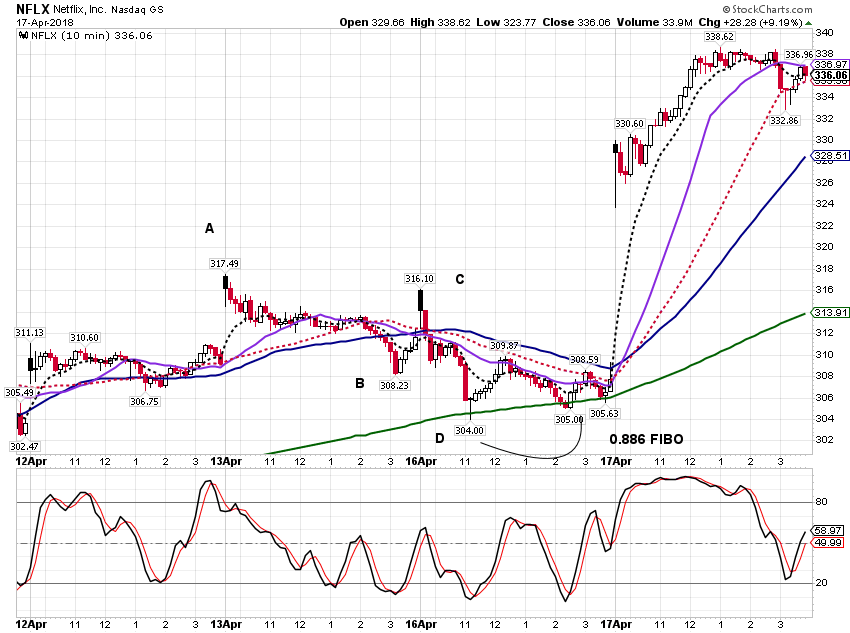
NFLX - Sweet X*AB=CD reversing at the 200. Too bad I did not trade this one. Fibos: ABC = 0.886, BCD = 1.416 - 1.618. X = 1.272 - 1.382. My favorite, Jim's 0.886 on 200 with price reversal.
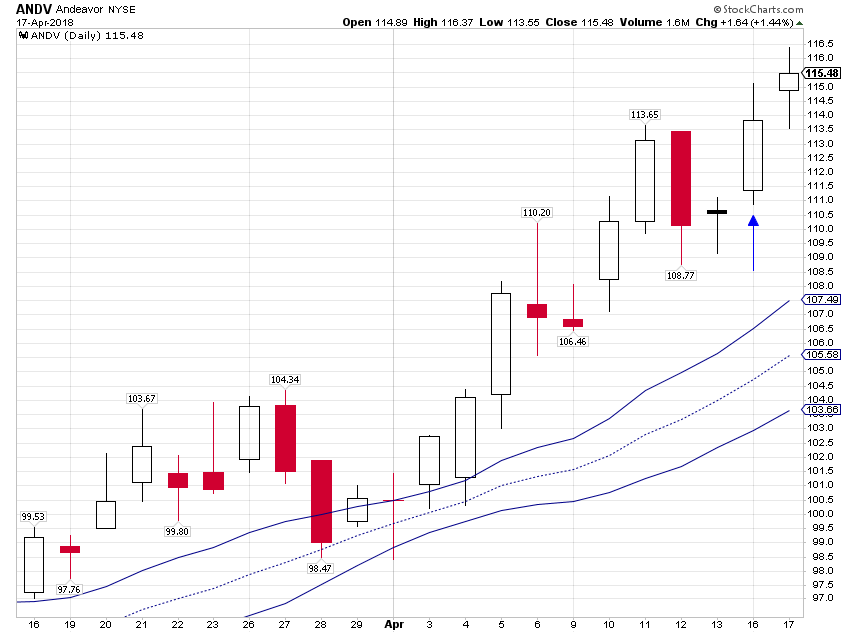
ANDV - Oil stocks have been on a tear.
As a entry method, I am looking at Steve Primo's Strategy #3A, that I saw on "Youtube."
Good Trading,
Al :--)
Of course. Here are some things that I have been looking at.
Originally posted by MarcinO
Thanks, Al. Don't be afraid to place your charts here whenever possible.
Originally posted by albert
Marcin and rat,
Great work, guys.
Al
Most of these I did not trade. The ANDV I did trade, paper trading, with a call option and with stock trade.
Click image for original size
Click image for original size
Click image for original size
Click image for original size
Click image for original size
Click image for original size
AAL - Death Cross, 50 sma (blue) crossing below the 200 sma (green). (This is about the only takeaway I got from researching the Golden Cross and Death Cross charts that I look at). After a Death Cross, the STO OverBought level sometimes gives good SELL setups, kind of a vestige of a 50 and/or a 200 price retest and reversal.
AEM - Gold Cross, 50 sma (blue) crossing above the 200 sma. Same general idea as above, for AAL, except after a Gold Cross I look at STO Oversold levels for BUYs, possibly kind of a vestige of a 200 price retest and reversal. Jim's very important 0.886 fibo here!
CMCM - Gold Cross, basically same idea as for AEM possibly kind of a vestige of a 50 and/or a 200 price retest and reversal. . Looks like a 0.564 fibo.
NFLX - Sweet X*AB=CD reversing at the 200. Too bad I did not trade this one. Fibos: ABC = 0.886, BCD = 1.416 - 1.618. X = 1.272 - 1.382. My favorite, Jim's 0.886 on 200 with price reversal.
ANDV - Oil stocks have been on a tear.
As a entry method, I am looking at Steve Primo's Strategy #3A, that I saw on "Youtube."
Good Trading,
Al :--)
MA
MarcinO
Rep: 67
Posts: 5,506
Wow, that's a very nice stuff you posted here, Al!
AEM looks particularly interesting from your approach standpoint.
AEM looks particularly interesting from your approach standpoint.
AL
albert
Rep: 99
Posts: 3,094
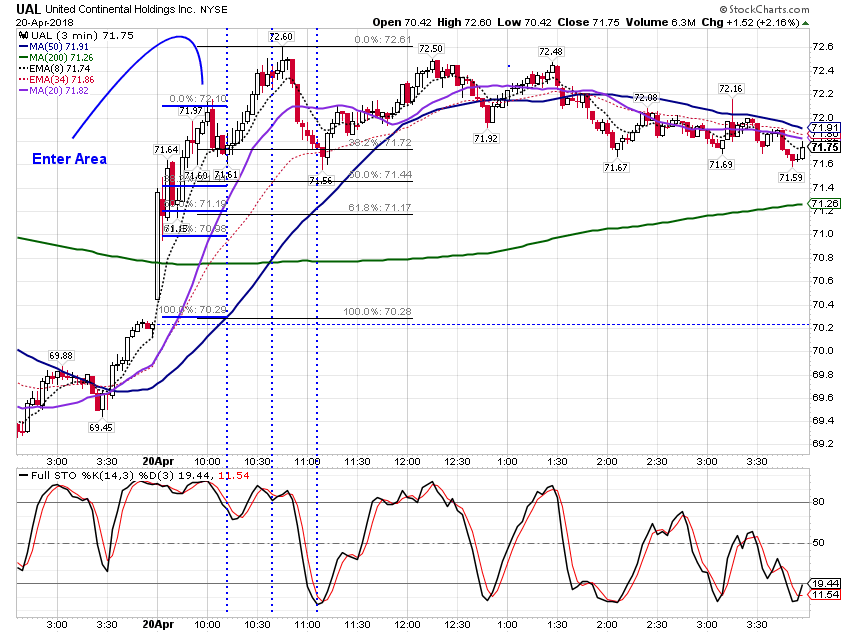
Today was not a stellar paper trading day for me. I placed four option trades today and three of them expired worthlessly. I did manage to make a small profit in UAL. I broke my resolves to be patient and to enter trades at a price pullback. It cost me. Nice setup but poor execution. The pullback was to a 0.146 fibo.
Al
Click image for original size
Al