Starting it off.
Al
RA
rat89
Rep: 0
Posts: 7,015
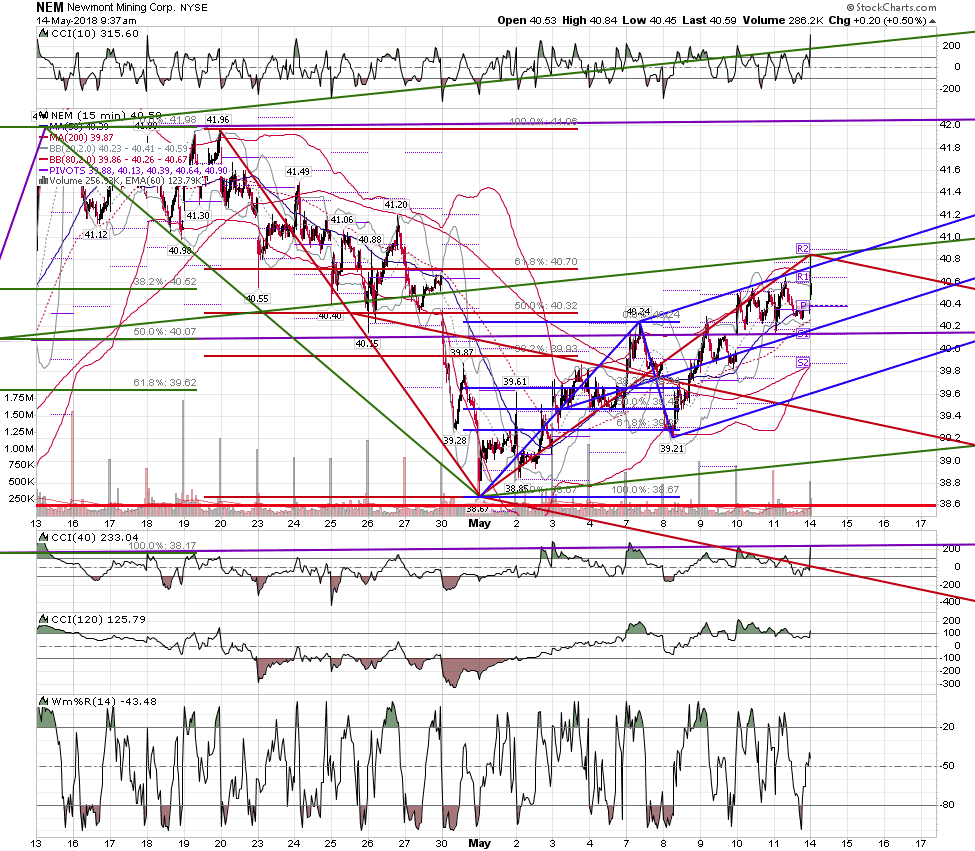
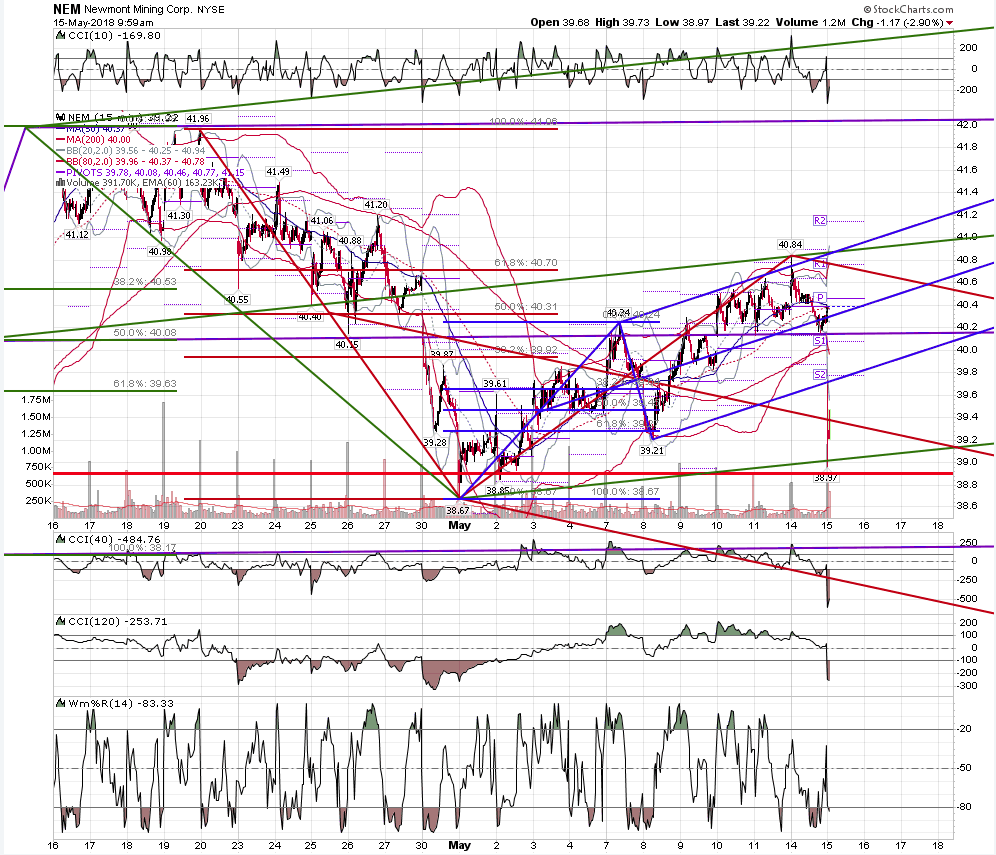
nem then and now
Click image for original size
Click image for original size
RA
rat89
Rep: 0
Posts: 7,015
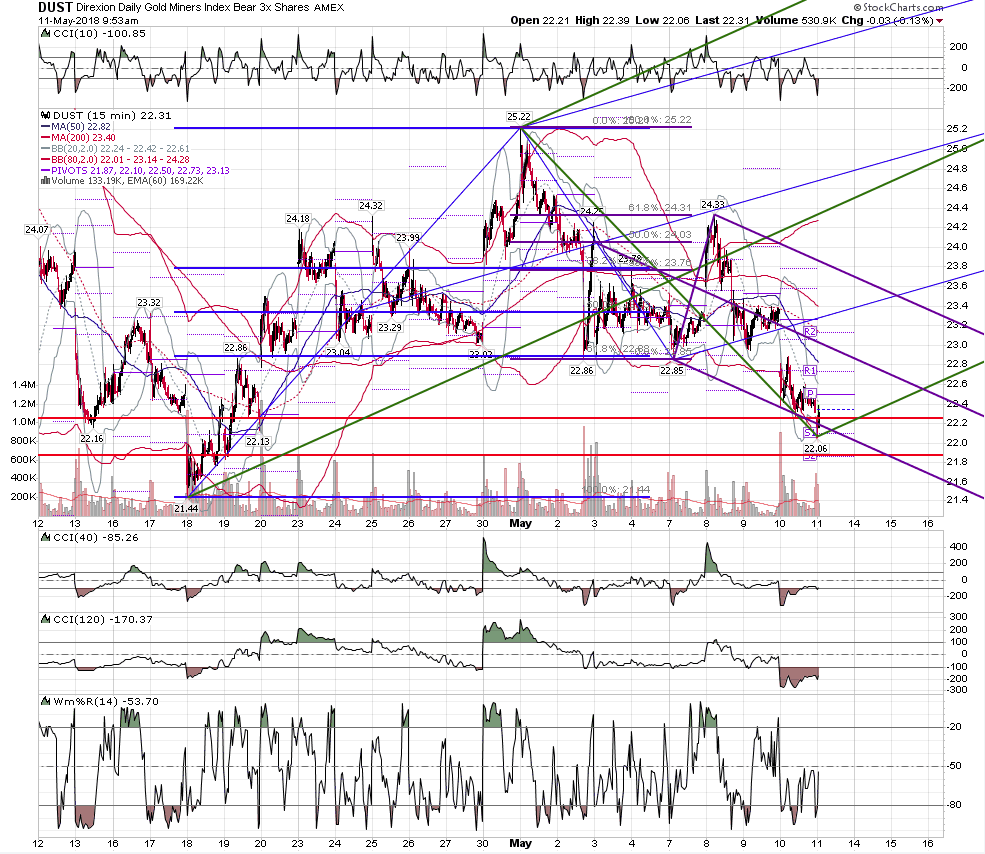
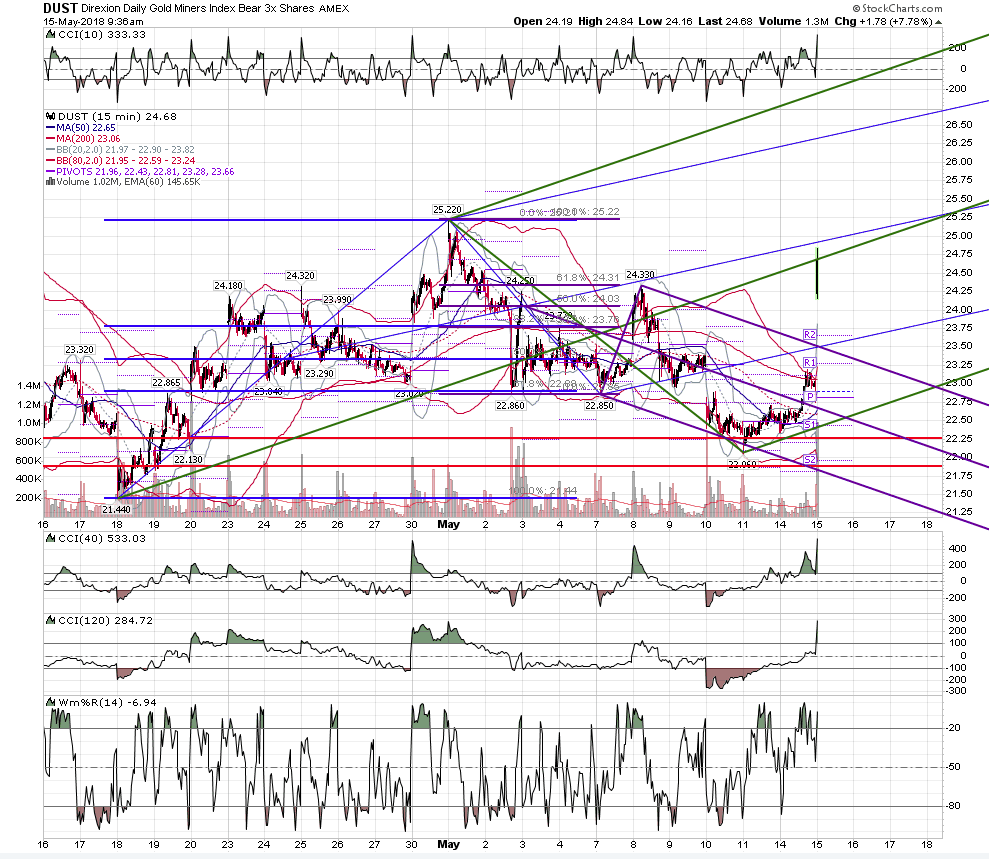
dust then and now - exited after the open
Click image for original size
Click image for original size
RA
rat89
Rep: 0
Posts: 7,015
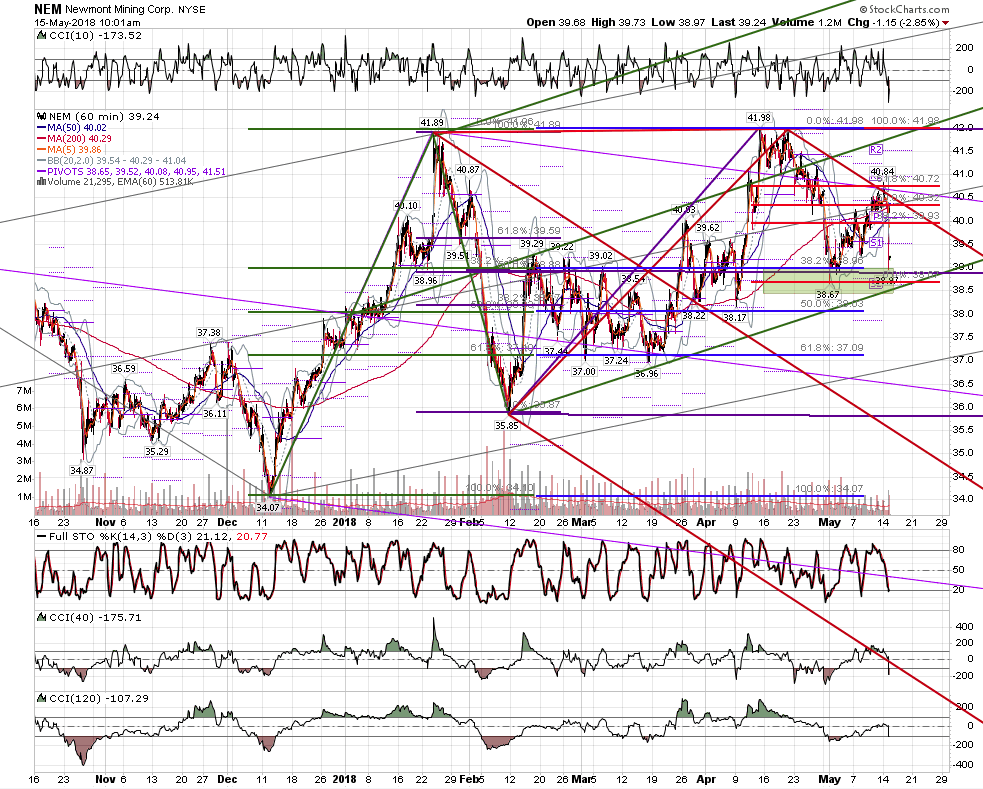
nem 60 - as bearish as this looks, given the reversal yesterday at the .618, nem has a key fib zone in the 38.90 area
34.07 - 41.98 = .382 at 38.96
35.85 - 41.98 = .50 at 38.92
36.96 - 41.98 = .618 at 38.88
38.67 - 40.84 = .886 at 38.92
34.07 - 41.98 = .382 at 38.96
35.85 - 41.98 = .50 at 38.92
36.96 - 41.98 = .618 at 38.88
38.67 - 40.84 = .886 at 38.92
Click image for original size
AL
albert
Rep: 99
Posts: 3,094
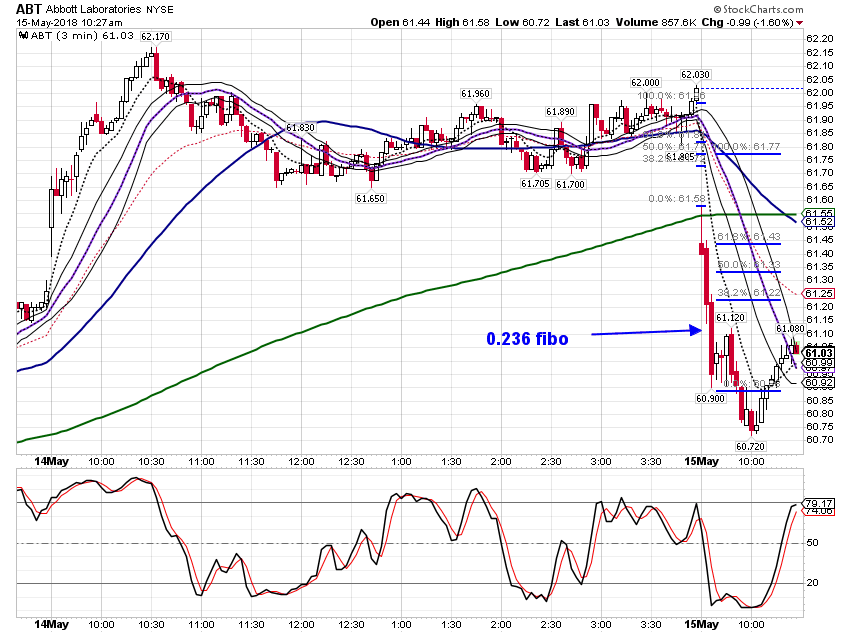
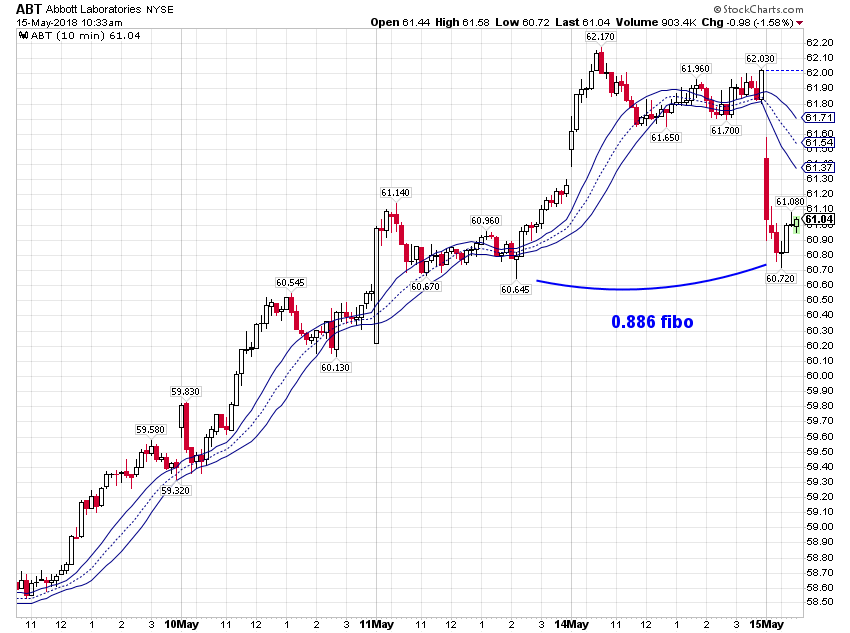
Paper trading. Made a bit buying (and selling) 2 ABT puts. The approach I am using gives some wins, but they are "marginally" profitable, and barely cover commission for trade (if at all). Still learning, and I have a long way to go! I think I need to focus more on fewer candidates, AND, I need to look to the left more before I enter a trade to see if there are any clues to indicate where trade under consideration might weaken (like the trade posted here). :--)
Happy Trading.
Al :--)
Click image for original size
Click image for original size
Click image for original size
Happy Trading.
Al :--)
AL
albert
Rep: 99
Posts: 3,094
rat,
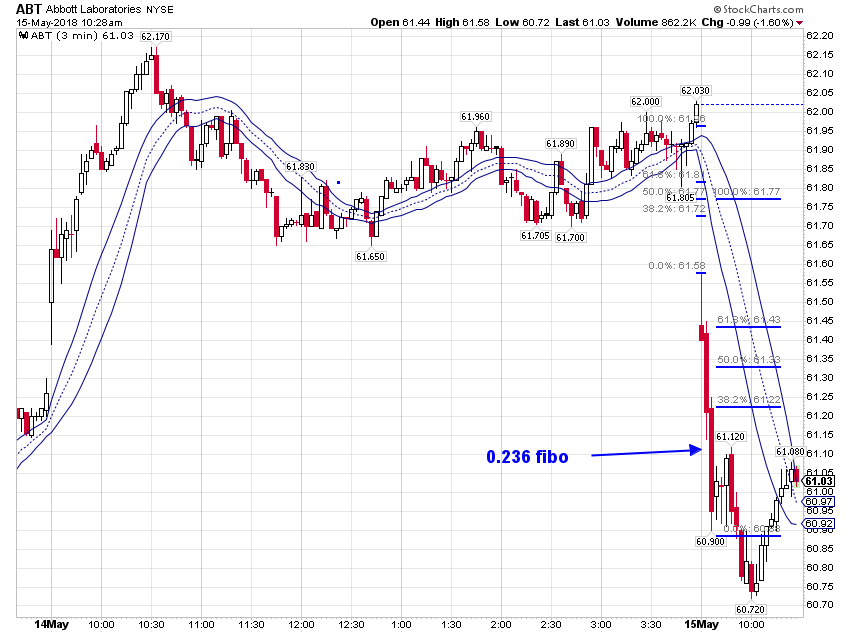
Sure. I am measuring the fibo to the small pullback in the down-move, based on one half of the Gap down(red fibo set). I measure from half-Gap, Point A (61.77), to the farthest extreme of the initial sharp down move (price reverses back up at the third 3-min down candle, Point B, 60.90), and moves up to reverse again at Point C (61.12), The 0.236 fibo actually calculated to be 0.253.
Please let me know if you need more info.
Al :--)
Sure. I am measuring the fibo to the small pullback in the down-move, based on one half of the Gap down(red fibo set). I measure from half-Gap, Point A (61.77), to the farthest extreme of the initial sharp down move (price reverses back up at the third 3-min down candle, Point B, 60.90), and moves up to reverse again at Point C (61.12), The 0.236 fibo actually calculated to be 0.253.
Originally posted by rat89
Al, can you explain the fibs you're showing on the 3 minute chart?
Click image for original size
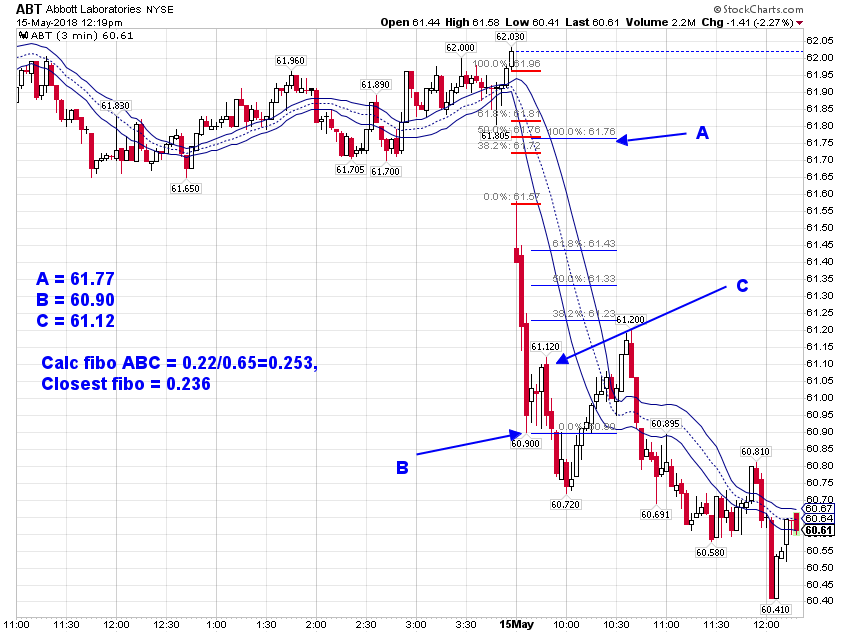
Please let me know if you need more info.
Al :--)
AL
albert
Rep: 99
Posts: 3,094
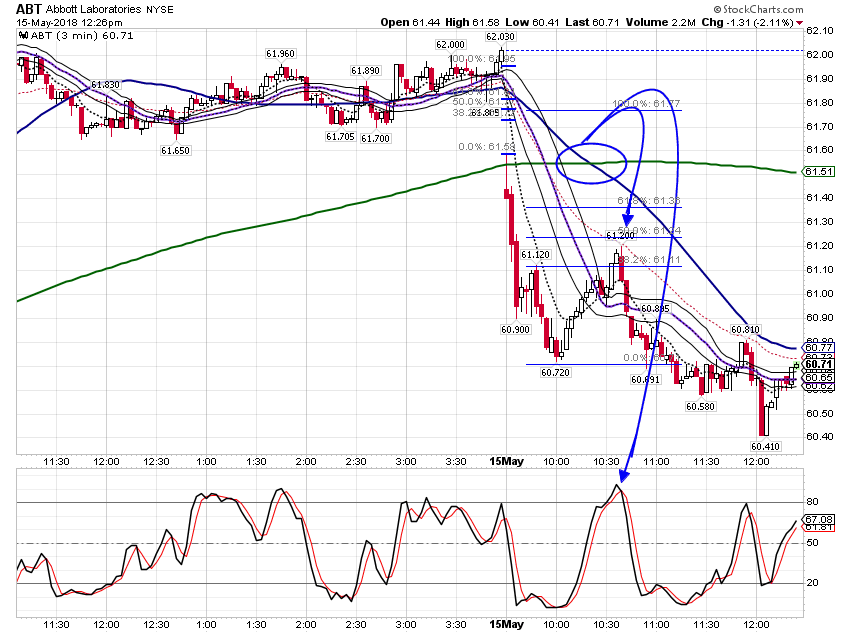
Here is another trade, another put, on ABT, the same stock that I posted earlier. I did not take this trade, and I think this one would have been more profitable than my first paper trade today, if had I taken this one. Price rose more, the 50 and 200 formed a Death Cross, and the first STO OB accompanied a price rise and reversal up at the 34 ema, close to the 0.447 fibo (calc. 0.457). Around Gold Crosses, I look for STO OS and at Death Crosses, I look for STO OB.
Al :--)
Click image for original size
Al :--)
RA
rat89
Rep: 0
Posts: 7,015
I do like measuring from the center of the gap on a day that opens with a gap. No one is looking for those fibs, but the computers are. I don't like not setting the end point at the actual low of the swing though. That seems distracting and a way of perhaps missing the core retracements.
Originally posted by albert
rat,
Sure. I am measuring the fibo to the small pullback in the down-move, based on one half of the Gap down(red fibo set). I measure from half-Gap, Point A (61.77), to the farthest extreme of the initial sharp down move (price reverses back up at the third 3-min down candle, Point B, 60.90), and moves up to reverse again at Point C (61.12), The 0.236 fibo actually calculated to be 0.253.Originally posted by rat89
Al, can you explain the fibs you're showing on the 3 minute chart?
Click image for original size
Please let me know if you need more info.
Al :--)
AL
albert
Rep: 99
Posts: 3,094
LOL. My broker's commisssions are really very reasonable. I think my lack of trading ability is more the cause of any "thinness" in my margins. Paper trading.
Good Trading,
Al :--)
Good Trading,
Al :--)
AL
albert
Rep: 99
Posts: 3,094
rat,
Thank you for your comments. I will certainly consider your words, and reflect on them. You are an experienced trader.
Good Trading,
Al
Thank you for your comments. I will certainly consider your words, and reflect on them. You are an experienced trader.
Good Trading,
Al
Originally posted by rat89
I do like measuring from the center of the gap on a day that opens with a gap. No one is looking for those fibs, but the computers are. I don't like not setting the end point at the actual low of the swing though. That seems distracting and a way of perhaps missing the core retracements.
Originally posted by albert
rat,
Sure. I am measuring the fibo to the small pullback in the down-move, based on one half of the Gap down(red fibo set). I measure from half-Gap, Point A (61.77), to the farthest extreme of the initial sharp down move (price reverses back up at the third 3-min down candle, Point B, 60.90), and moves up to reverse again at Point C (61.12), The 0.236 fibo actually calculated to be 0.253.Originally posted by rat89
Al, can you explain the fibs you're showing on the 3 minute chart?
Click image for original size
Please let me know if you need more info.
Al :--)
AL
albert
Rep: 99
Posts: 3,094
Paper trading. Bought calls for DATA, TRN, and XLI. Bought a put for FB. Made a little on two, broke even on one (not counting commissions), and bungled one for a loss (fumblng fingers) LOL.
Bungled this one by selling by mistake, at the wrong time. ABC fibo = 0.382 (0.400 calc), X for X*AB = CD is 0.618, X' = 1.128, X ''= 1.460
ABC fibo = 0.618 (0.598 calc)
ABC fibo = 0.564 (0.529 calc), X for X*AB=CD is 1.382 Broke even on this one,
ABC fibo = 0.564 (0.567 calc), X for X*AB=CD is 1.618
Good Trading and Have a Good Weekend.
Al :--)
Click image for original size
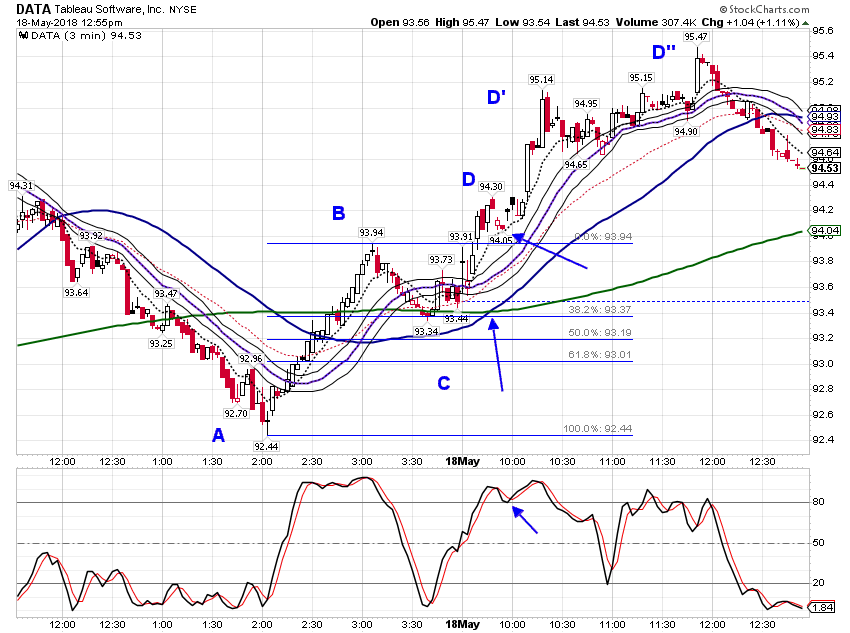
Bungled this one by selling by mistake, at the wrong time. ABC fibo = 0.382 (0.400 calc), X for X*AB = CD is 0.618, X' = 1.128, X ''= 1.460
Click image for original size
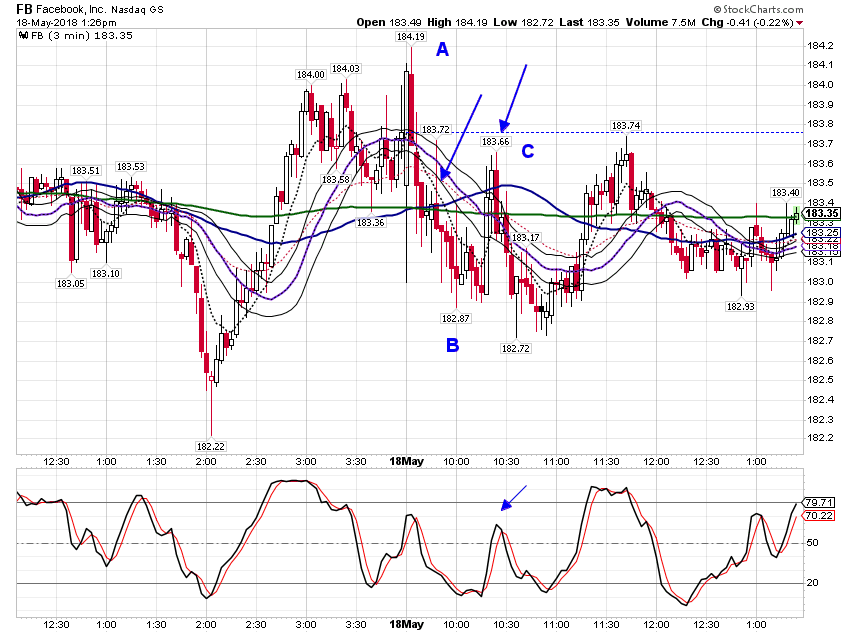
ABC fibo = 0.618 (0.598 calc)
Click image for original size
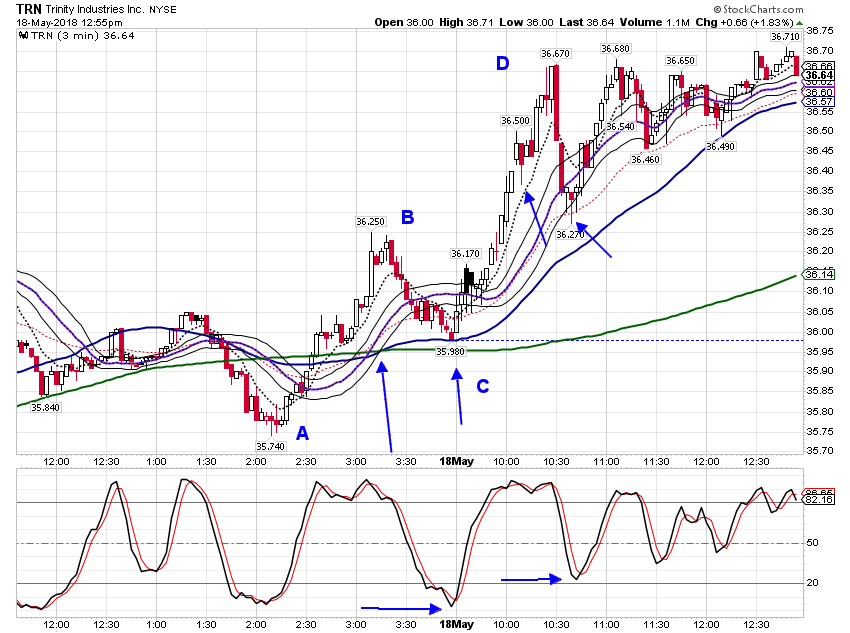
ABC fibo = 0.564 (0.529 calc), X for X*AB=CD is 1.382 Broke even on this one,
Click image for original size
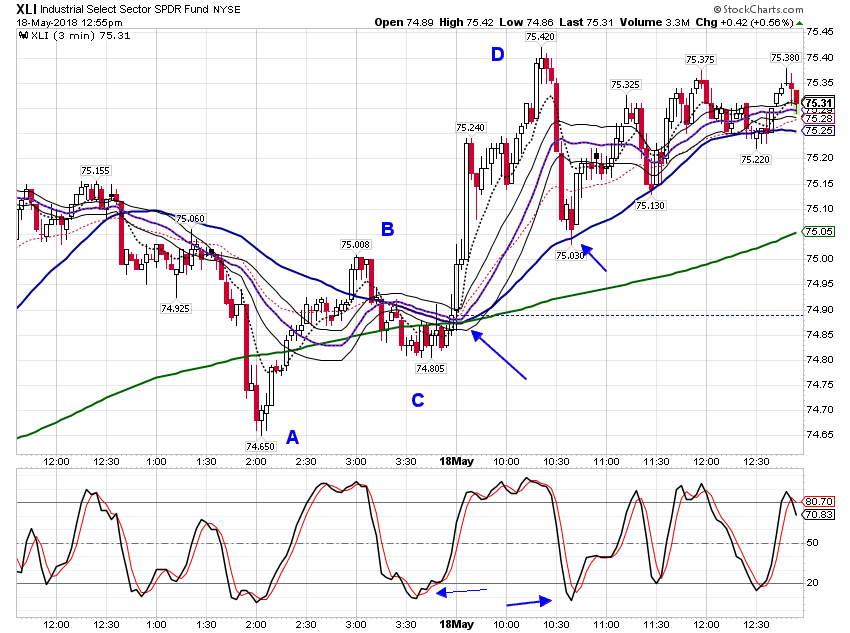
ABC fibo = 0.564 (0.567 calc), X for X*AB=CD is 1.618
Good Trading and Have a Good Weekend.
Al :--)