Starting it off.
Al
RA
rat89
Rep: 0
Posts: 7,015
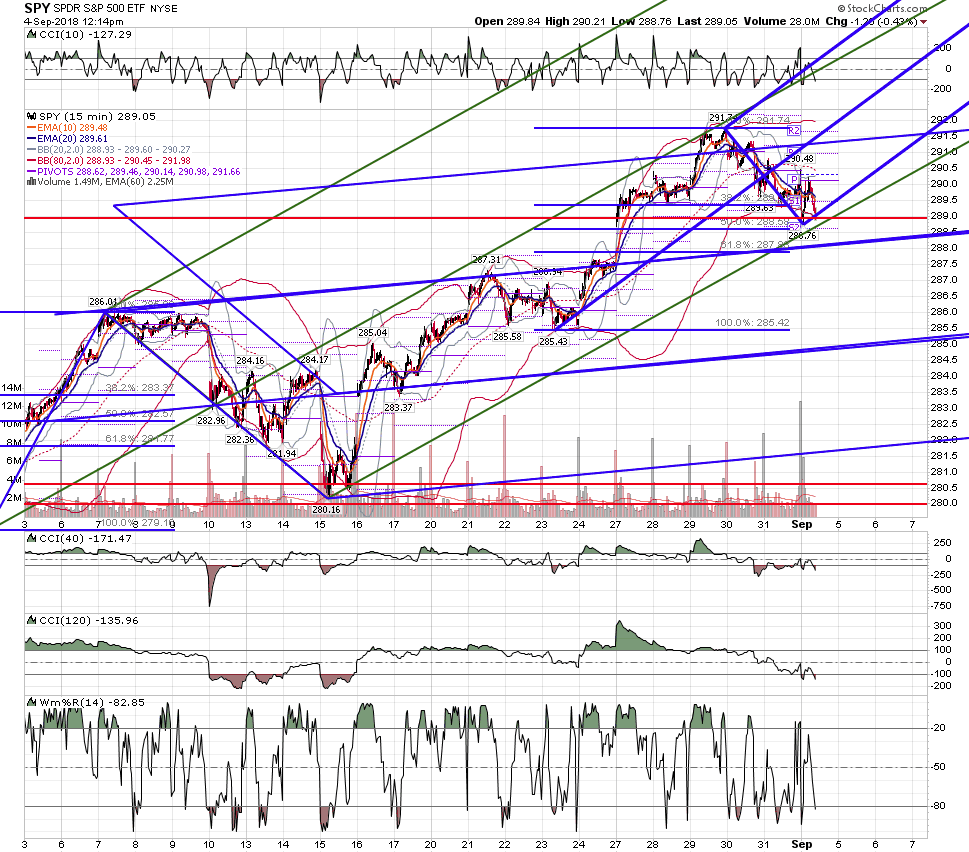
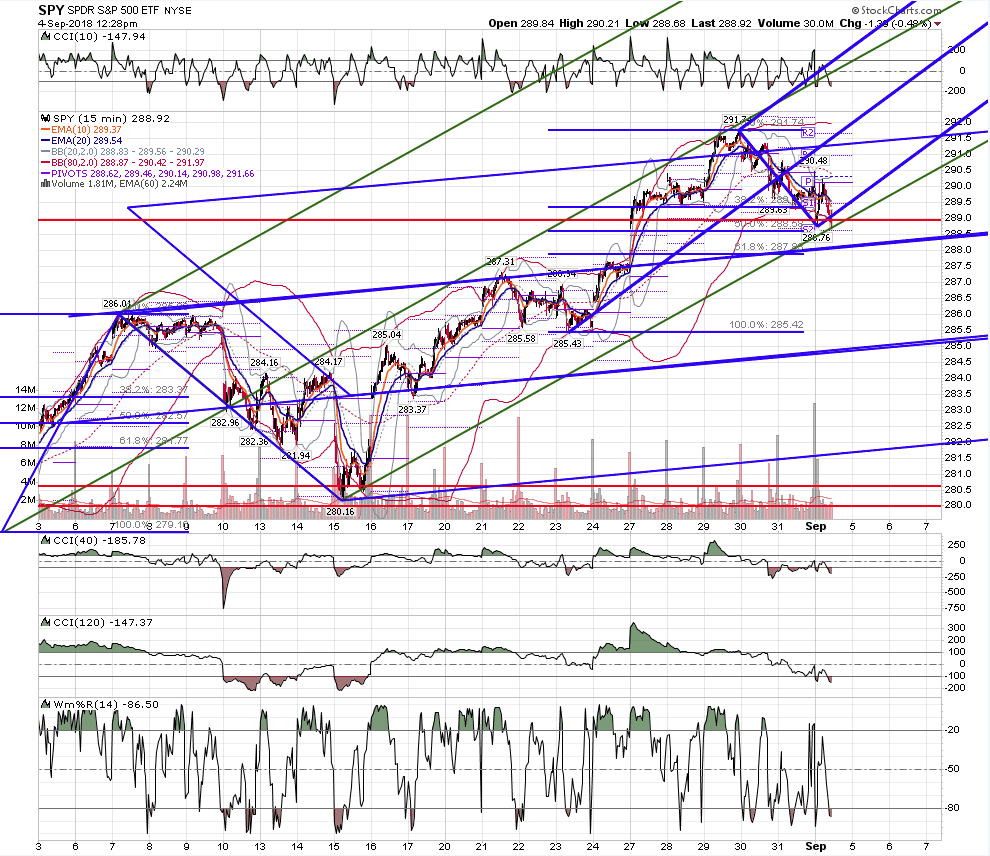
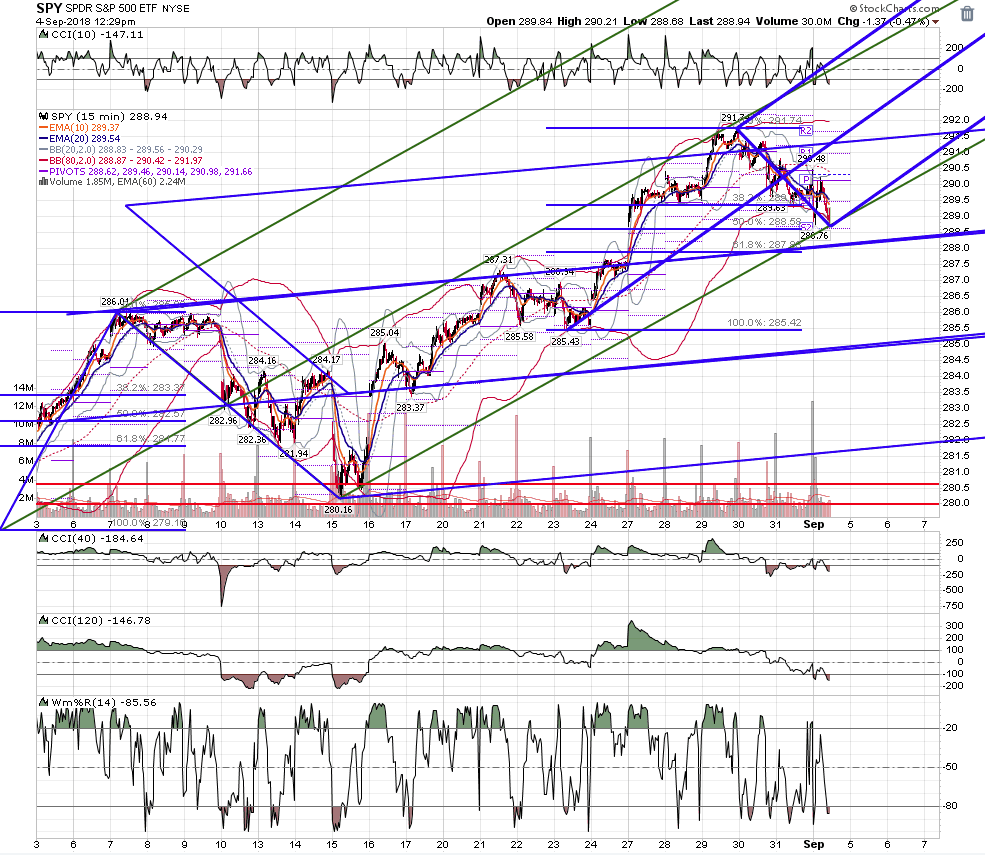
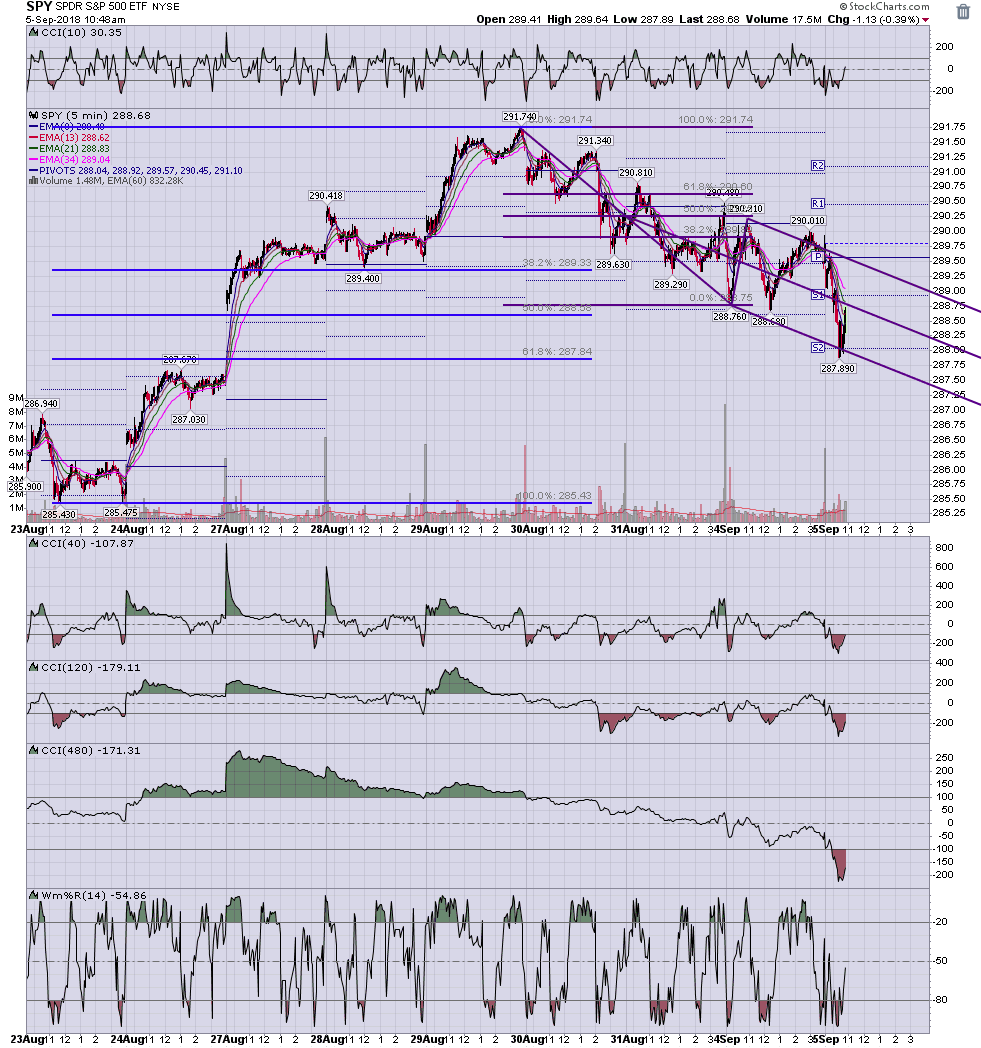
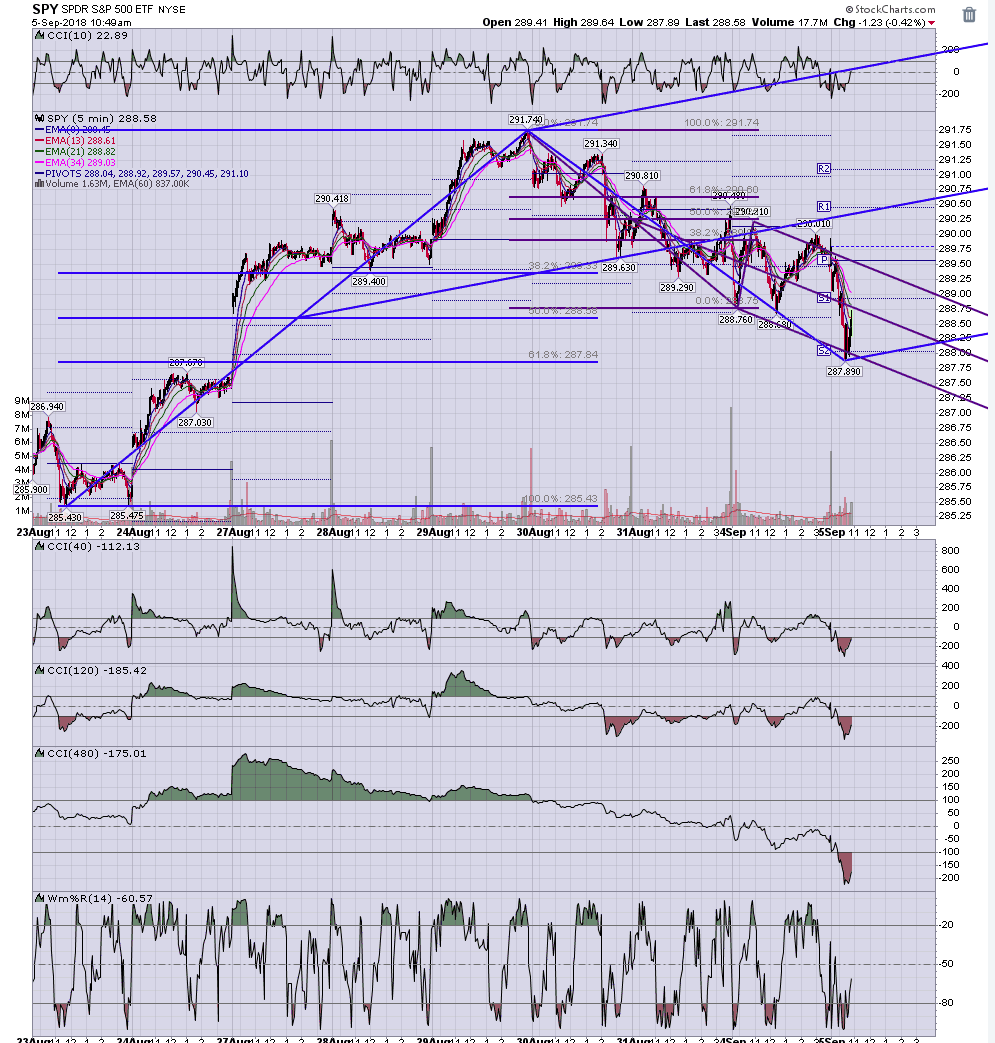
on a day that opens with a gap, trade the .886....at 289.93
Click image for original size
RA
rat89
Rep: 0
Posts: 7,015
Click image for original size
Click image for original size
Click image for original size
RA
rat89
Rep: 0
Posts: 7,015
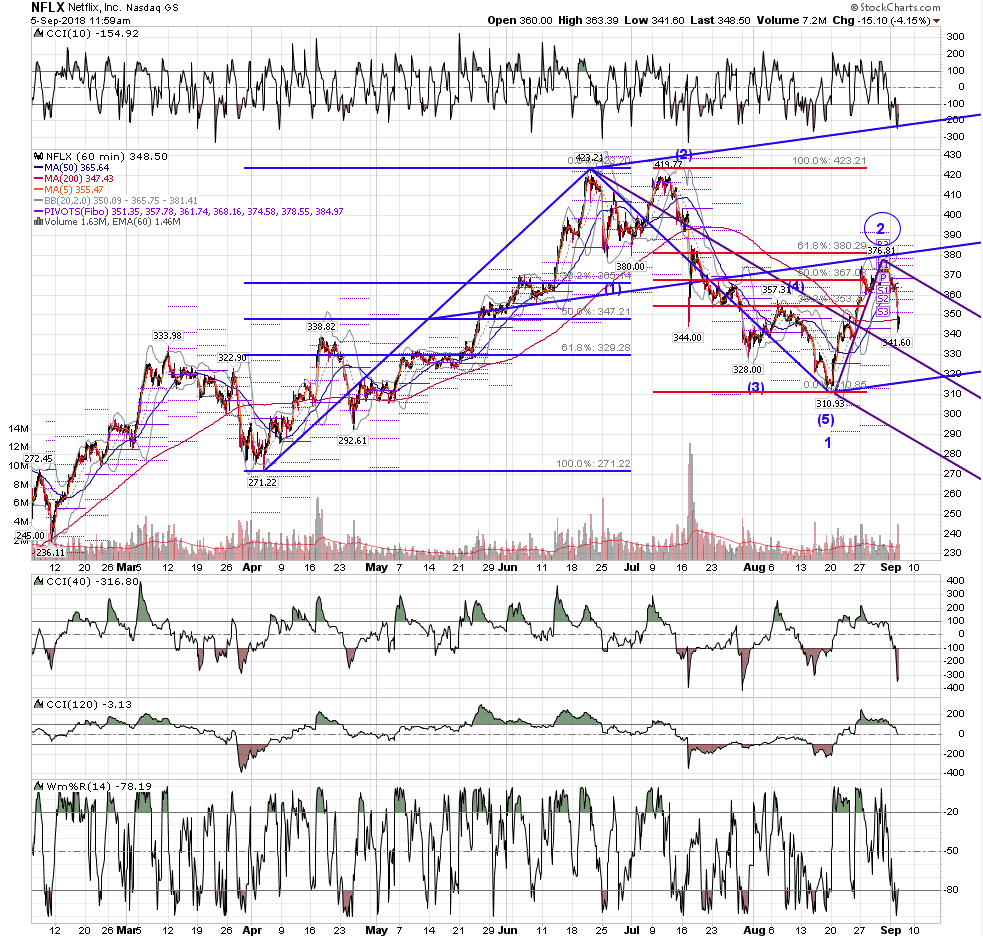
think I posted this Friday, maybe not....good first move here, if the indexes can push up to new highs, there should be a retrace that's shortable again on nflx
Click image for original size
RA
rat89
Rep: 0
Posts: 7,015
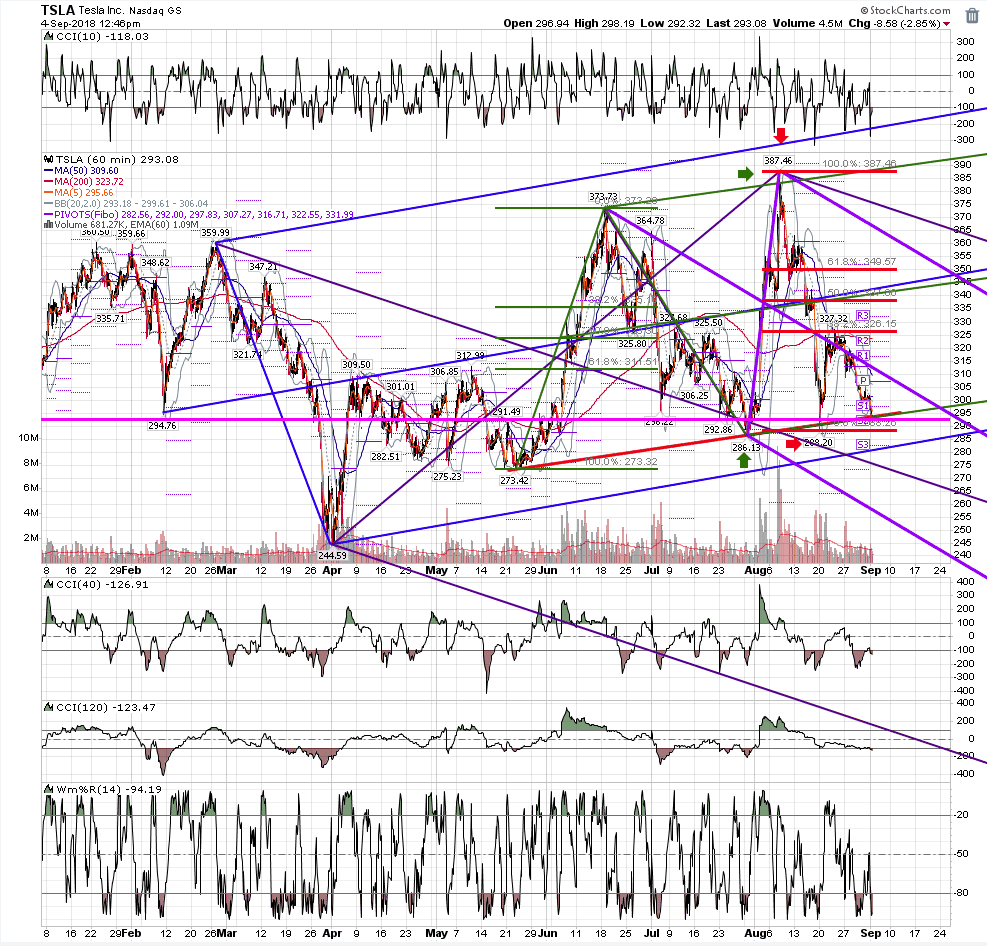
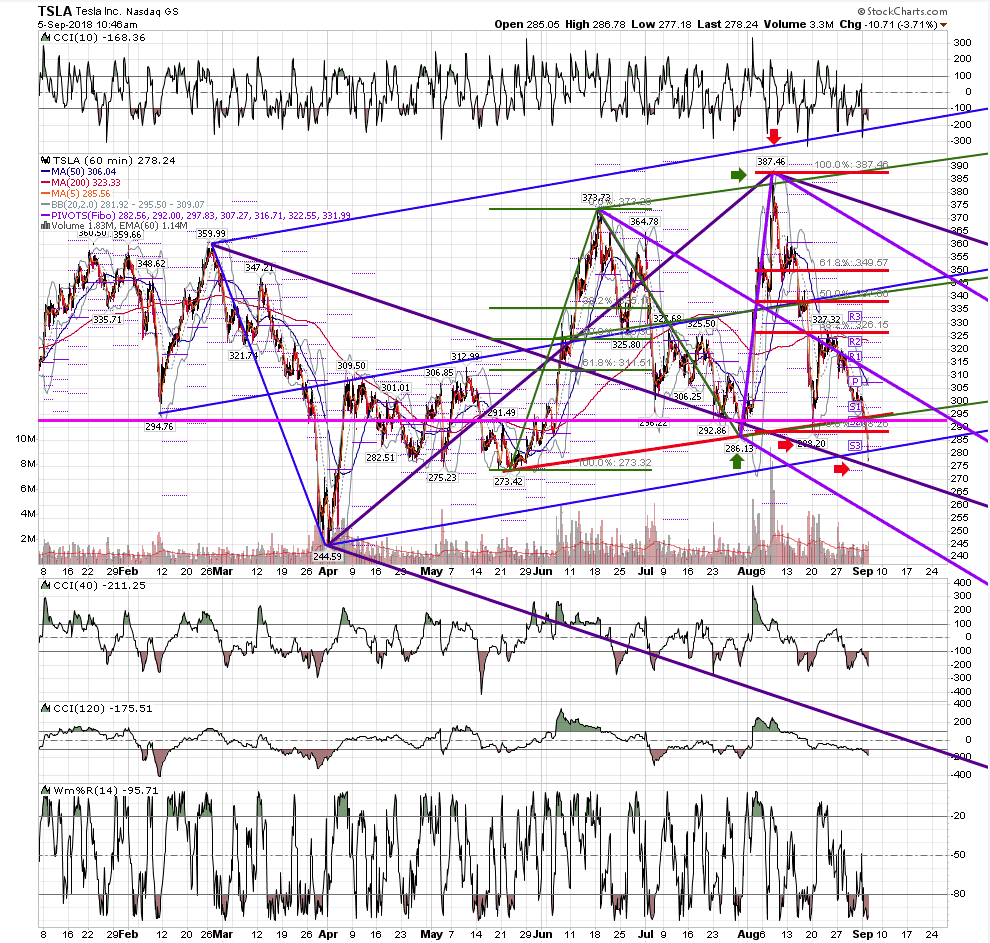
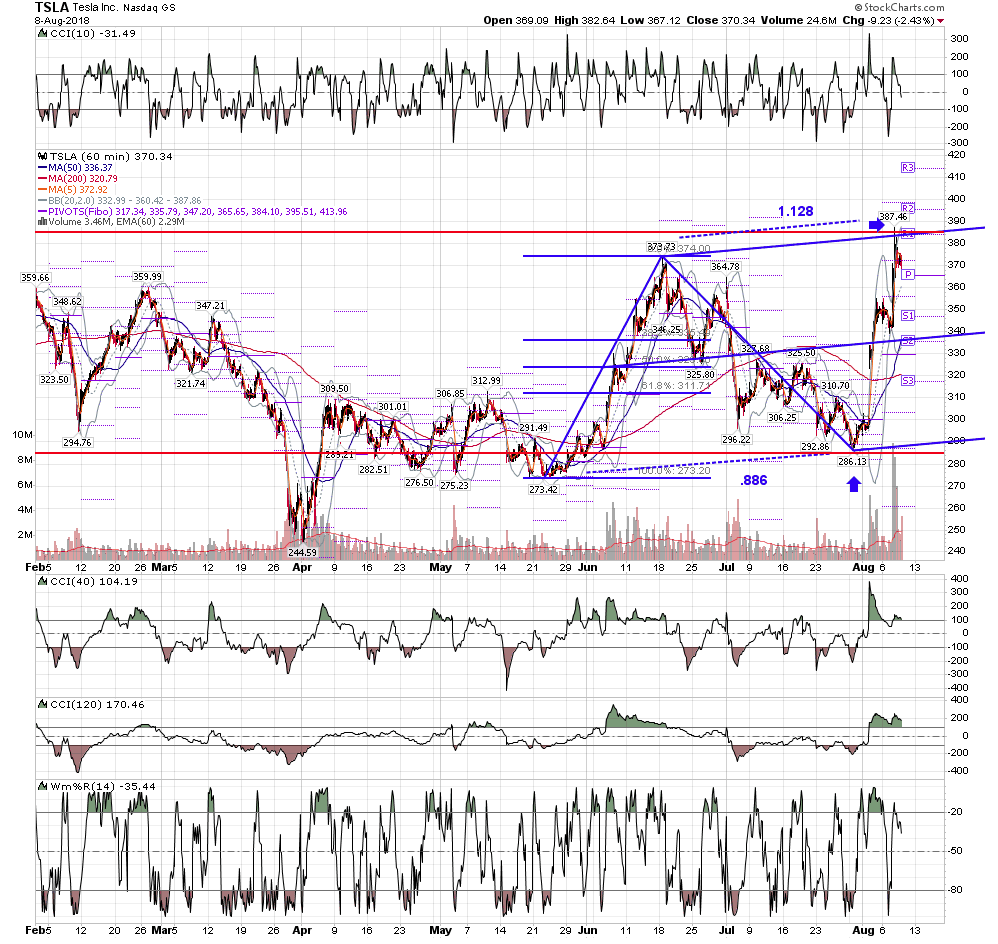
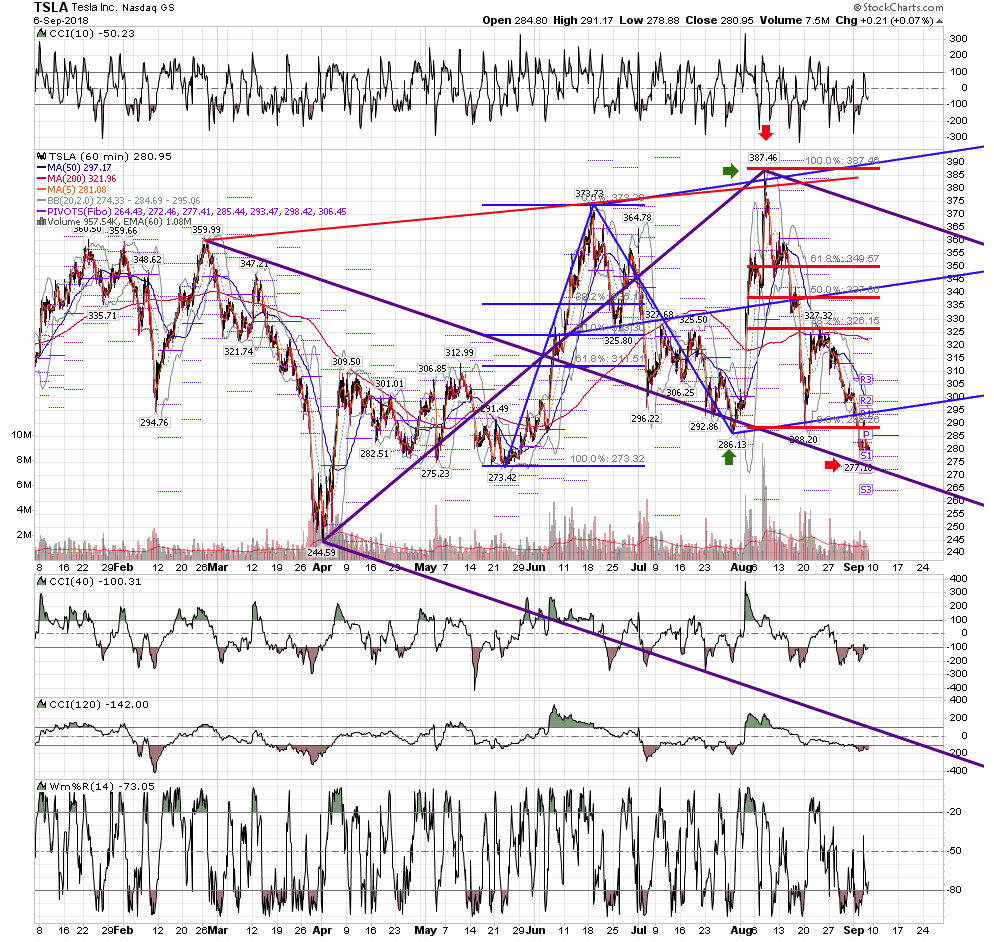
tsla 60 - then and now - this is a lesson in why I am endlessly intrigued by the structure of how fibs and the median line sets interact with price swings.
The first chart shows the move up to 387.46 on august 7. The late July low at 286.13 occurred at an .886 retrace of the prior move up. A modified schiff set, anchored at the mid point of the prior move up, and used for sharp back to back moves, caught price at the upper line on August 7, where the high of 387 was at a 1.128 external retrace of the move down. Note that 1.128 is the inverse of .886, for a kind of symmetry you sometimes see with a move of this nature.
The second chart shows how a short at that high sent price down to the median line area, then bounced to the .382, and then back down to the median line target area.
The fib retracements, and the median lines are sorting out the price action, and setting up trades that be taken with an entry, a stop, and a target. You see this in all time frames. The adherence to these areas suggests that the algo players are in this stock.
Click image for original size
Click image for original size
AL
albert
Rep: 99
Posts: 3,094
rat,
Thank you for your comments. I treat what you say as words of wisdom, and I mean that seriously.
All the best to you,
Al :--)
Thank you for your comments. I treat what you say as words of wisdom, and I mean that seriously.
All the best to you,
Al :--)
Originally posted by rat89
Thanks very much Al,
It took me years to get better at not seeing the forest for the trees. Some people, like roofer, are always focused. For me, not so easy. I don't remember when I've seen anything as elegant as tsla. Perhaps gld at the bull trap at 129.47 in April.
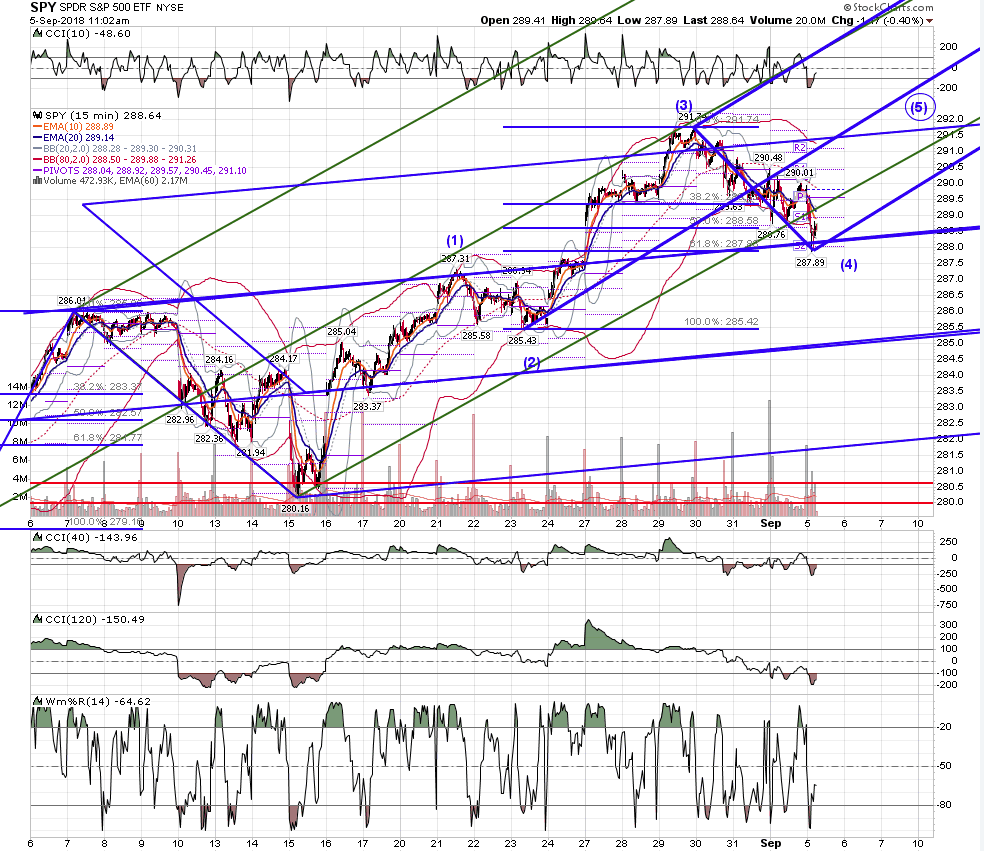
Context is everything. Every once in a while I need to back out to the larger timeframes to see better. Also, looking to see what all the indexes are doing as a group. The fact that dia has lagged this year, but recently been leading feels important, as it needs to make a higher high with the rest for there to be an end to the move up. I see bearish setups in several stocks, but the only indexes that possibly completed are spy and iwm, and I'm not convinced of that. An impulse move up accompanied by a thrust down for gld to around 107 would feel better.
Find a bread and butter trade, based on the context and what you know, and do it over and over until you can do it in your sleep. Trade real money, and keep it on the small side to get comfortable with the emotional part of trading. That's my 2 cents, anyway.
Originally posted by albert
rat,
I studied your TSLA charts and think they are simply amazing! IMO, you certainly have a talent and vision for seeing and drawing meaningful ML sets. They are great! I will study them further this weekend. I did notice a roofer's Double Barrel Shotgun mod setup on TSLA. Good one, rat! I also looked at your A charts and again I am very impressed with your mastery of Elliott Wave! You look at the bigger picture, and that is I something I seldom do, to my detriment. I remember Jim's comments to me on the importance of trading context.
I appreciate your input on my trading efforts. Your comment about my counting being backward is well taken and I agree with it. I believe I am stuck in the back-testing forest and cant see the forest for all the trees, so to speak. I do not know if that makes any sense or not. I keep telling myself that all I am looking for is a profitable trading method, and I believe that a good trader can probably make money on any number or types of methods.
I do not think that I am searching for the Holy Grail of trading, and by that, I mean that I hope that I am not looking for a trading setup that cannot fail. I am sure such a method does not exist. I am energized by what I have been finding lately, and we'll see how long that lasts.
Please keep up the good work.
Best of luck,
Al :--)