MyPivots
Sign In
AL
albert
Rep: 99
Posts: 3,094
Starting it off.

Al
RA
rat89
Rep: 0
Posts: 7,015
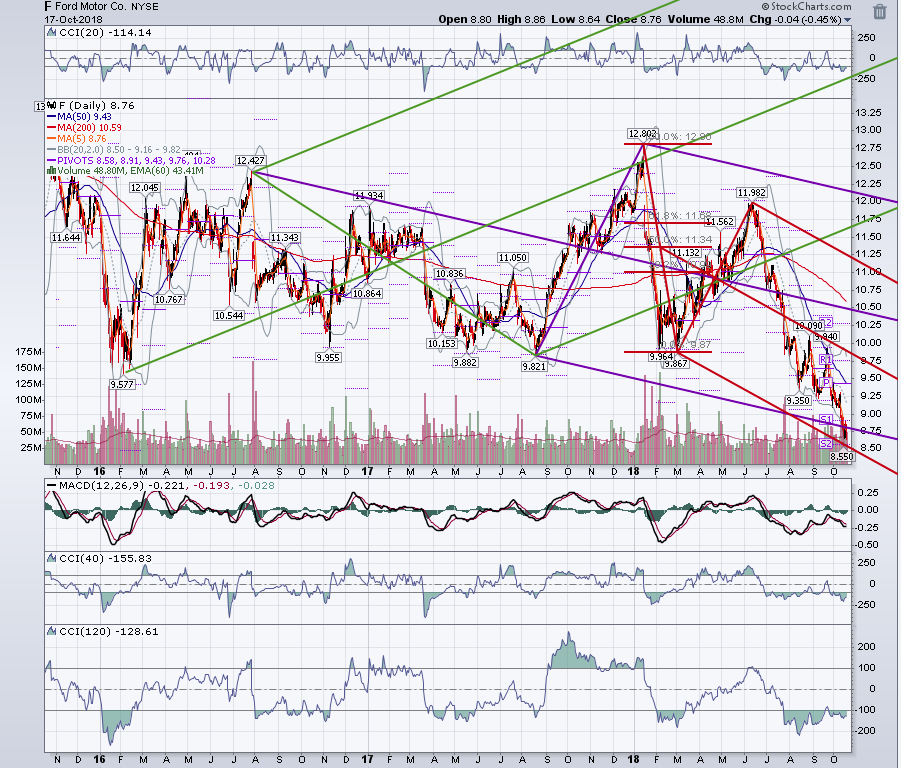
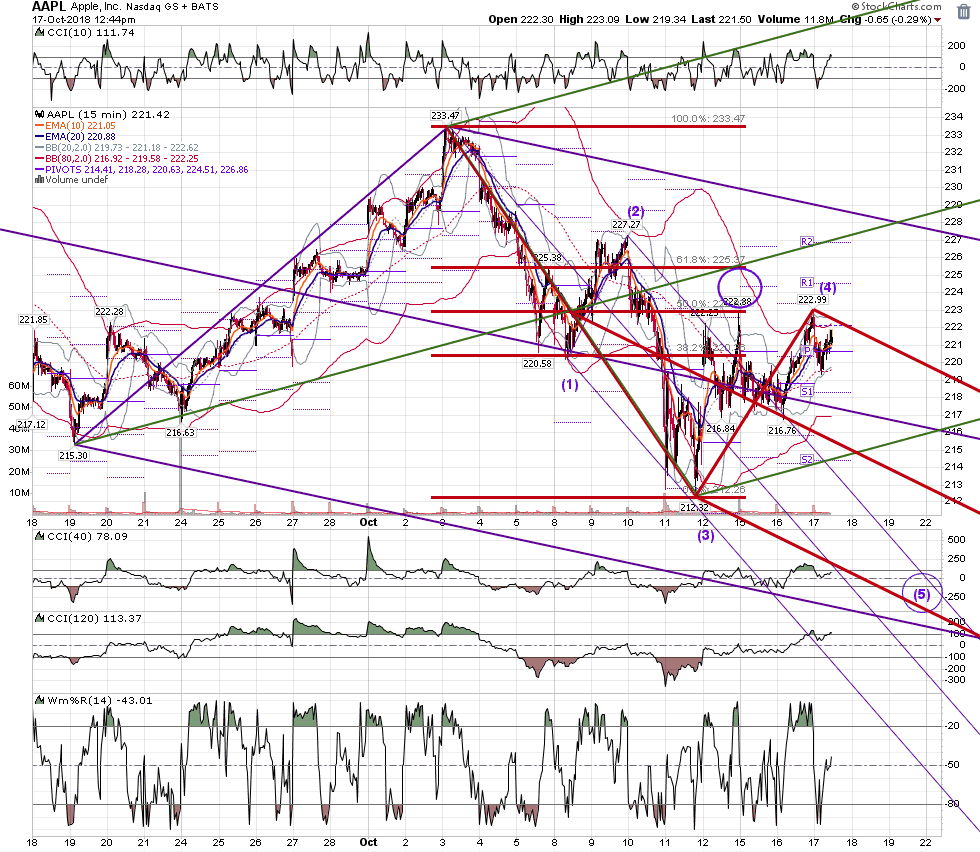
it is quite amazing, but it's there, isn't it? The setups appear to work in all time frames. When we see price of an asset turning very close to it's key numbers, I think that tells us the algo players are in it.

Originally posted by albert

rat,

You make some awesome charts. I mean going back years...amazing. Your charts make it convincingly apparent that price movement is non-random, IMO.

Al :--)
RA
rat89
Rep: 0
Posts: 7,015
Click image for original size
screen shot 2018 10 17 at 12 44 42 pm png
RA
rat89
Rep: 0
Posts: 7,015
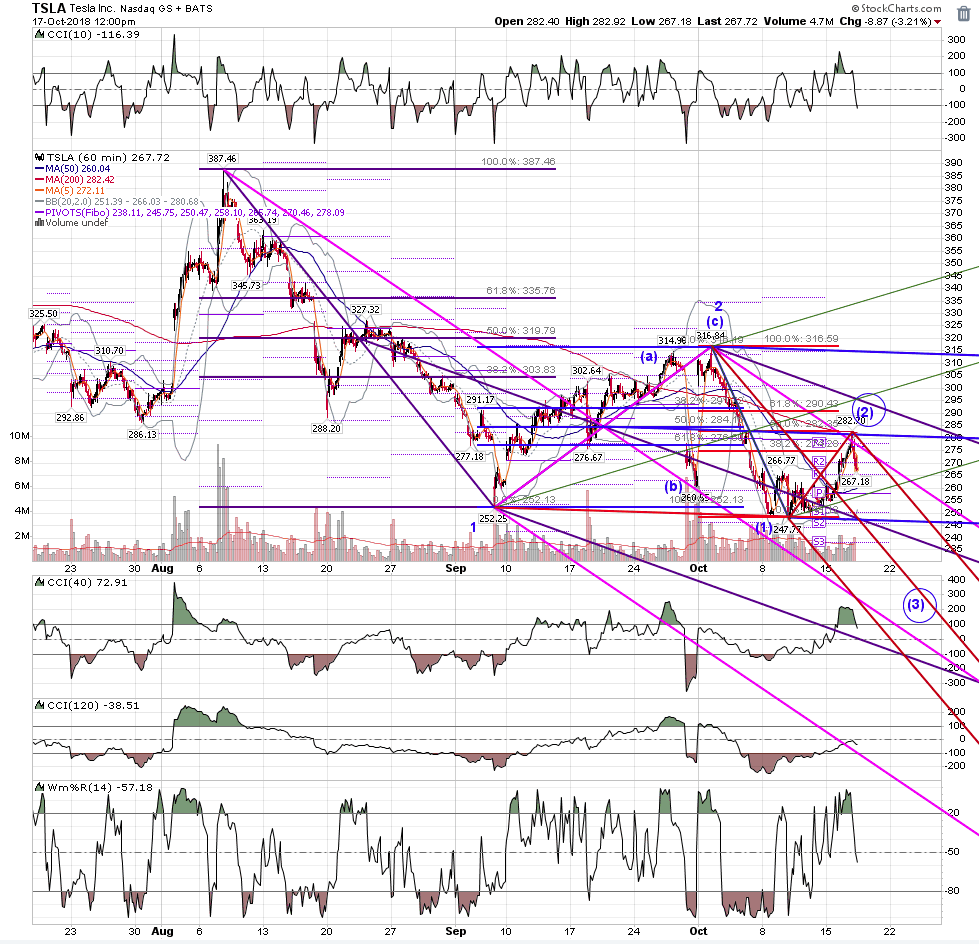
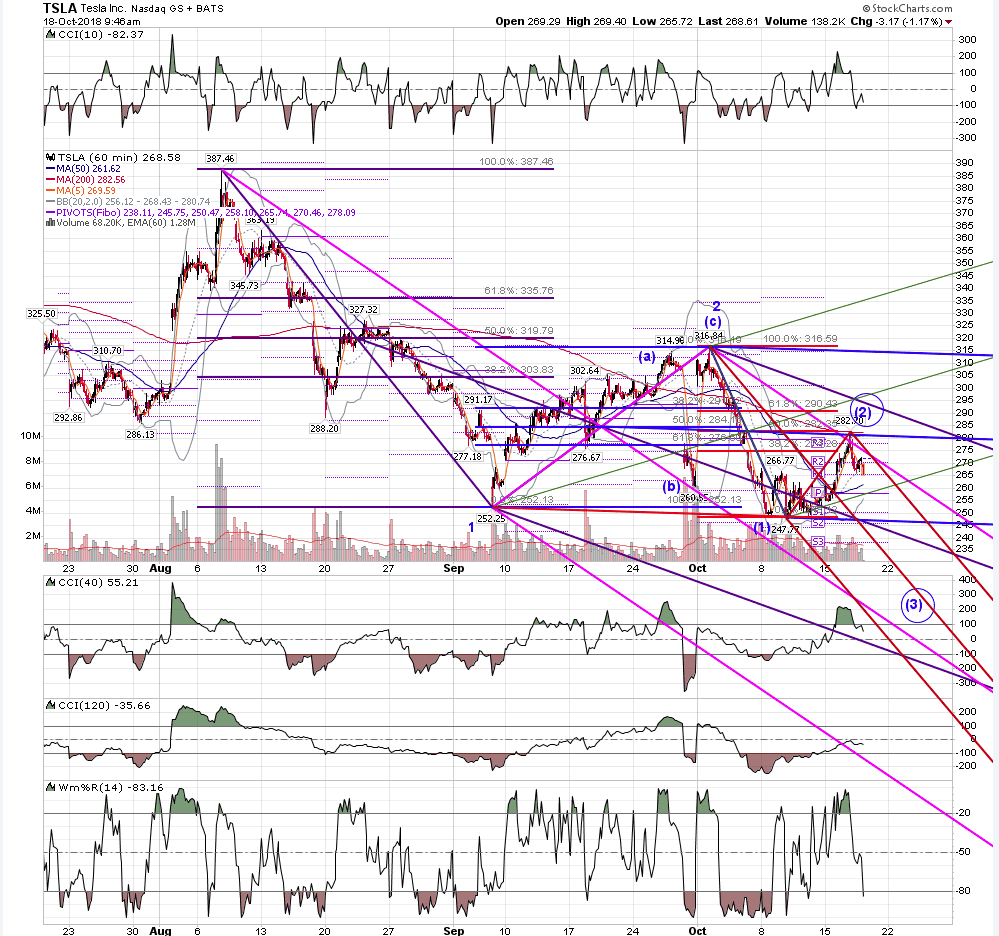
wave (2) complete at .50 and the blue median line, and now (3) of 3 down???

Click image for original size
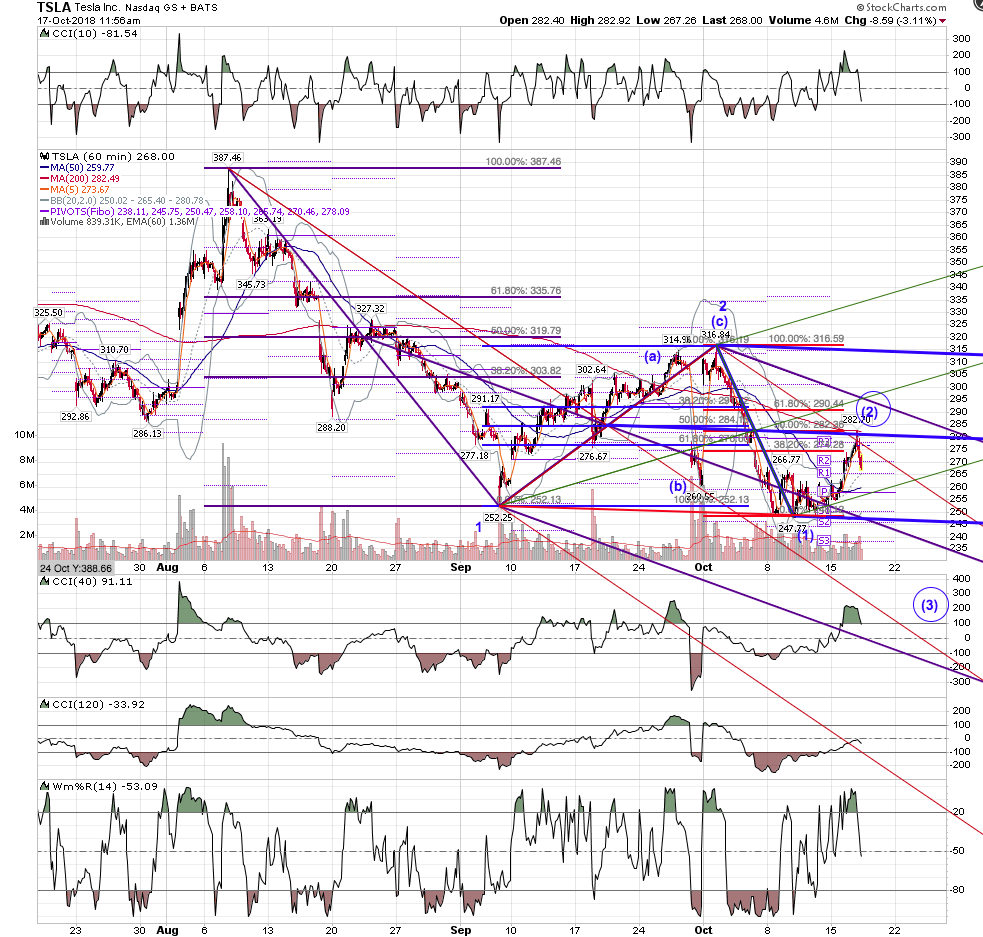
screen shot 2018 10 17 at 11 58 15 am png

Click image for original size
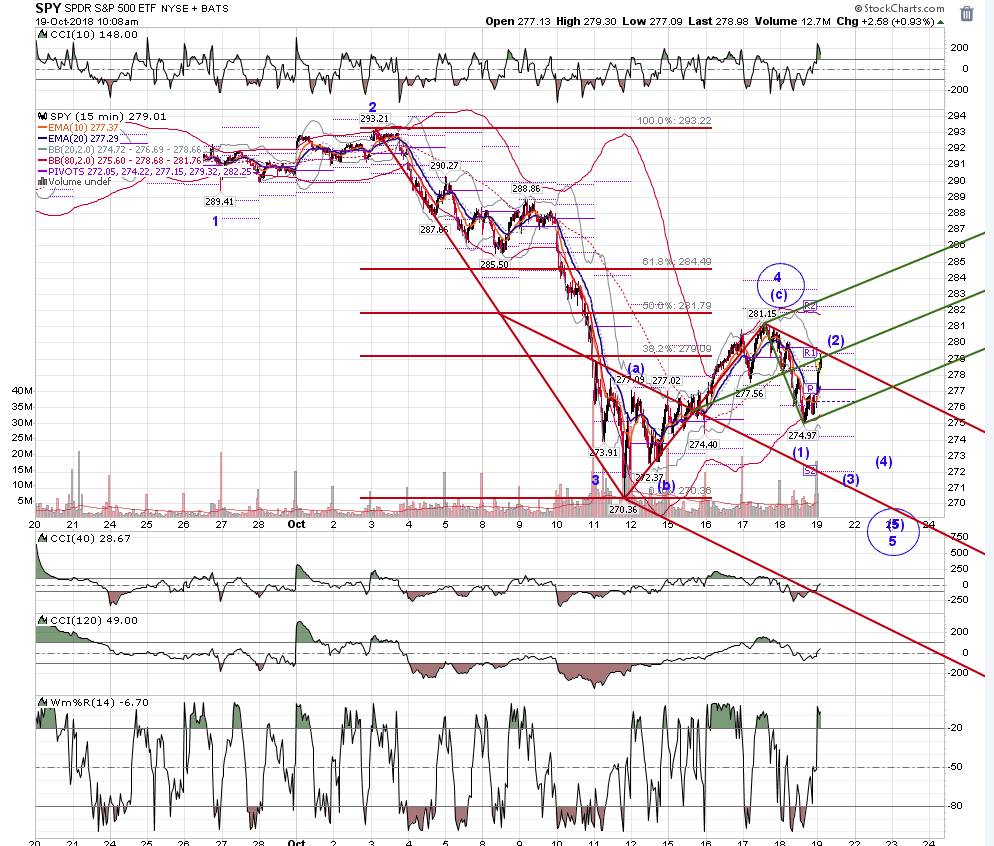
screen shot 2018 10 17 at 12 00 29 pm png
AL
albert
Rep: 99
Posts: 3,094
rat.

Cool work!

Al
RA
rat89
Rep: 0
Posts: 7,015
Click image for original size
screen shot 2018 10 18 at 8 40 54 am png
RA
rat89
Rep: 0
Posts: 7,015
Click image for original size
screen shot 2018 10 18 at 11 57 41 am png
RA
rat89
Rep: 0
Posts: 7,015
Click image for original size
screen shot 2018 10 18 at 9 42 20 am png

Click image for original size
screen shot 2018 10 18 at 9 47 00 am png
AL
albert
Rep: 99
Posts: 3,094
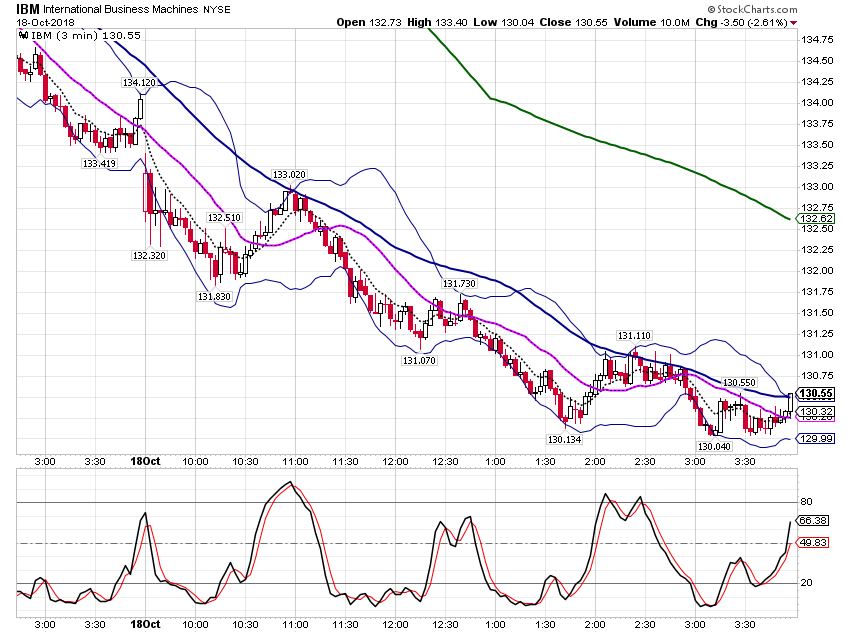
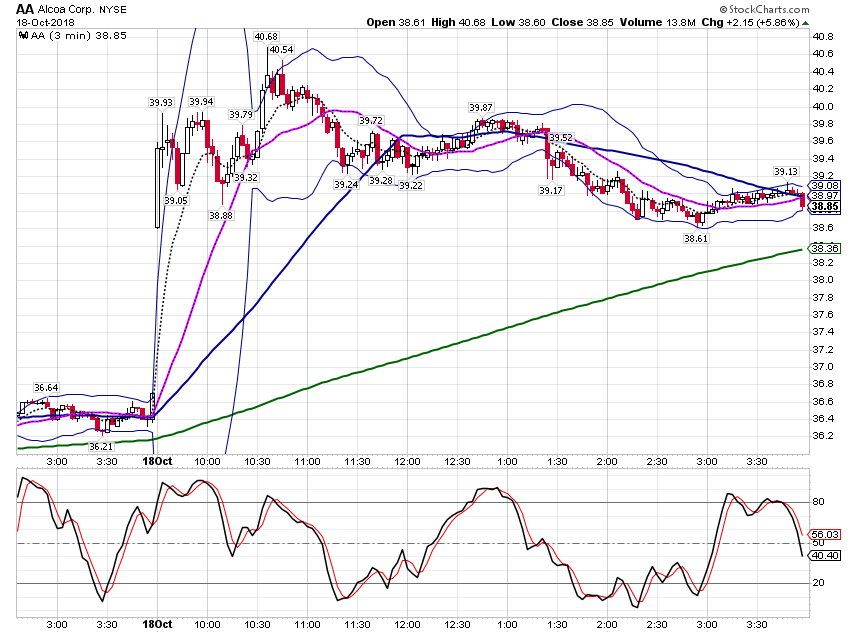
Paper trading. Made some on an IBM put. Lost some on an AA call.


Click image for original size
sc495 png


Click image for original size
sc496 png


Al
RA
rat89
Rep: 0
Posts: 7,015
Click image for original size
screen shot 2018 10 19 at 10 03 12 am png
RA
rat89
Rep: 0
Posts: 7,015
Click image for original size
screen shot 2018 10 19 at 10 08 51 am png
AL
albert
Rep: 99
Posts: 3,094
rat,

Hmmmm....interesting.

Al