MyPivots
Sign In
AL
albert
Rep: 99
Posts: 3,094
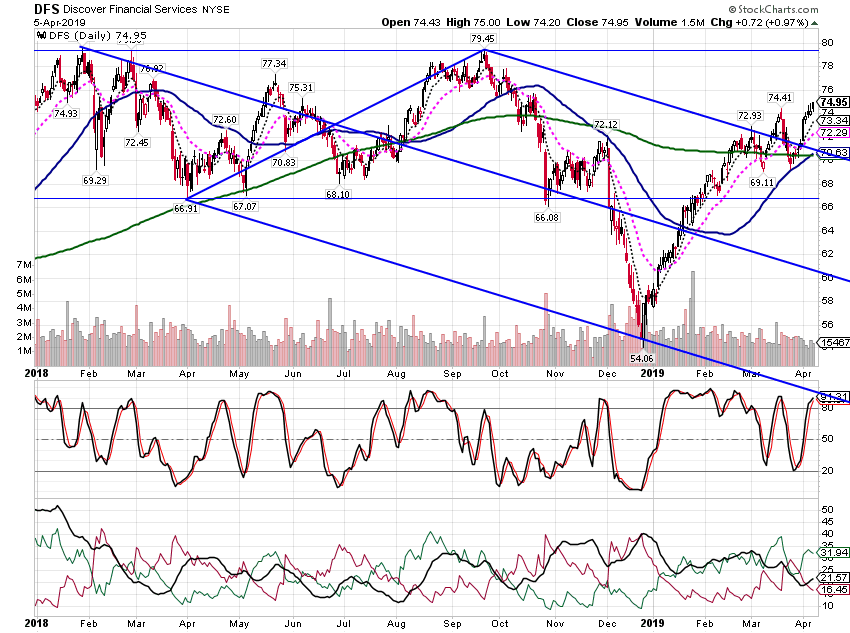
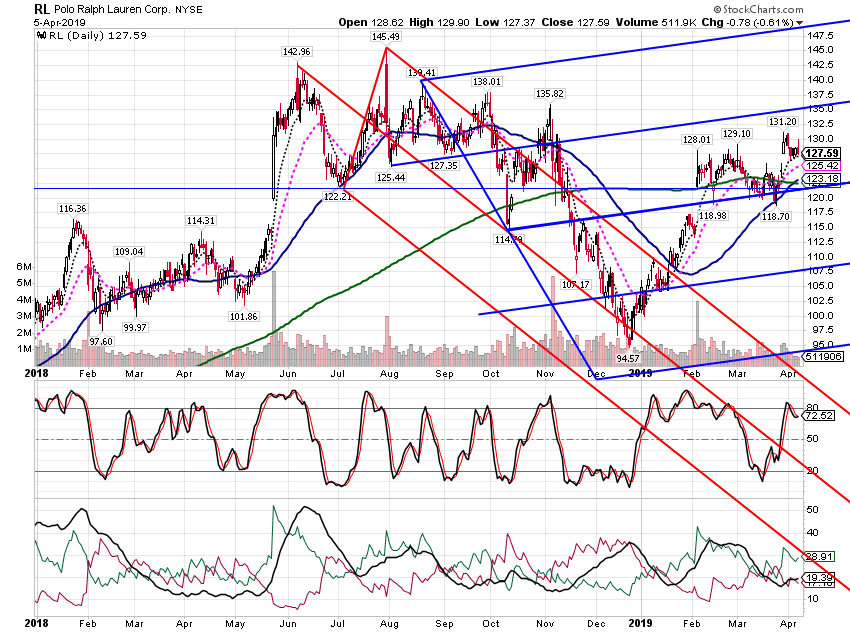
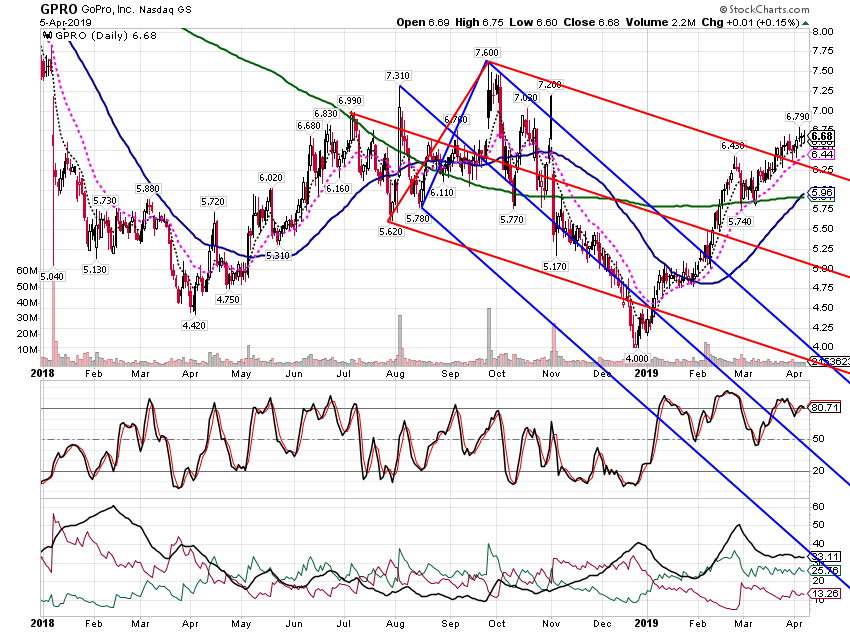
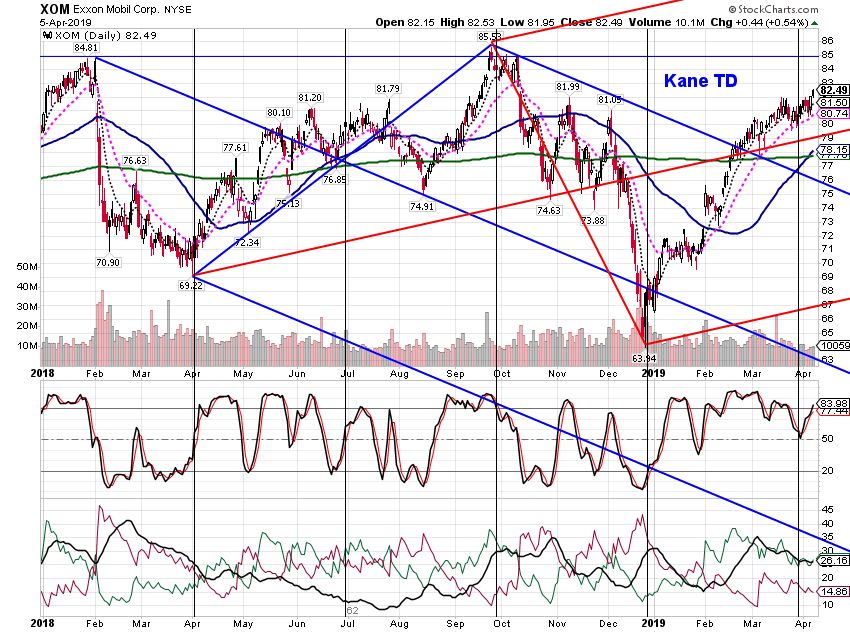
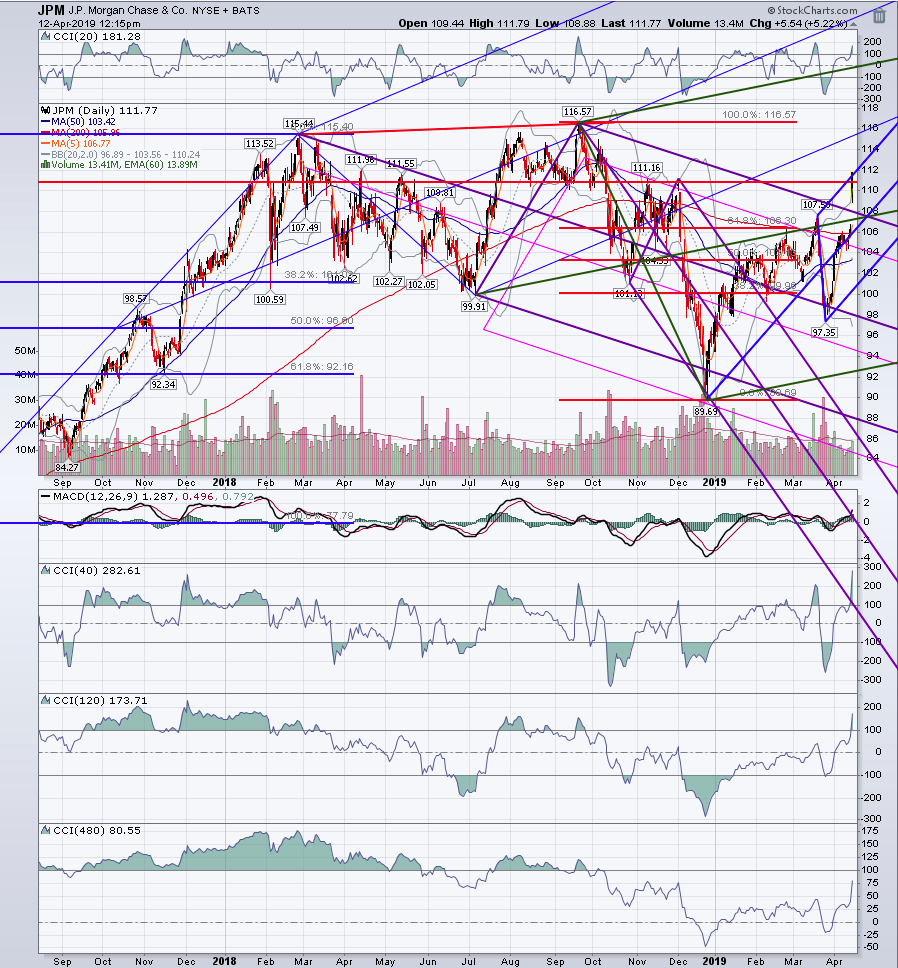
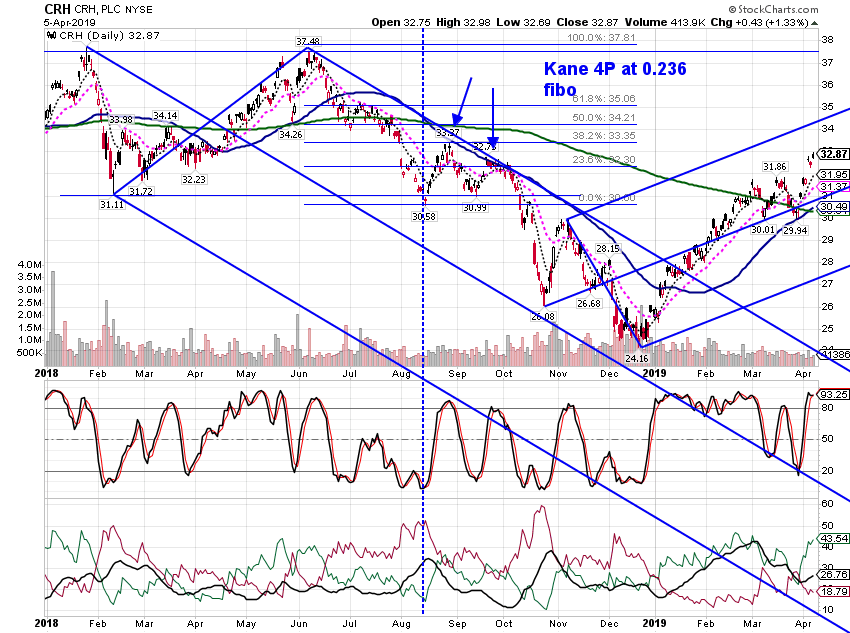
Starting it off. Here are some Double Tops and some Kane ABCDs. Just examples, not traded. I am looking for an edge, or a bread and butter trade.

A :--)l
Click image for original size
sc690 png


Click image for original size
sc691 png


Click image for original size
sc692 png


Click image for original size
sc693 png

Comparing ML sets based on a 3D and a Double Top.

Click image for original size
sc694 png

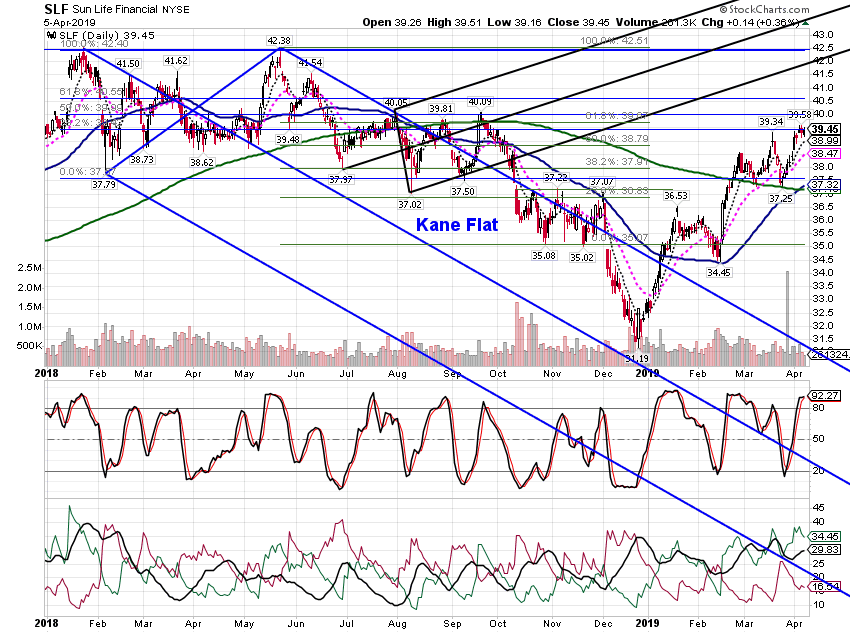
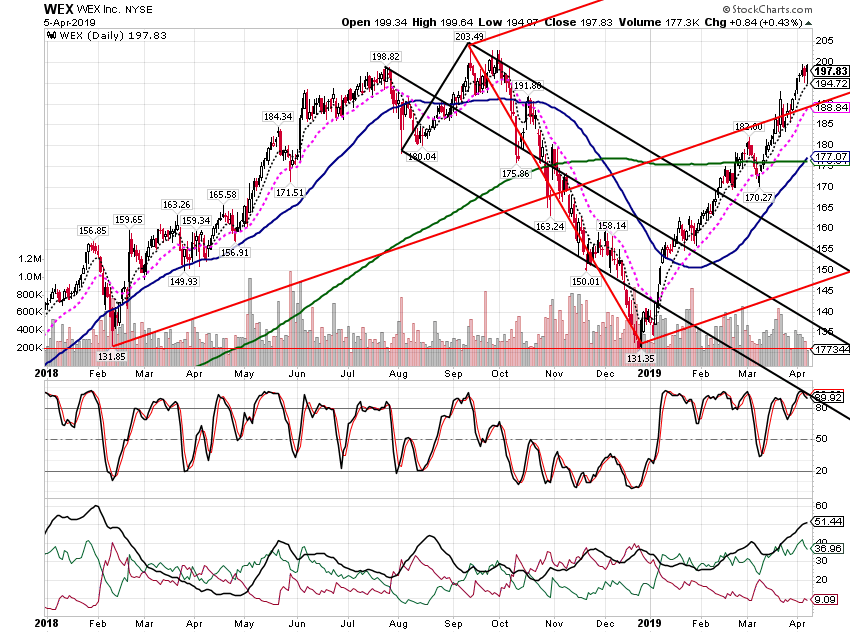
Kane Flat ABCD at Upper ML // of blue ML set.

Click image for original size
sc695 png


Click image for original size
sc696 png


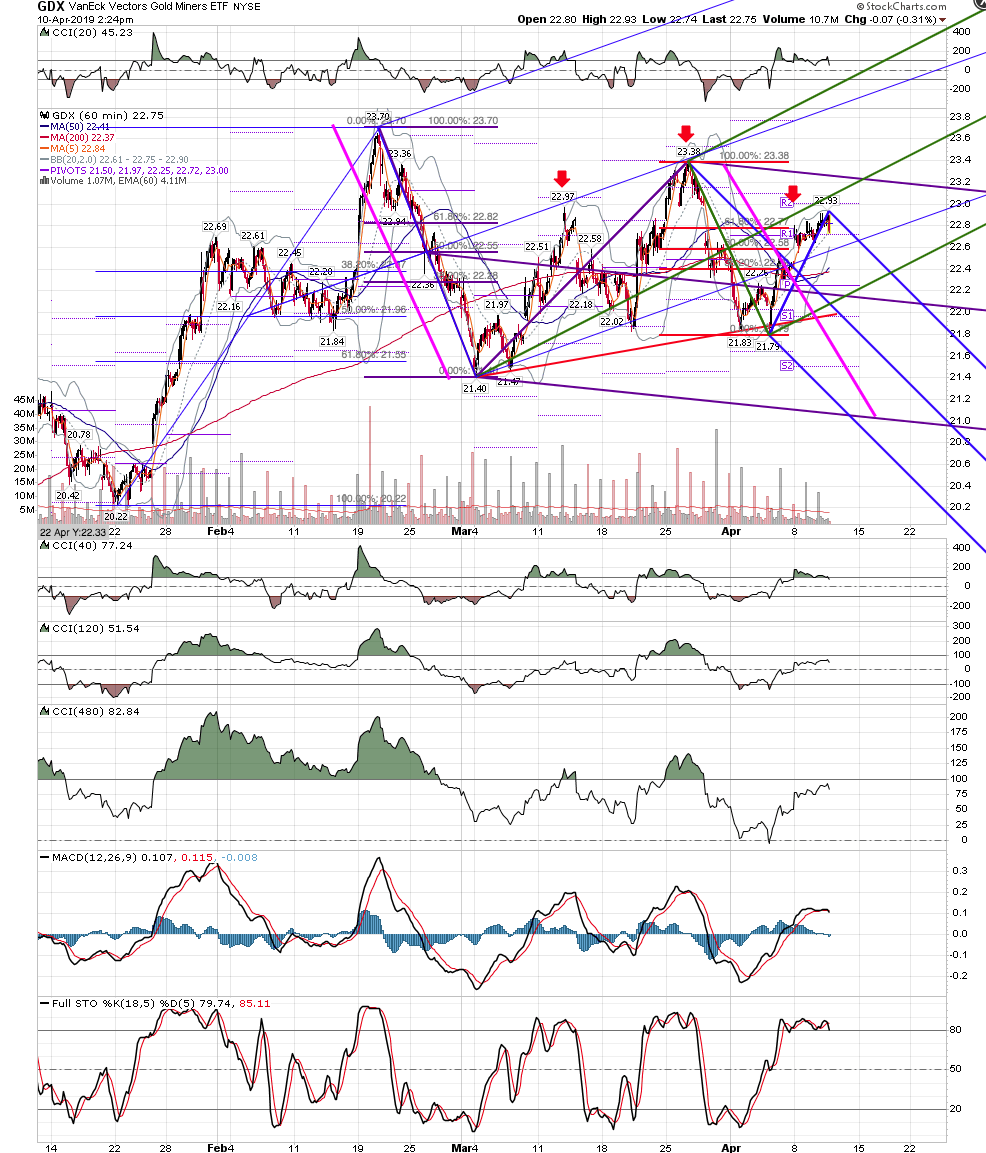
Kane TD completing at 0.618 area.
AL
albert
Rep: 99
Posts: 3,094
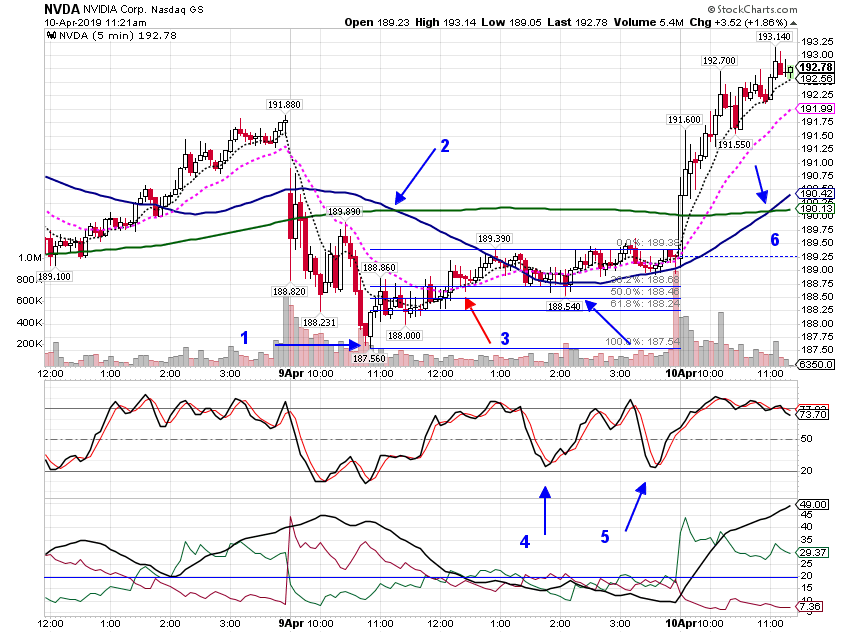
Paper traded this first chart and had a good result. Here is what I think is a good example of a trade I call the "Pocket"
trade.
Al :--)
Click image for original size
sc697 png

1. 5 minute chart. Bottom.
2. Death Cross
3. 8 crosses the 20 up.
4. STO trough. Price reversal at 0.500 fibo.
5. STO trough
6. Gold Cross

Click image for original size
sc698 png

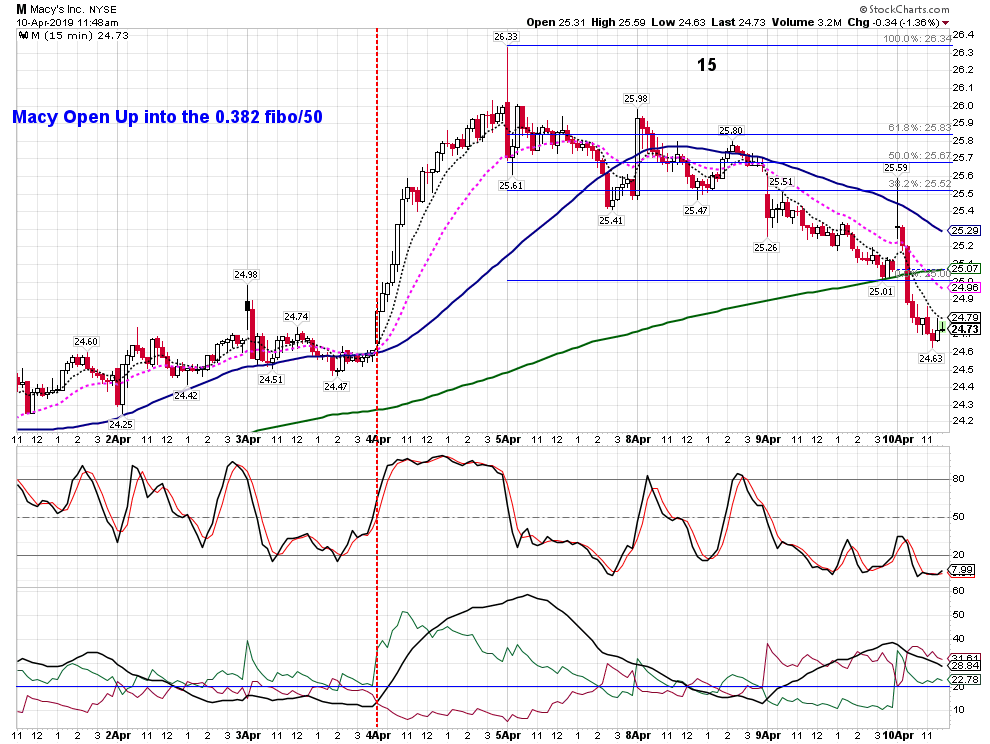
I got suckered into this upward move into the 0.382 fibo/50 reversal. I have got to stop trading foolishly like this!

Click image for original size
sc699 png

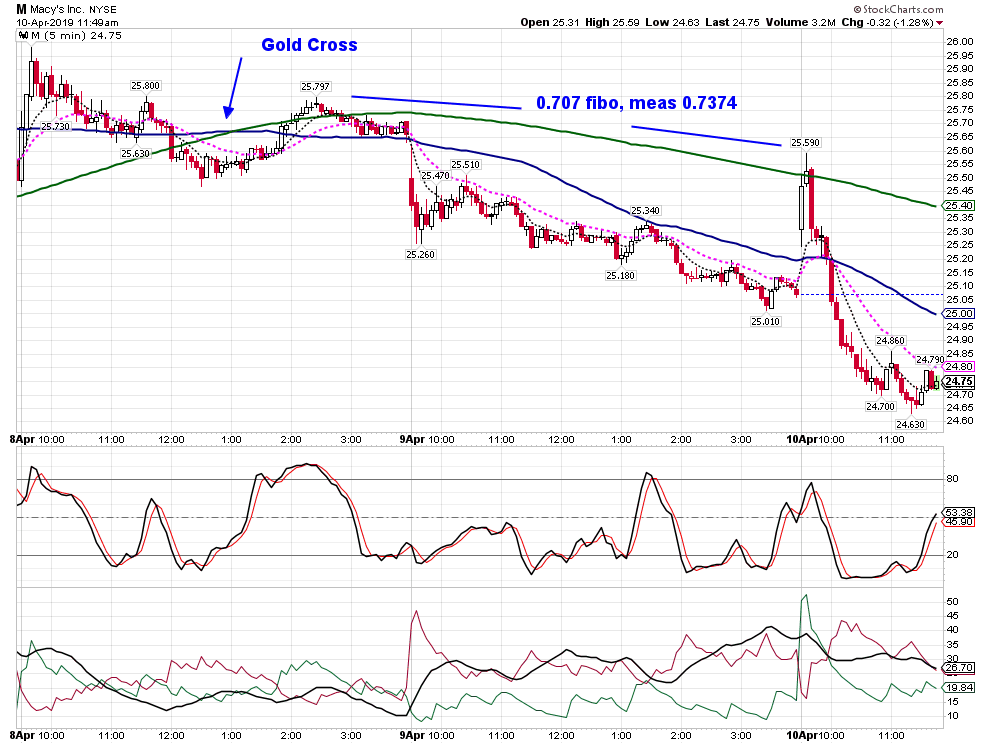
Easy to see the price reversal at the 200 on this chart.

Al
DU
Duane
Rep: 100
Posts: 1,095
Thanks Al. Nice charts also!!!!!
AL
albert
Rep: 99
Posts: 3,094
Originally posted by Duane

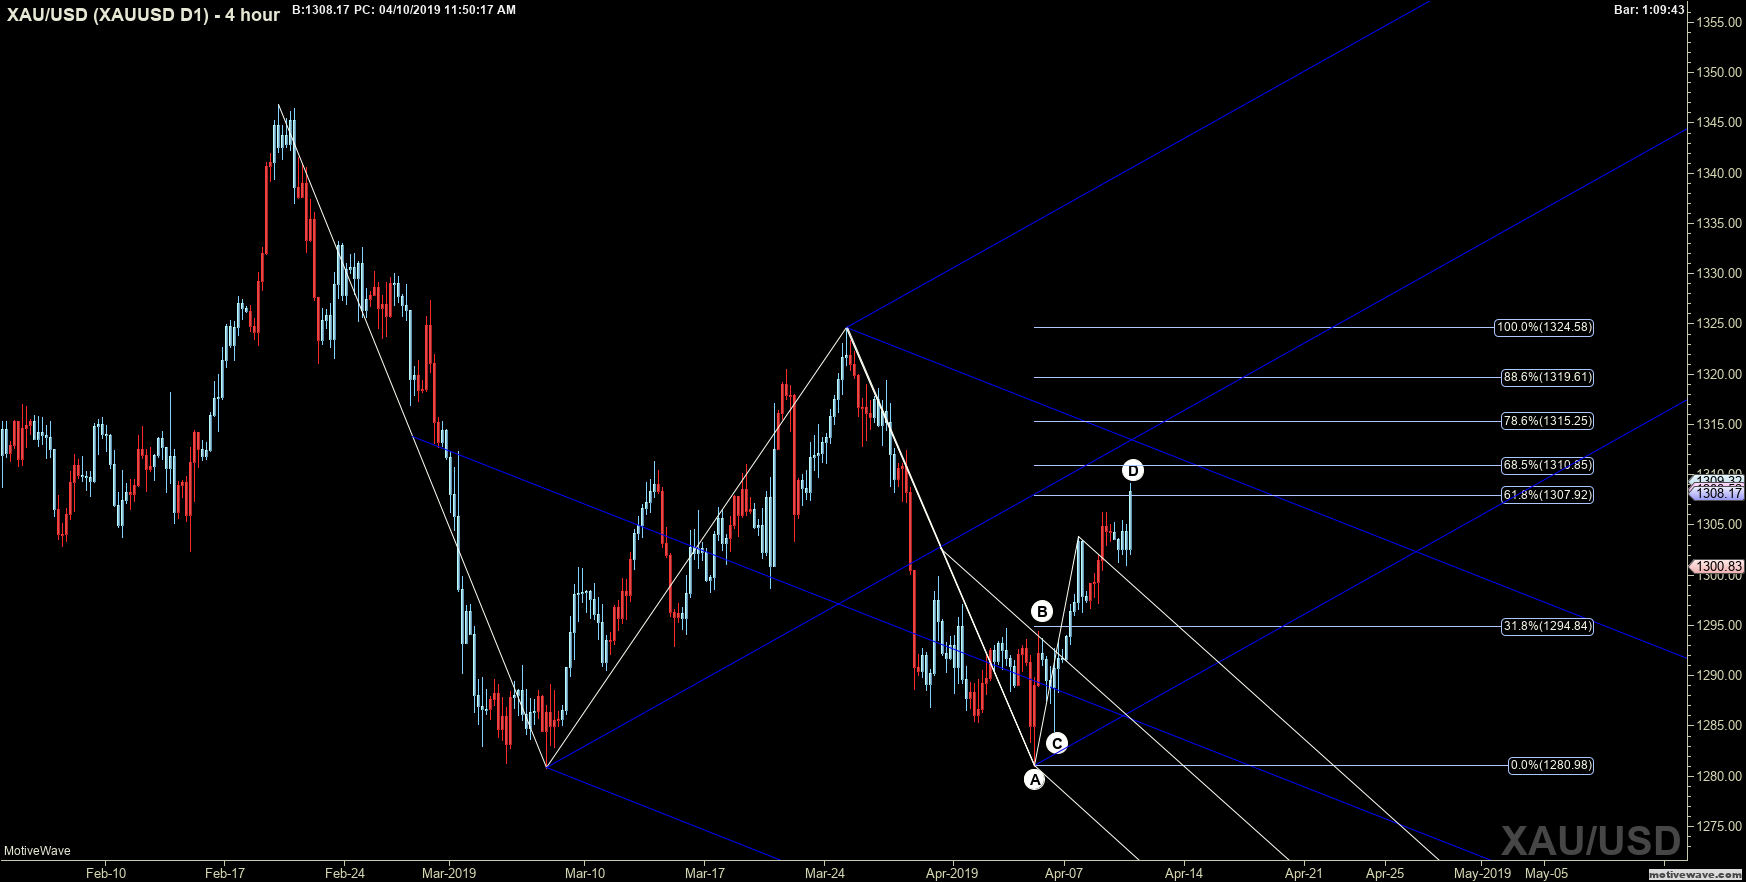
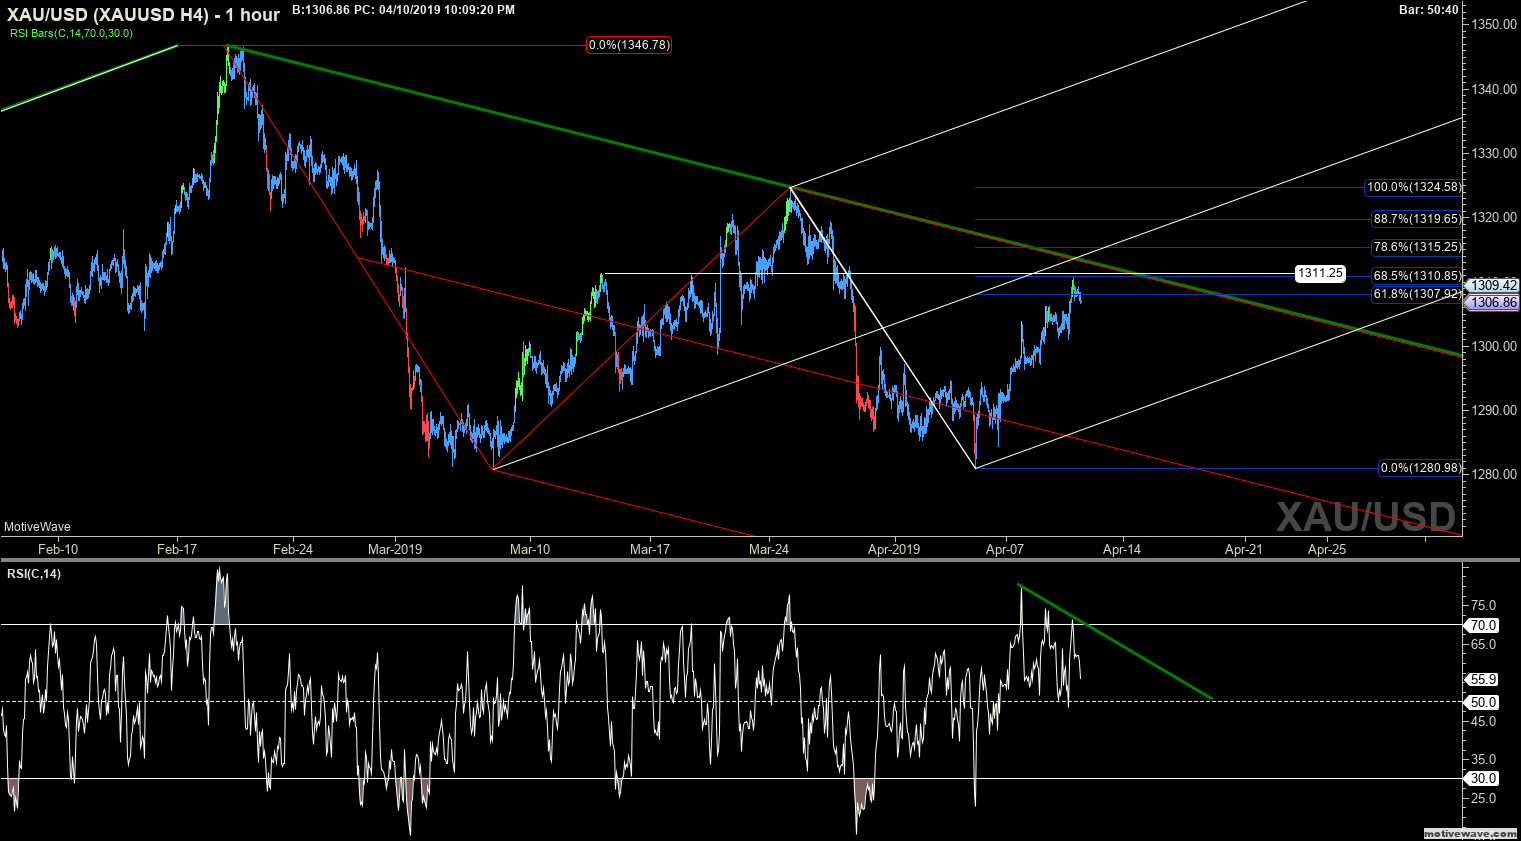
Ain't no stopping us now, we on the move! You get 10 credits if you can name the group! Is 146 holding? Looking like a 1 not a C . I have to admit that Gold continues to defy my admittedly perfectly laid out plans. :) How Jim says after 1.616 it is no longer a reversal. Good thing is we have RAT to decipher this Market!!


Click image for original size
xauusd xauusd d1 apr 10 1150 am 4 hour png


McFadden and Whitehead. I cant remember hearing this one, but it has a good beat and great lyrics!

Al
RA
rat89
Rep: 0
Posts: 7,015
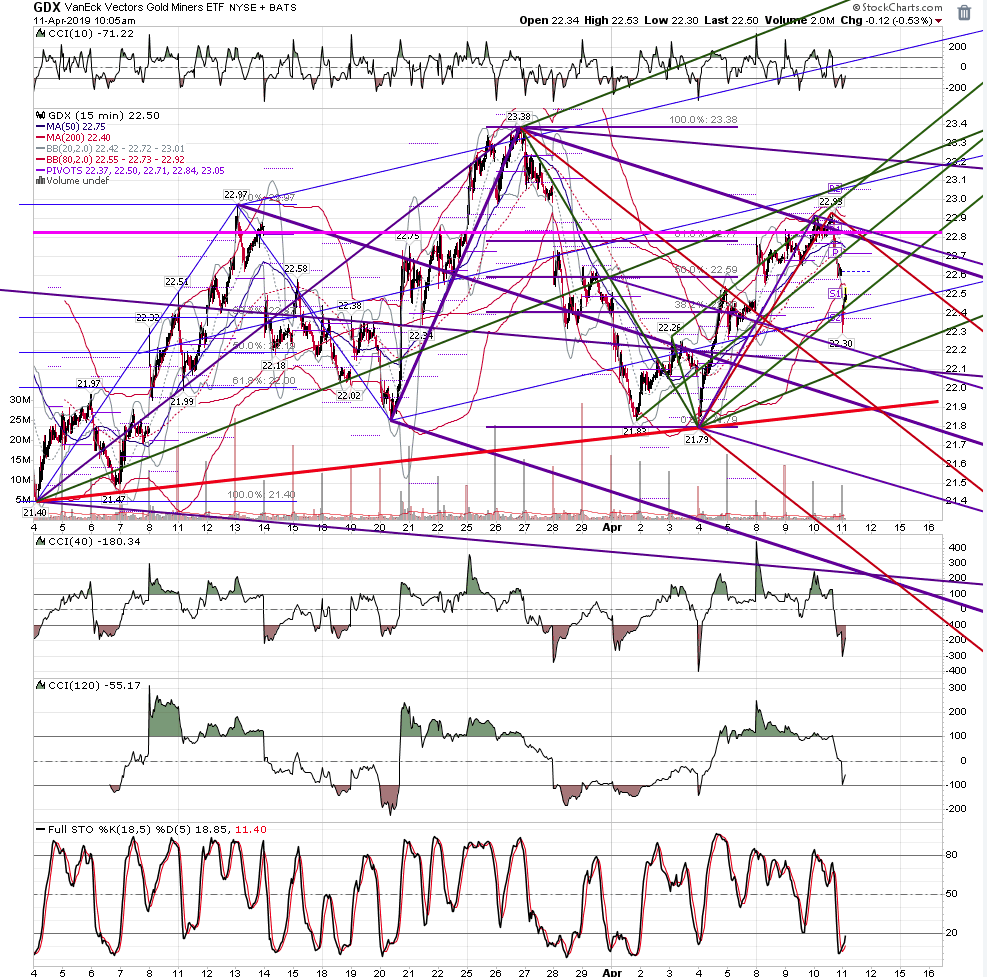
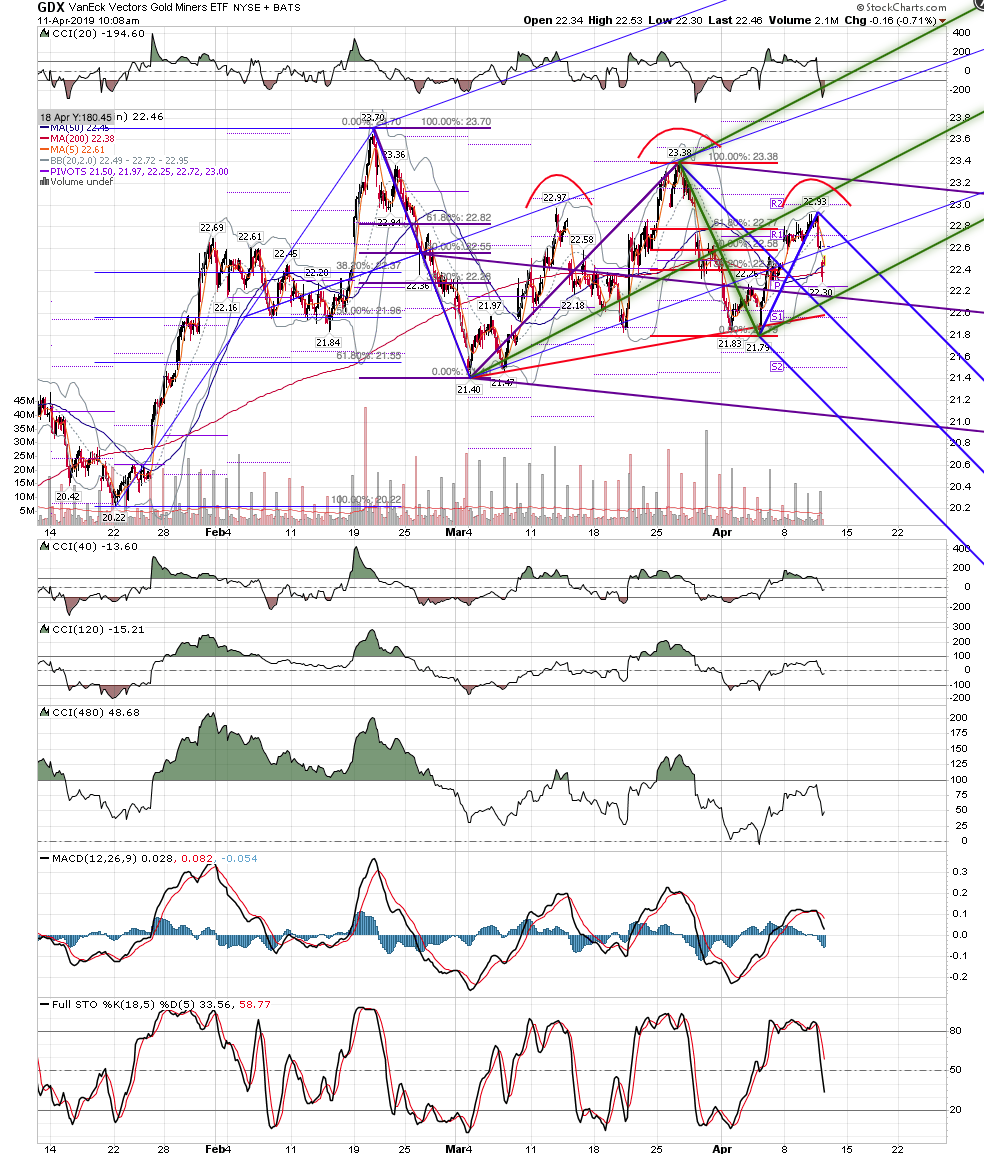
fantastic charts duane....gld and gdx indeed pushed to extremes today ahead of the fed minutes, and reversed hard at 2 pm eastern....gdx measured move targets 21.08
Click image for original size
screen shot 2019 04 10 at 2 24 42 pm png
DU
Duane
Rep: 100
Posts: 1,095
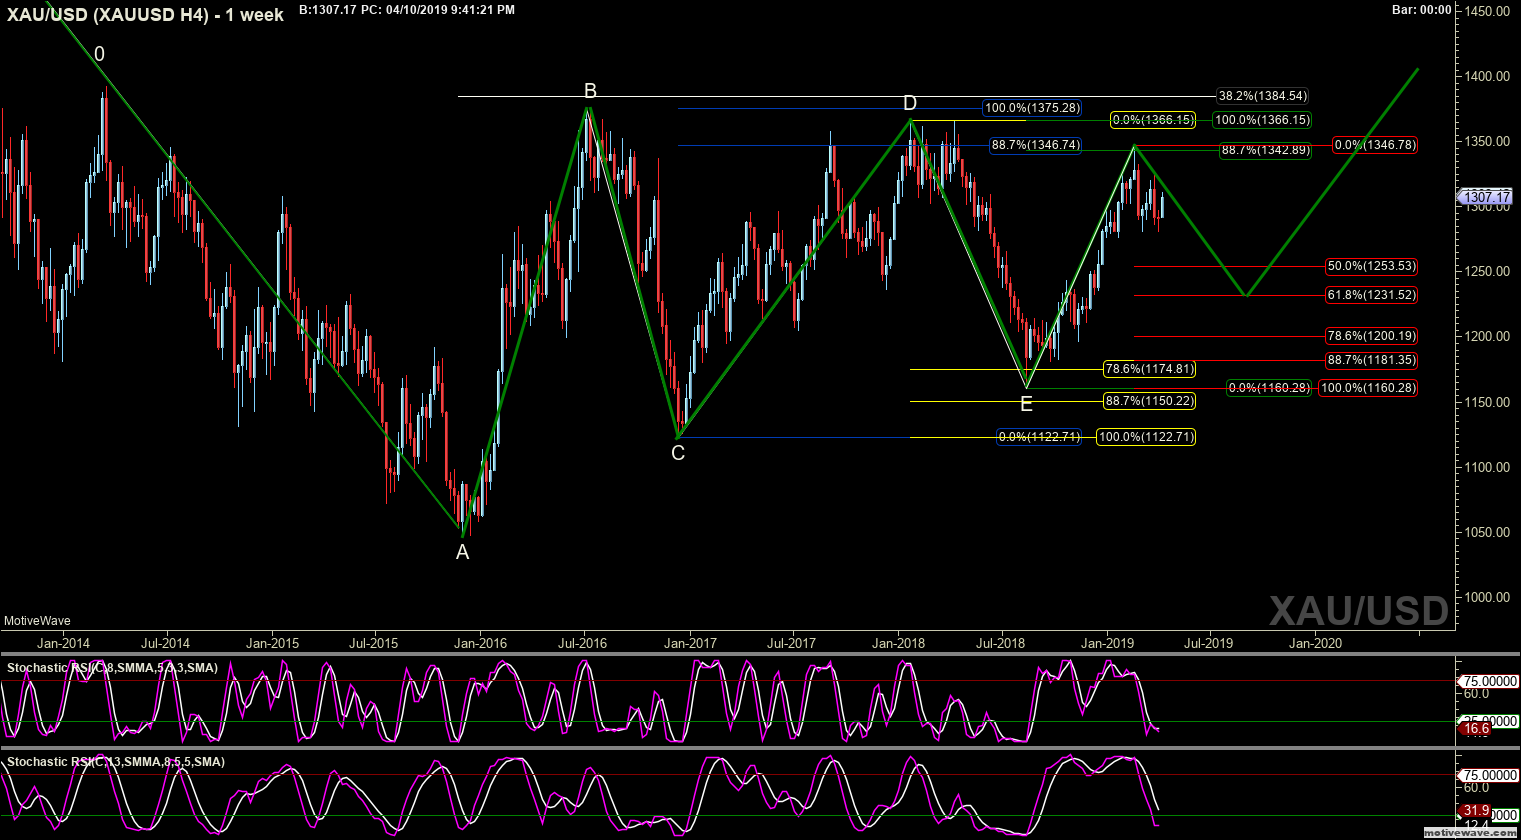
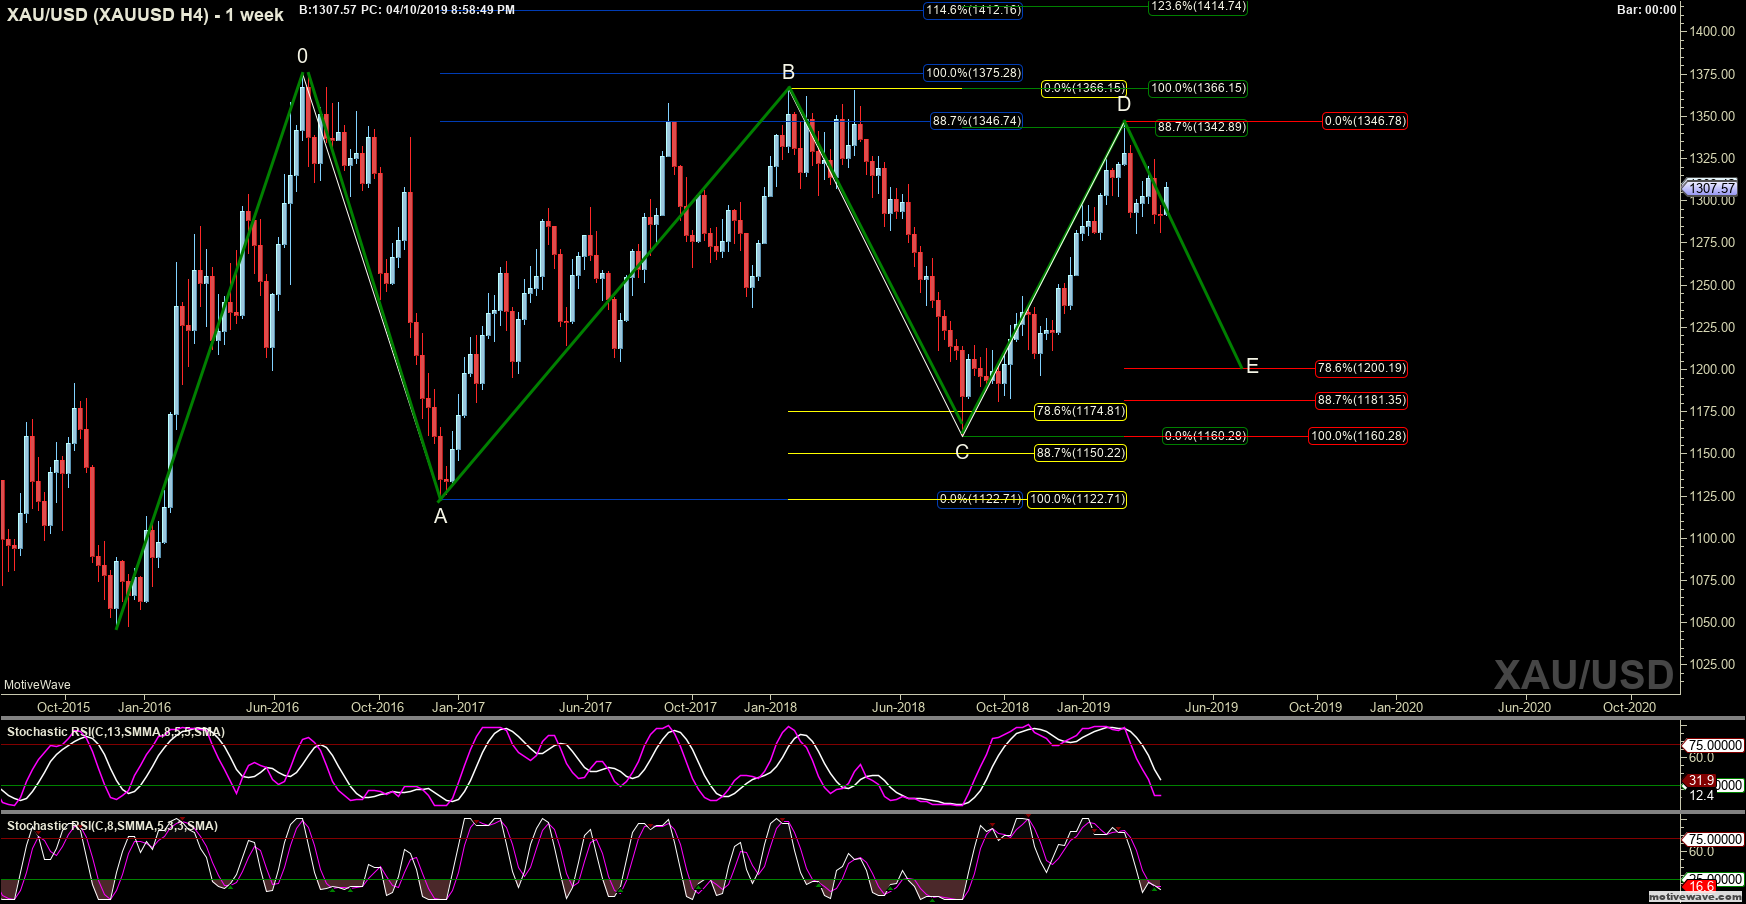
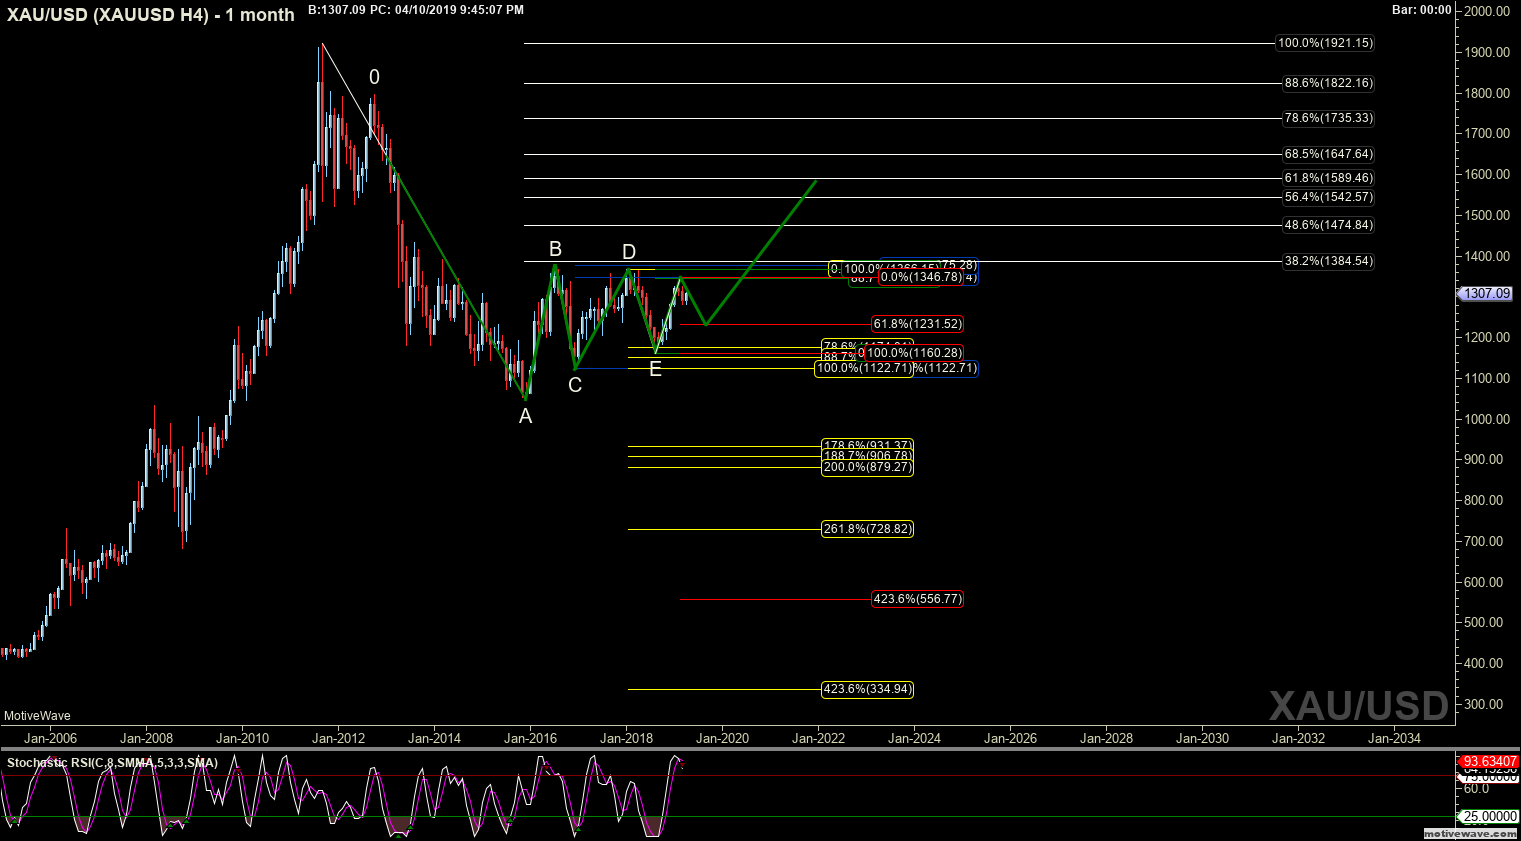
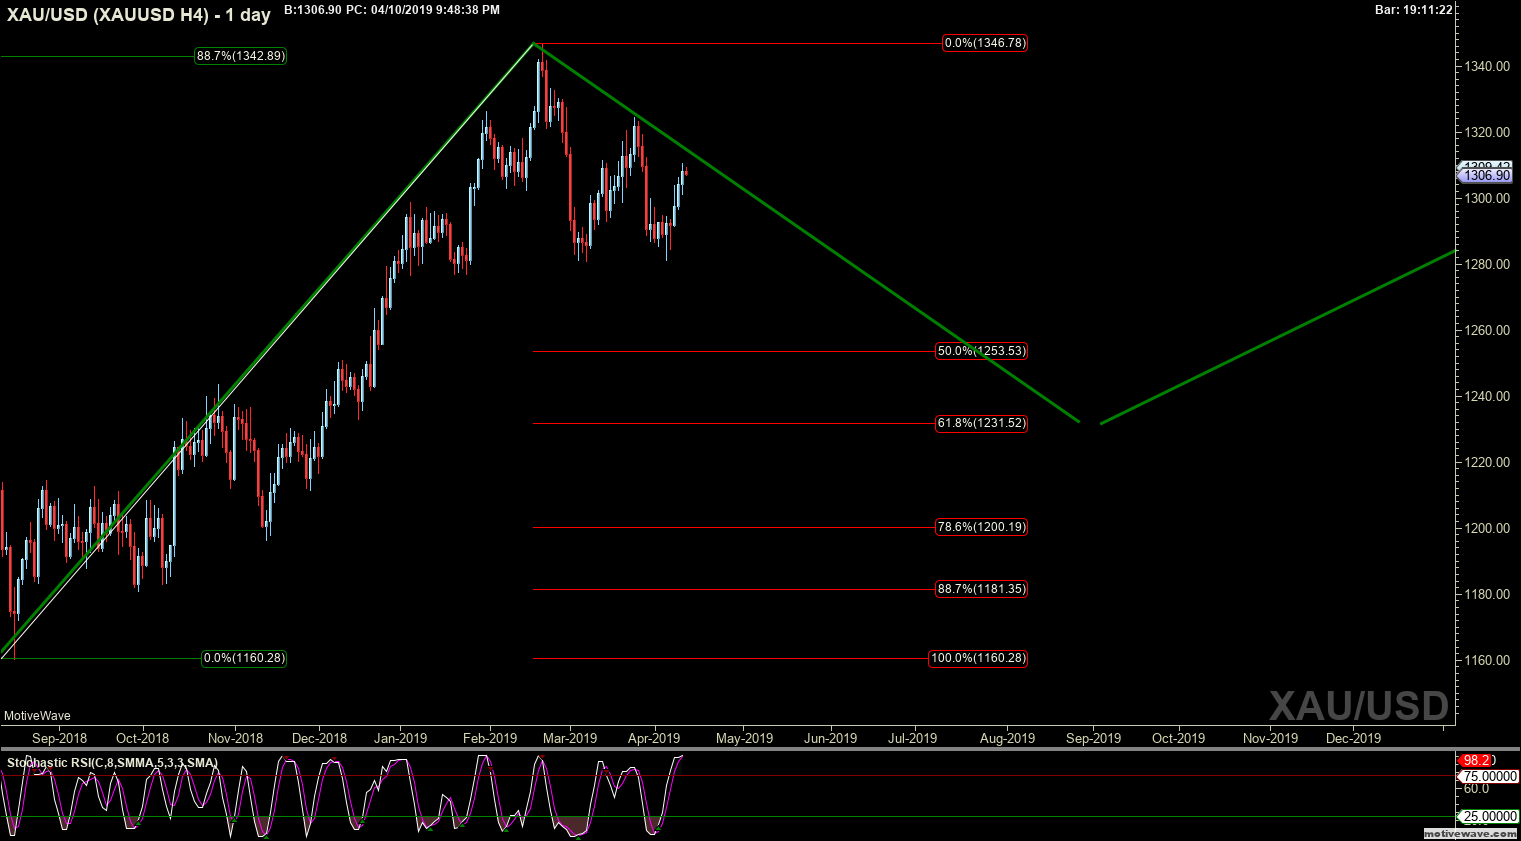
Momentum wise, as displayed by the StoRsi Monthly overbought, Weekly oversold, daily overbought
Click image for original size
xauusd xauusd h4 apr 10 2141 pm 1 week png


Click image for original size
xauusd xauusd h4 apr 10 2058 pm 1 week png

Click image for original size
xauusd xauusd h4 apr 10 2145 pm 1 month png


Click image for original size
xauusd xauusd h4 apr 10 2148 pm 1 day png
DU
Duane
Rep: 100
Posts: 1,095
I am so sure that maybe gold will definitely make a bear , bull, bear move . Probably.


Click image for original size
xauusd xauusd h4 apr 10 2209 pm 1 hour png
RA
rat89
Rep: 0
Posts: 7,015
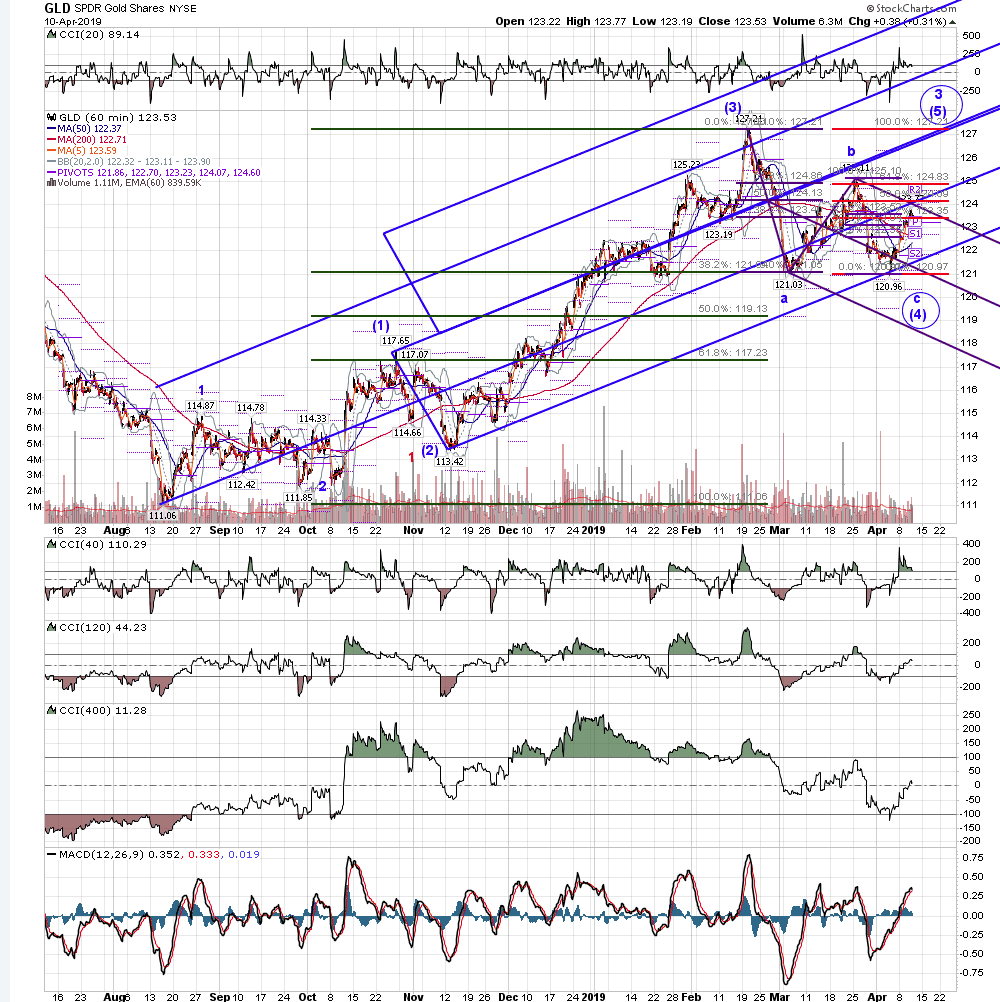
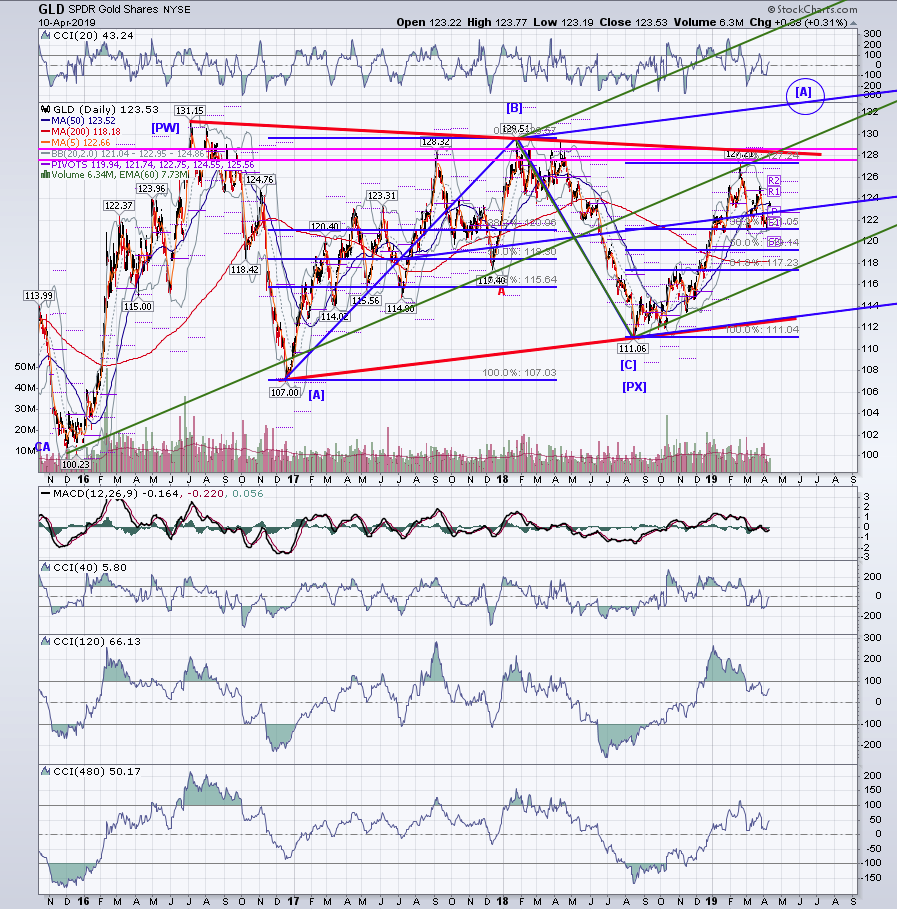
gld 60 and daily...I'm sticking with an abc down flr wave [4] to set up a larger move up until it fails. The question in my mind is how far will it move down, and where will they pick it up, knowing that they were "wrong" at 120.96? A double 1.27 sets up at 119.93/ 120.20, so eye on that for now...


Click image for original size
screen shot 2019 04 11 at 8 40 53 am png

Click image for original size
screen shot 2019 04 11 at 8 41 15 am png
RA
rat89
Rep: 0
Posts: 7,015
gdx
Click image for original size
screen shot 2019 04 11 at 10 07 50 am png

Click image for original size
screen shot 2019 04 11 at 10 09 32 am png
RA
rat89
Rep: 0
Posts: 7,015
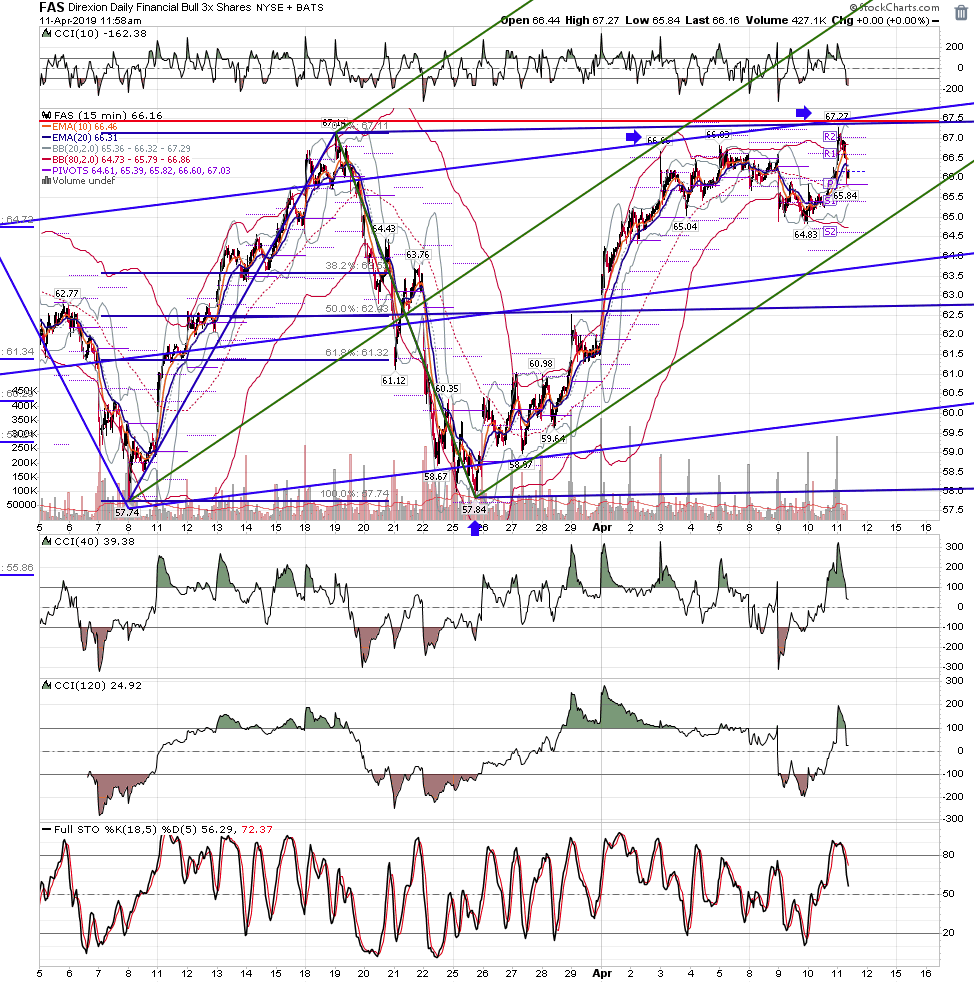
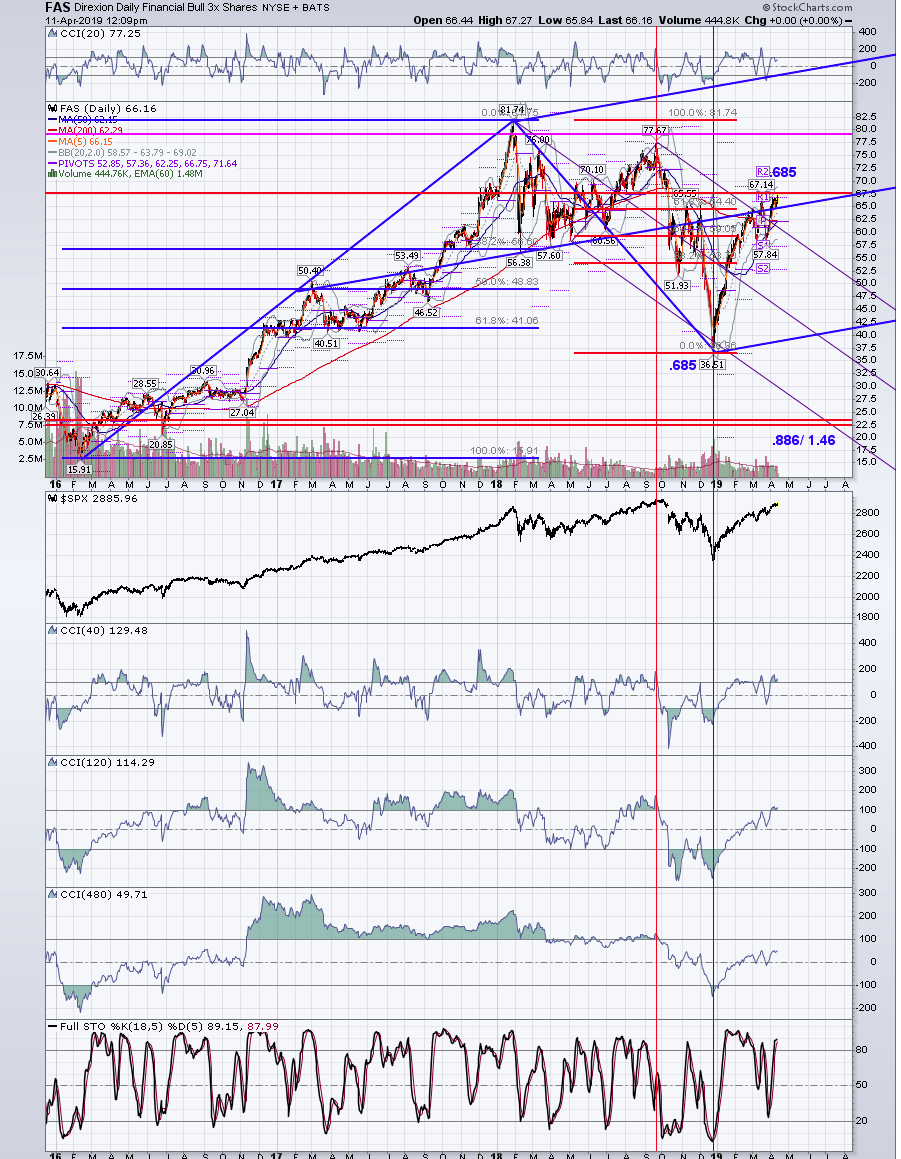
fas....I was recently telling a trader friend not to be short at 58 and to wait for a retest of 66? fas now has a double top at the confluence of lines and right where 81.74 - 36.51 = .685. There is an algo whereby .685 in BOTH directions leads to a move to the .886 - see the daily. Also note that in september, fas turned down before spx, but in december they turned up together.
Click image for original size
screen shot 2019 04 11 at 11 58 52 am png

Click image for original size
screen shot 2019 04 11 at 12 09 40 pm png
DU
Duane
Rep: 100
Posts: 1,095
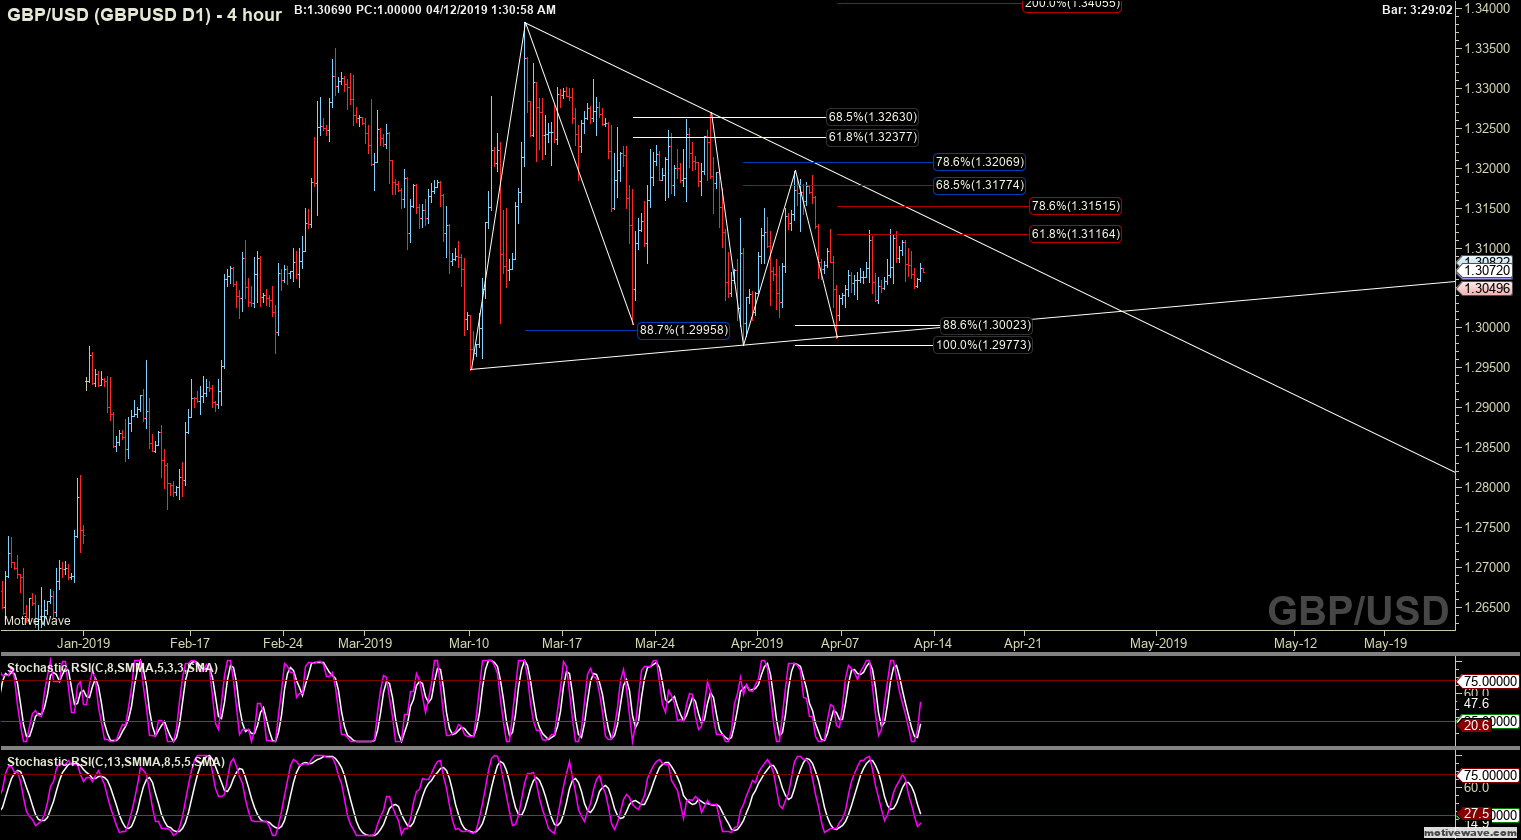
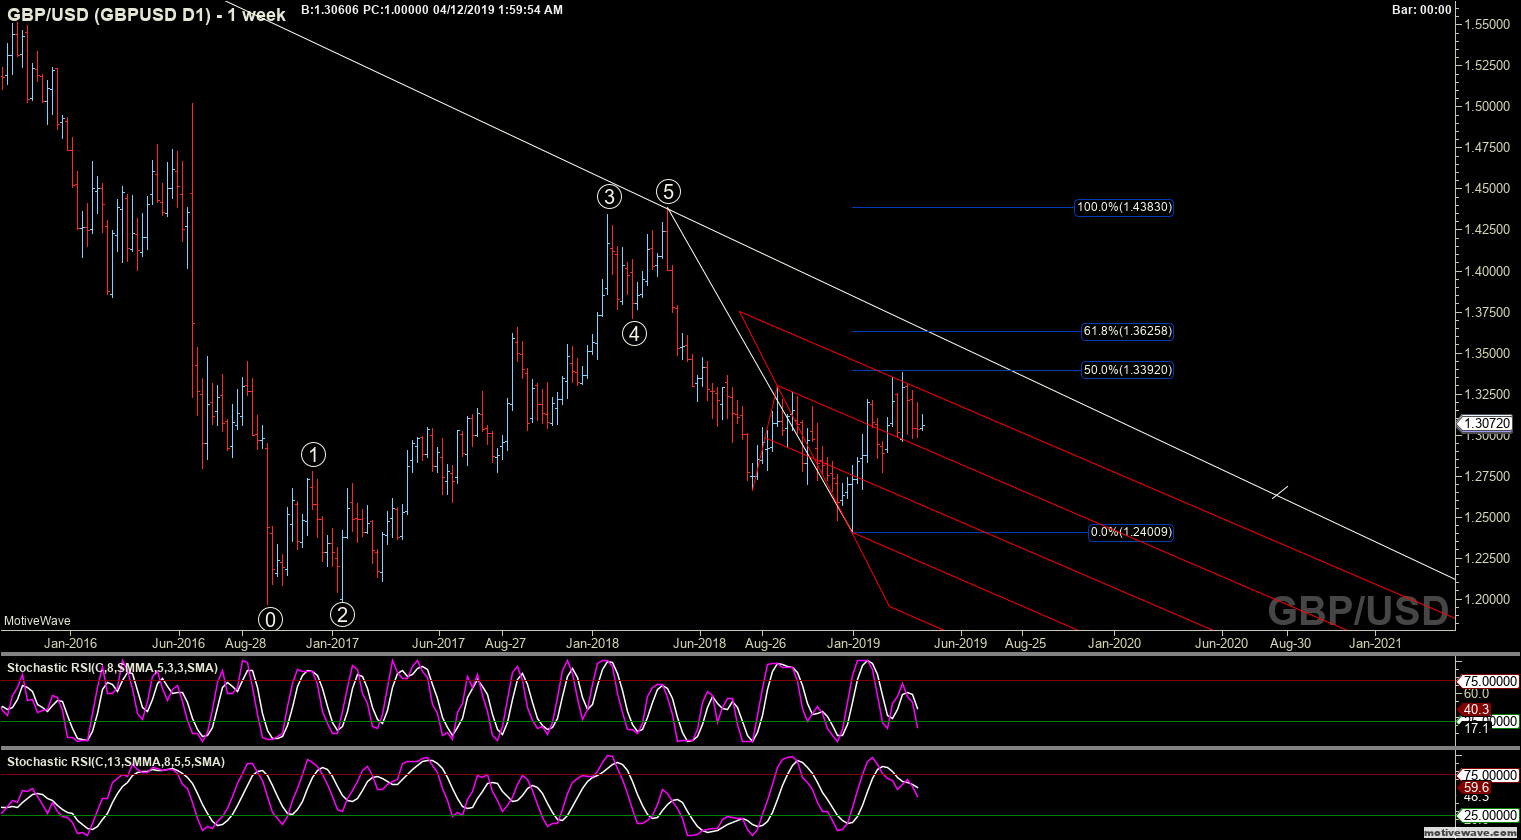
I have to give it Jim, he helped me we defined fib pattern to make the pattern clearer. Check out this Brexit pattern. Lower lows spell trouble for the pound?

Click image for original size
gbpusd gbpusd d1 apr 12 0130 am 4 hour png


Some context.


Click image for original size
gbpusd gbpusd d1 apr 12 0159 am 1 week png
RA
rat89
Rep: 0
Posts: 7,015
Click image for original size
screen shot 2019 04 12 at 12 15 38 pm png