Starting it off.
Al
RA
rat89
Rep: 0
Posts: 7,015
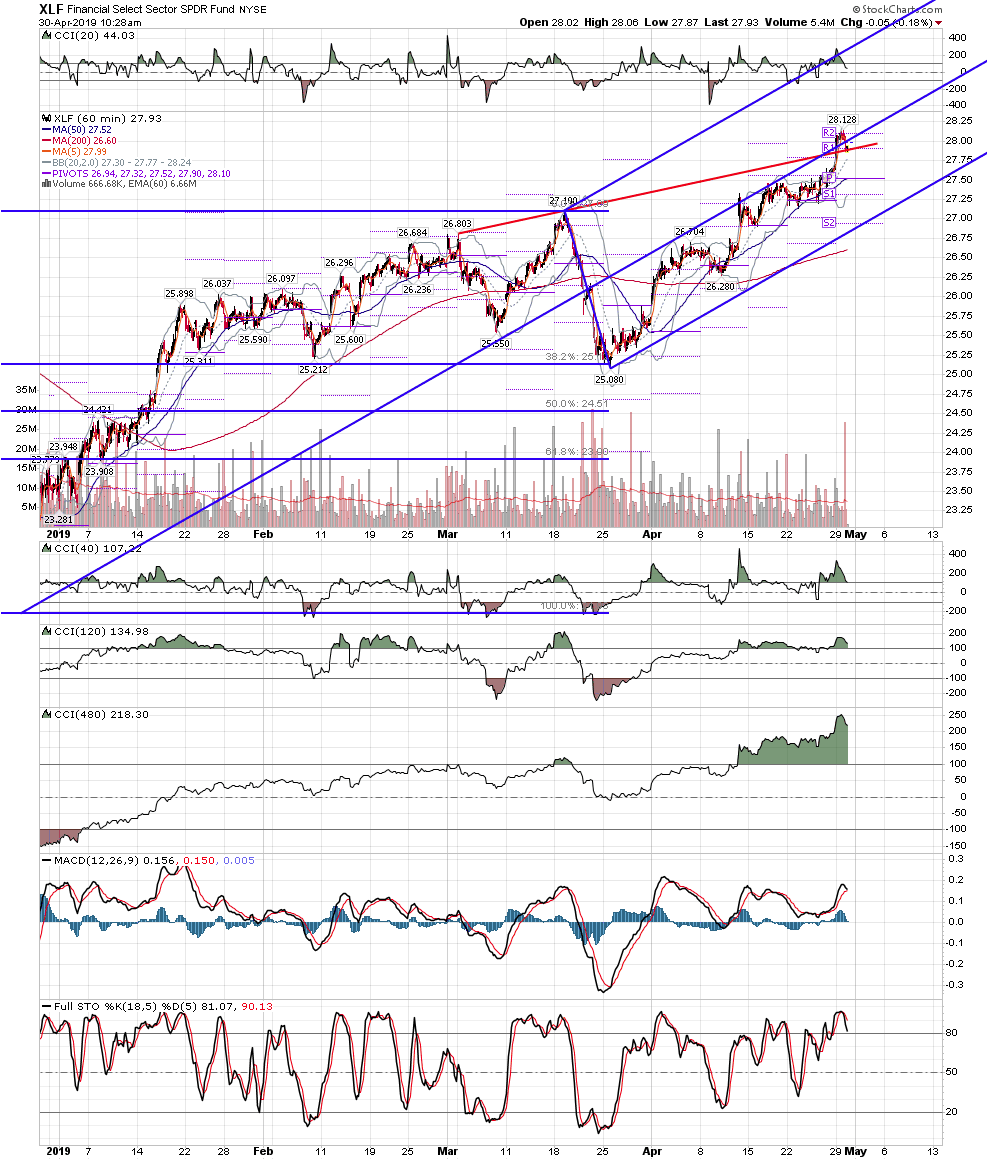
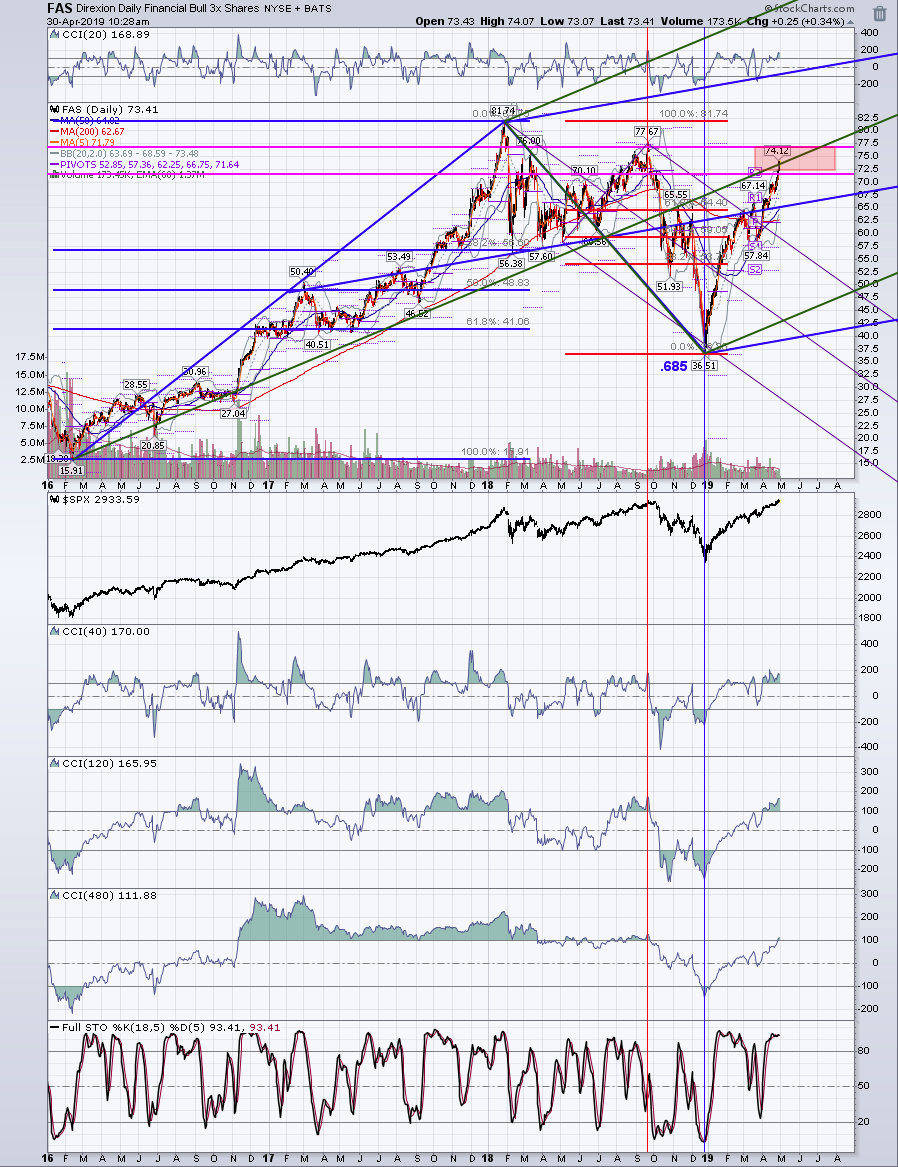
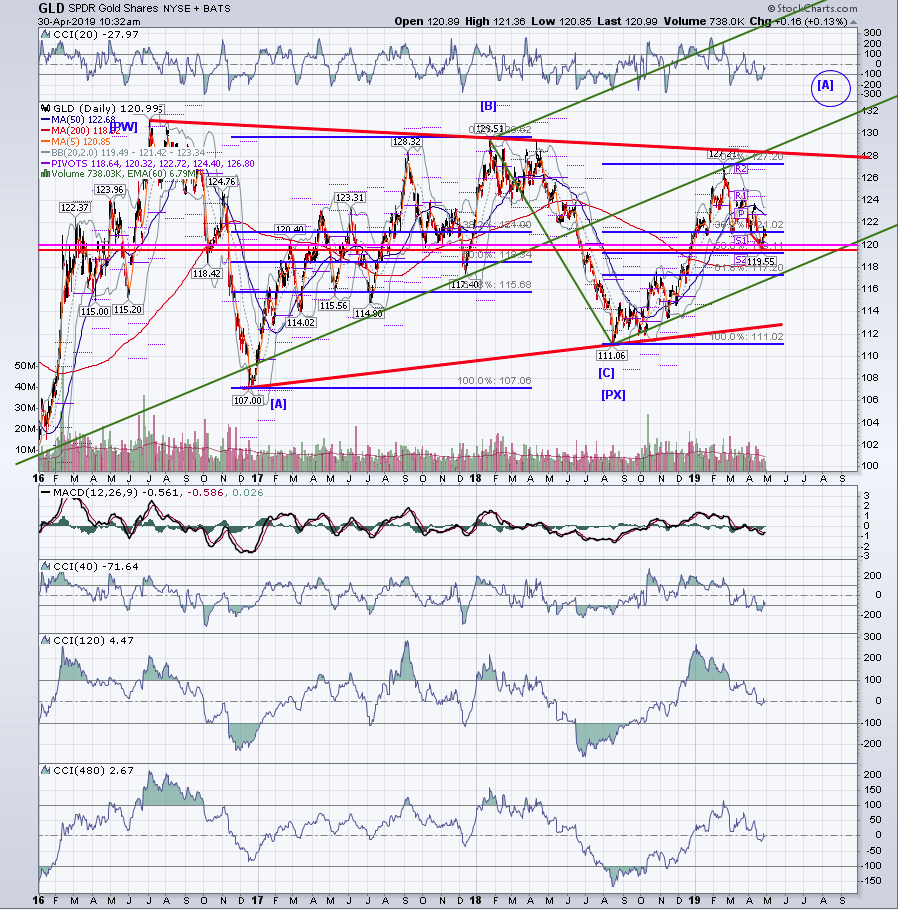
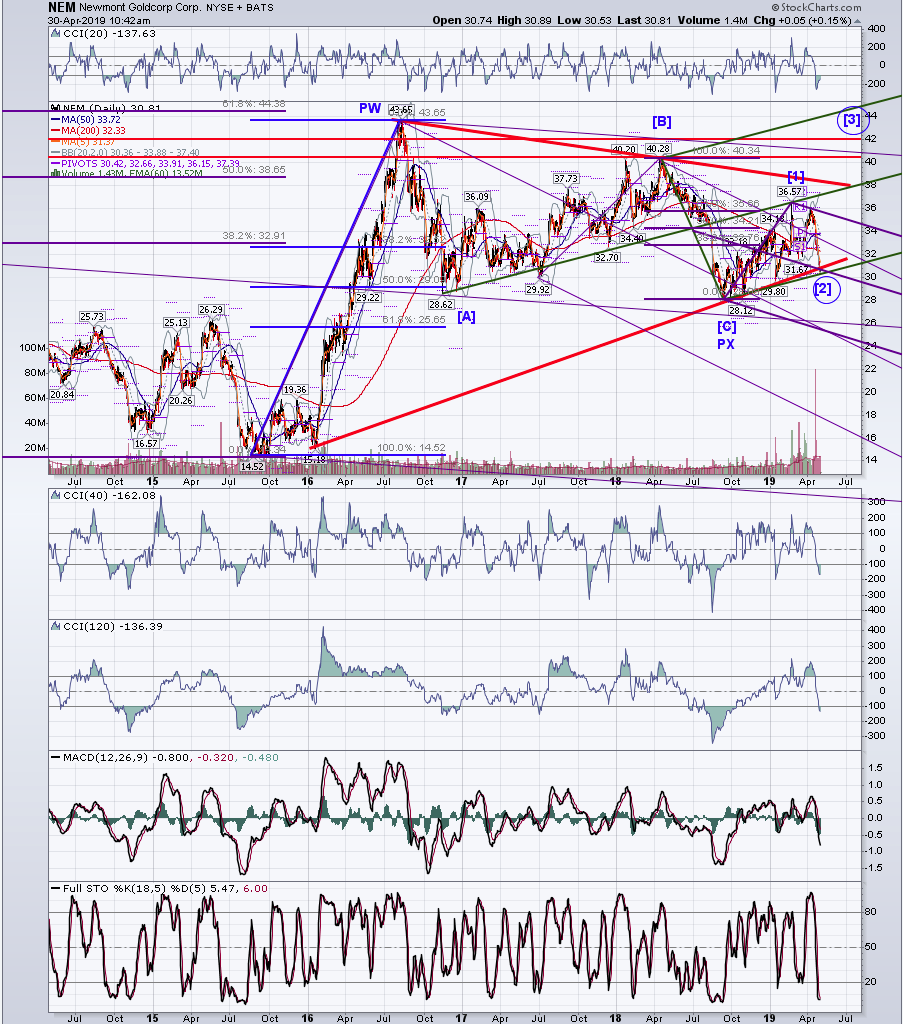
here's a wild projection:
Click image for original size
Click image for original size
AL
albert
Rep: 99
Posts: 3,094
Duane and rat,
Super work, guys! I can relate to rat's statement regarding looking the wrong way at price turns!
I thought this was an interesting chart with a Kane DT completing at 0.618 fibo. The price reversal at the 0.618 fibo at the right side of the chart is also interesting, leading to a STO OS area after the Gold Cross, possibly a nice long entry area.
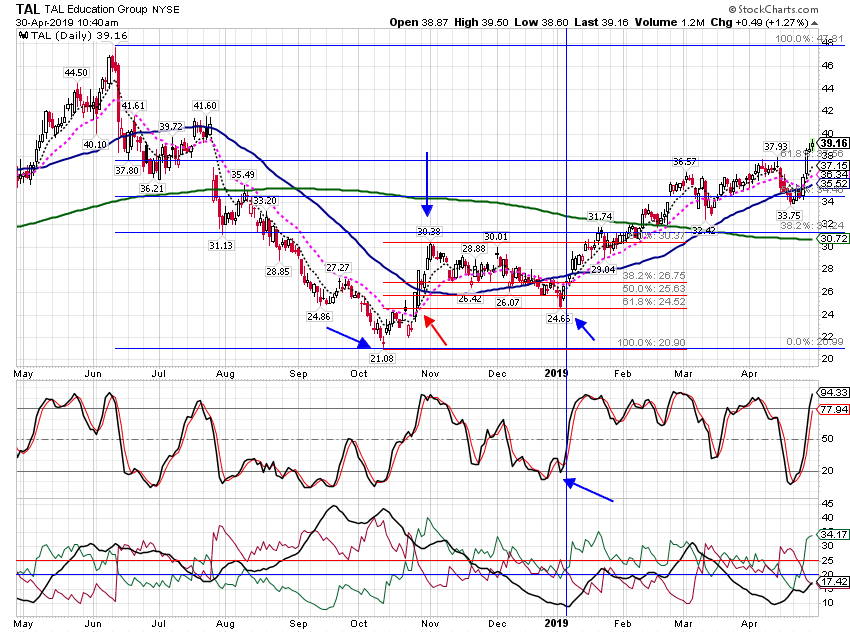
BTW, I have been looking at bottoming areas like the one pointed out in the next chart, and seeing a similar price behavior a lot. First blue arrow to the left at the bottom, points out the bottom. The red arrow points out where the 8 ema crosses over the 20 ema. The third blue arrow points to a price maximum. The fourth blue arrow shows a STO OS area. I call this sequence the 1234 wait for it. "it" being the +DI crossing up over the -DI, signalling a bullish bias. May occur only after major price pullbacks. Any thoughts?
Al :--)
Super work, guys! I can relate to rat's statement regarding looking the wrong way at price turns!
I thought this was an interesting chart with a Kane DT completing at 0.618 fibo. The price reversal at the 0.618 fibo at the right side of the chart is also interesting, leading to a STO OS area after the Gold Cross, possibly a nice long entry area.
Click image for original size
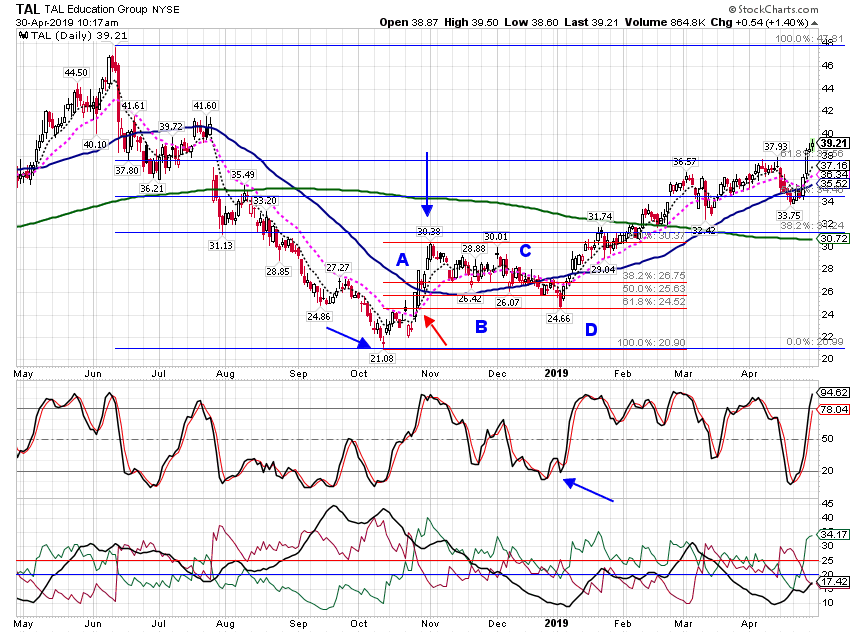
BTW, I have been looking at bottoming areas like the one pointed out in the next chart, and seeing a similar price behavior a lot. First blue arrow to the left at the bottom, points out the bottom. The red arrow points out where the 8 ema crosses over the 20 ema. The third blue arrow points to a price maximum. The fourth blue arrow shows a STO OS area. I call this sequence the 1234 wait for it. "it" being the +DI crossing up over the -DI, signalling a bullish bias. May occur only after major price pullbacks. Any thoughts?
Al :--)
Click image for original size
MA
MarcinO
Rep: 67
Posts: 5,506
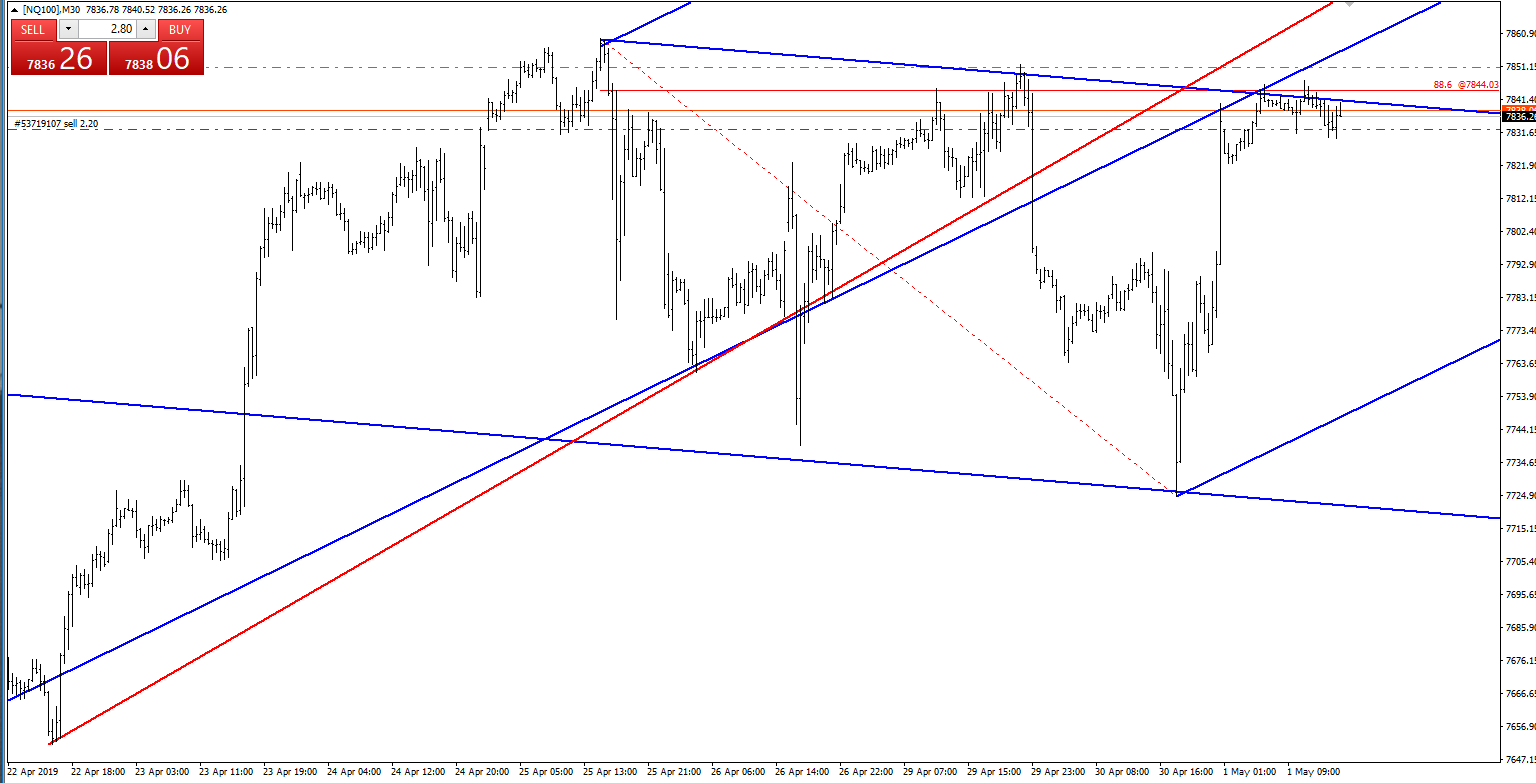
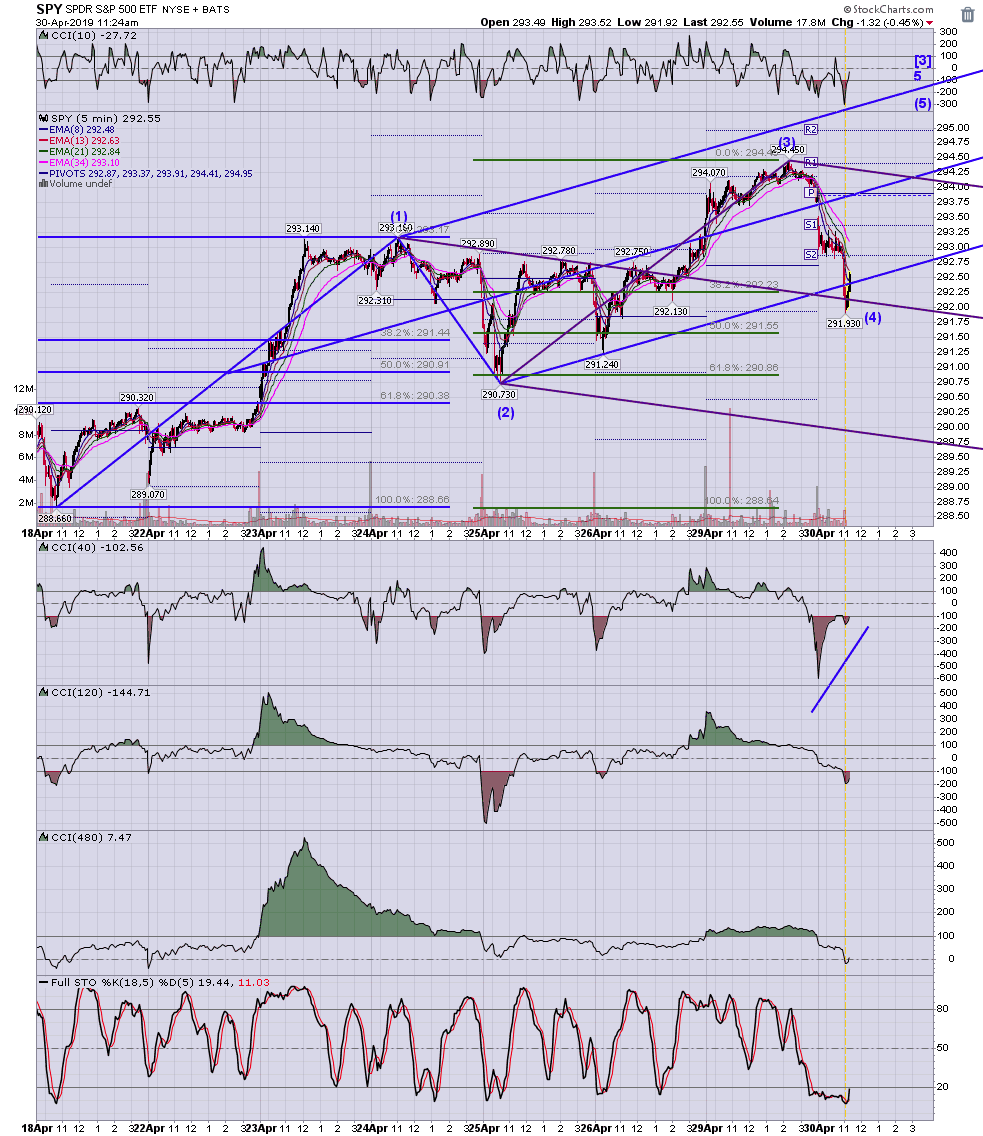
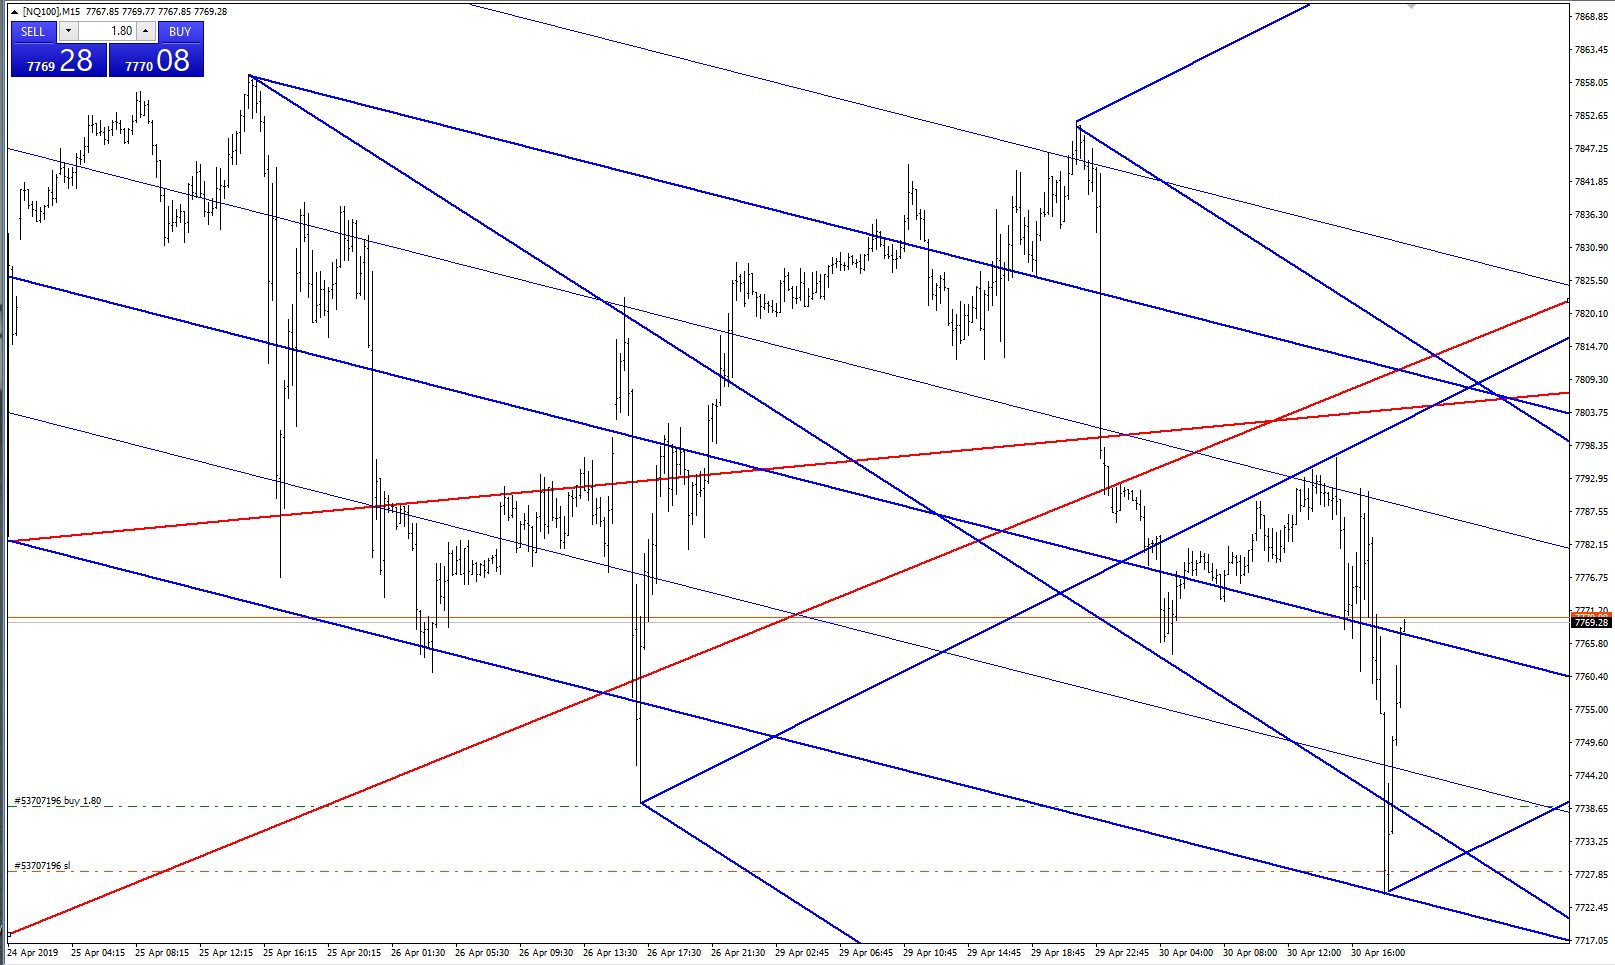
Nasdaq looks like ready to hit 7810. Keeping my long, but I will look for a reversal over there.
Alternative level at 7775-80.
Alternative level at 7775-80.
Click image for original size
MA
MarcinO
Rep: 67
Posts: 5,506
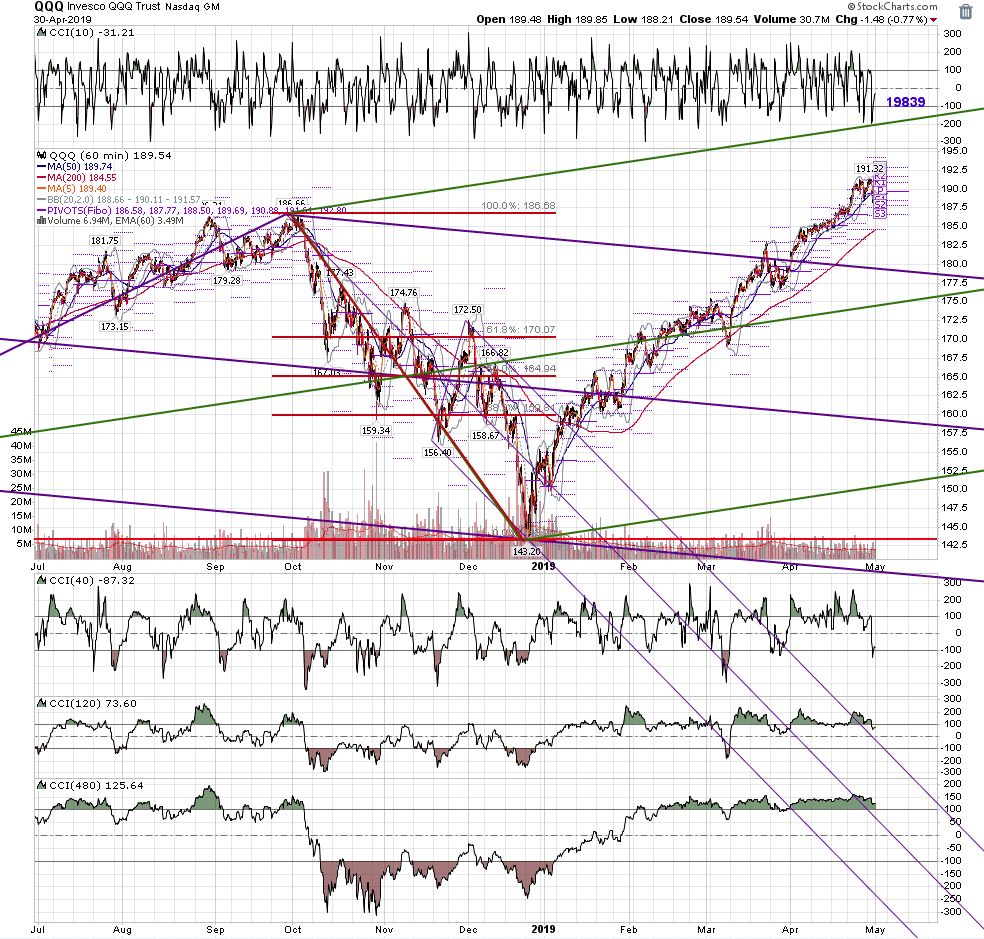
Not sure if they will start the drop around the open or will they prolong the decison till Fed announcement today.
Click image for original size