MyPivots
Sign In
DU
Duane
Rep: 100
Posts: 1,095
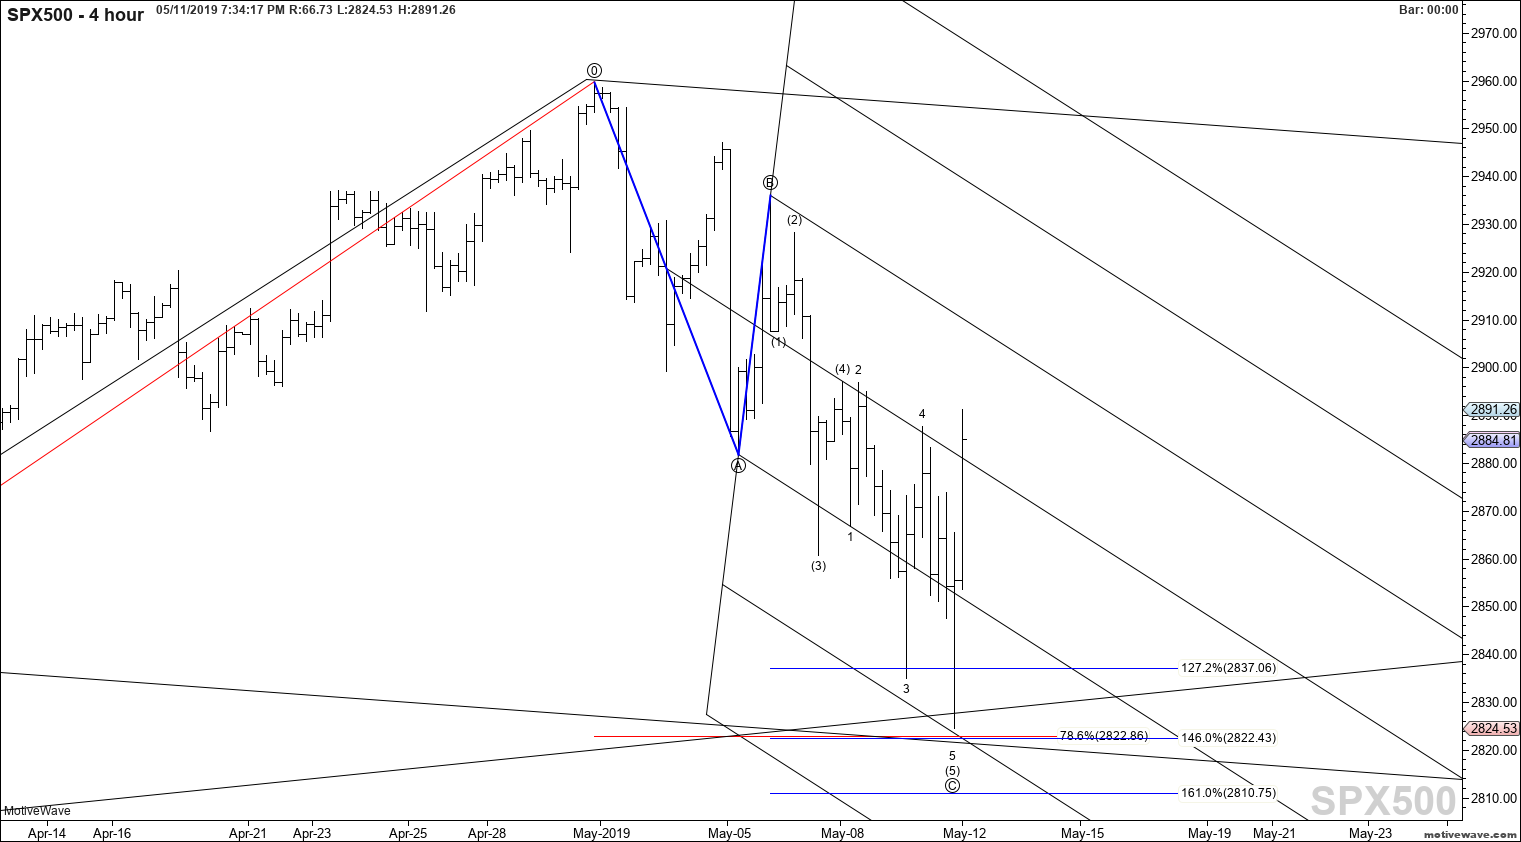
Thanks rat. Great trading week to everyone!


Click image for original size
spx500 primary analysis may 11 1934 pm 4 hour png
DU
Duane
Rep: 100
Posts: 1,095
Rat, you would ask me that question. Short answer, lower? But where? Here is a CRAZY chart.


Click image for original size
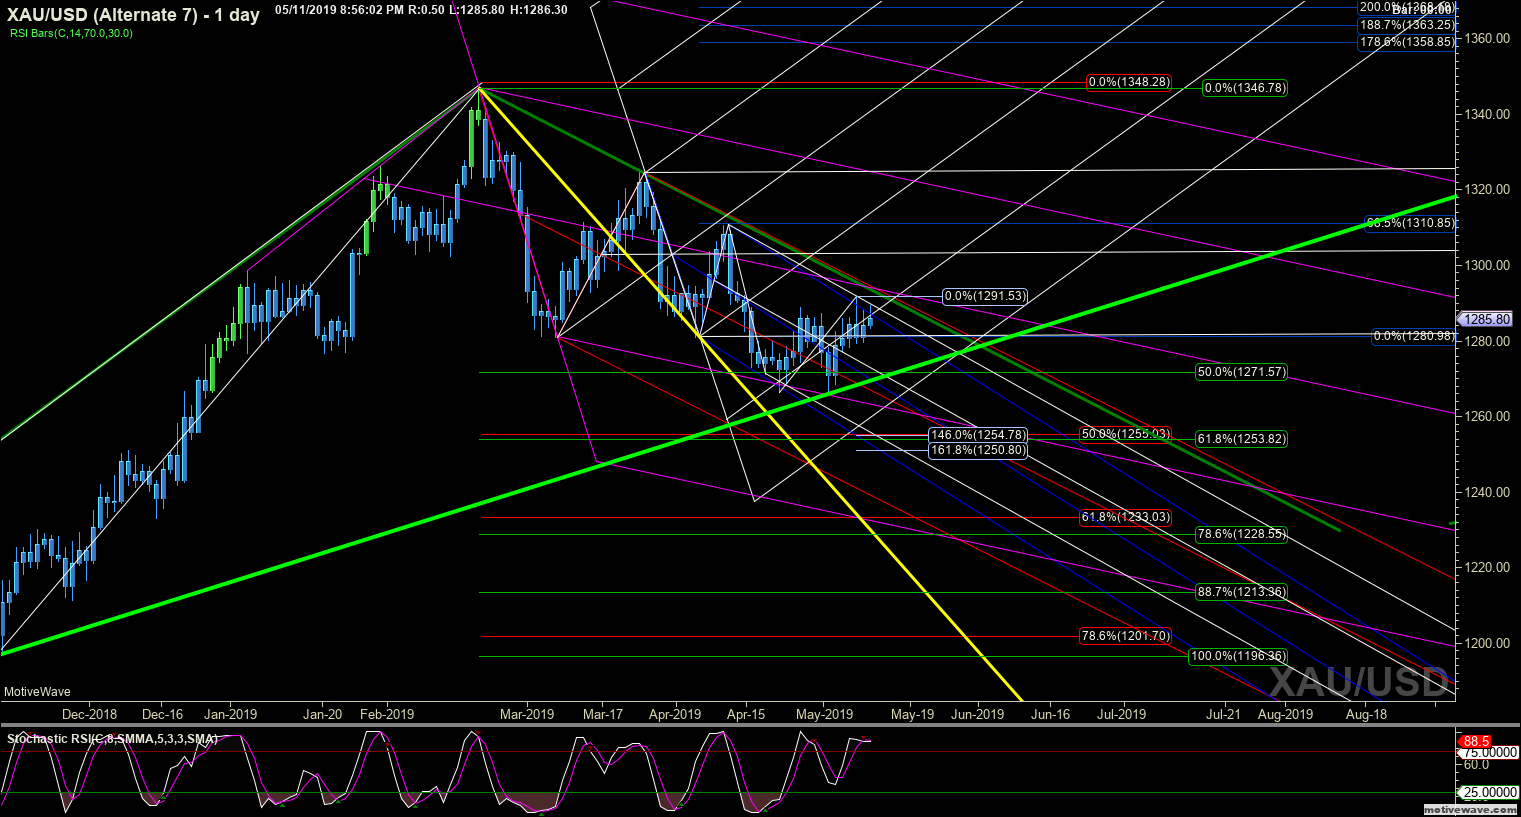
xauusd alternate 7 may 11 2055 pm 1 day png


Here we could alt the A and B for a 0 and A to make an impulsive ABCD ( I am lazy but you get the picture) But Clearly the weekly momentum oversold.

Click image for original size
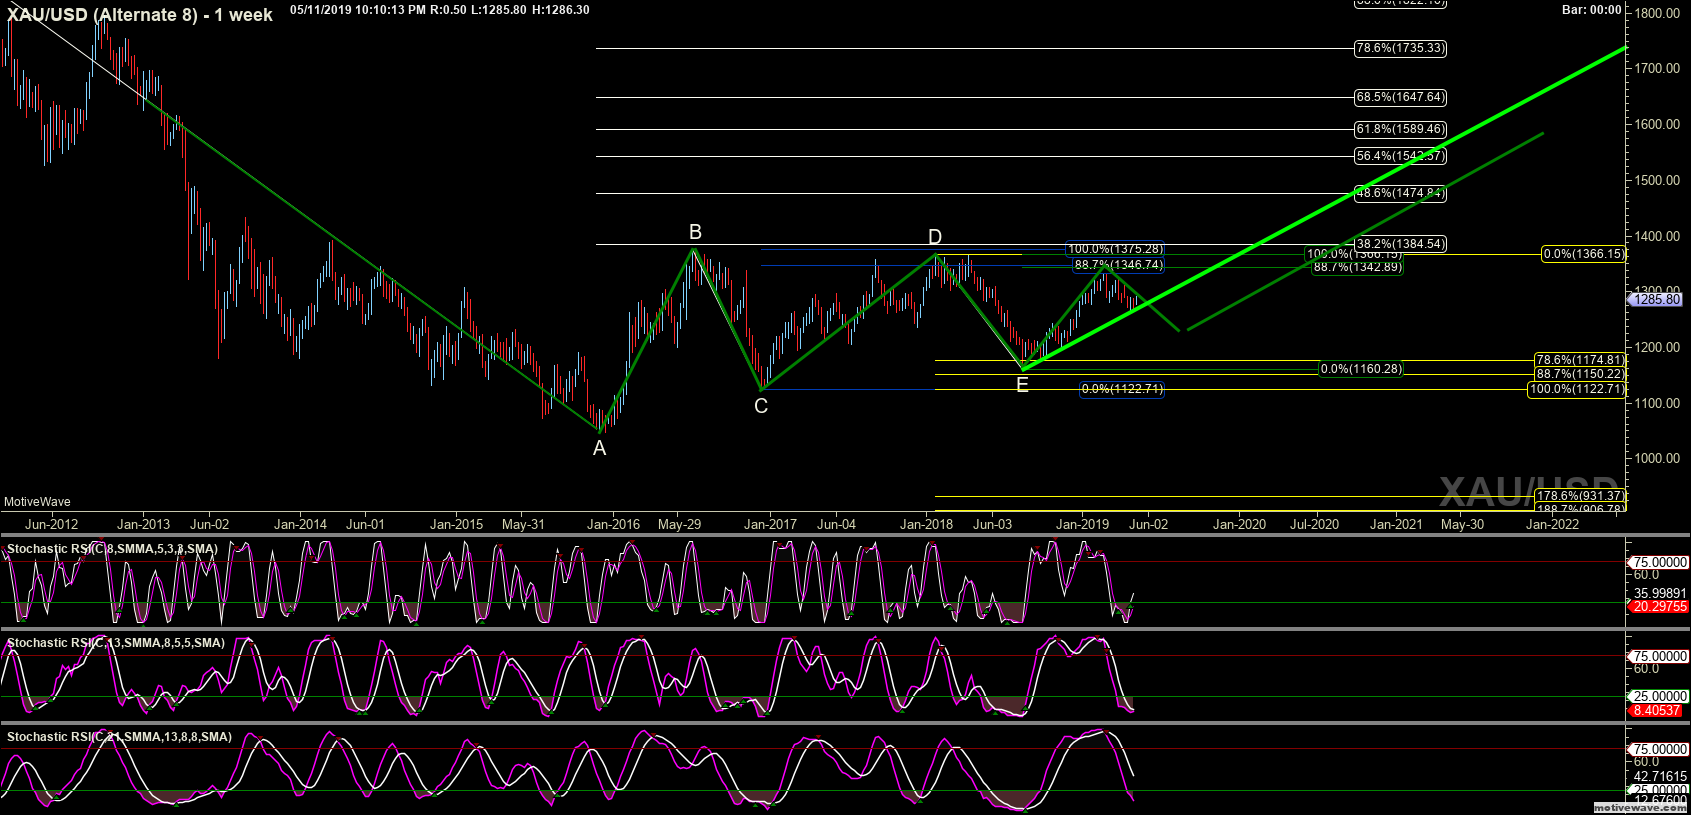
xauusd alternate 8 may 11 2210 pm 1 week png


Trend lines holding, but something has to give.

Click image for original size
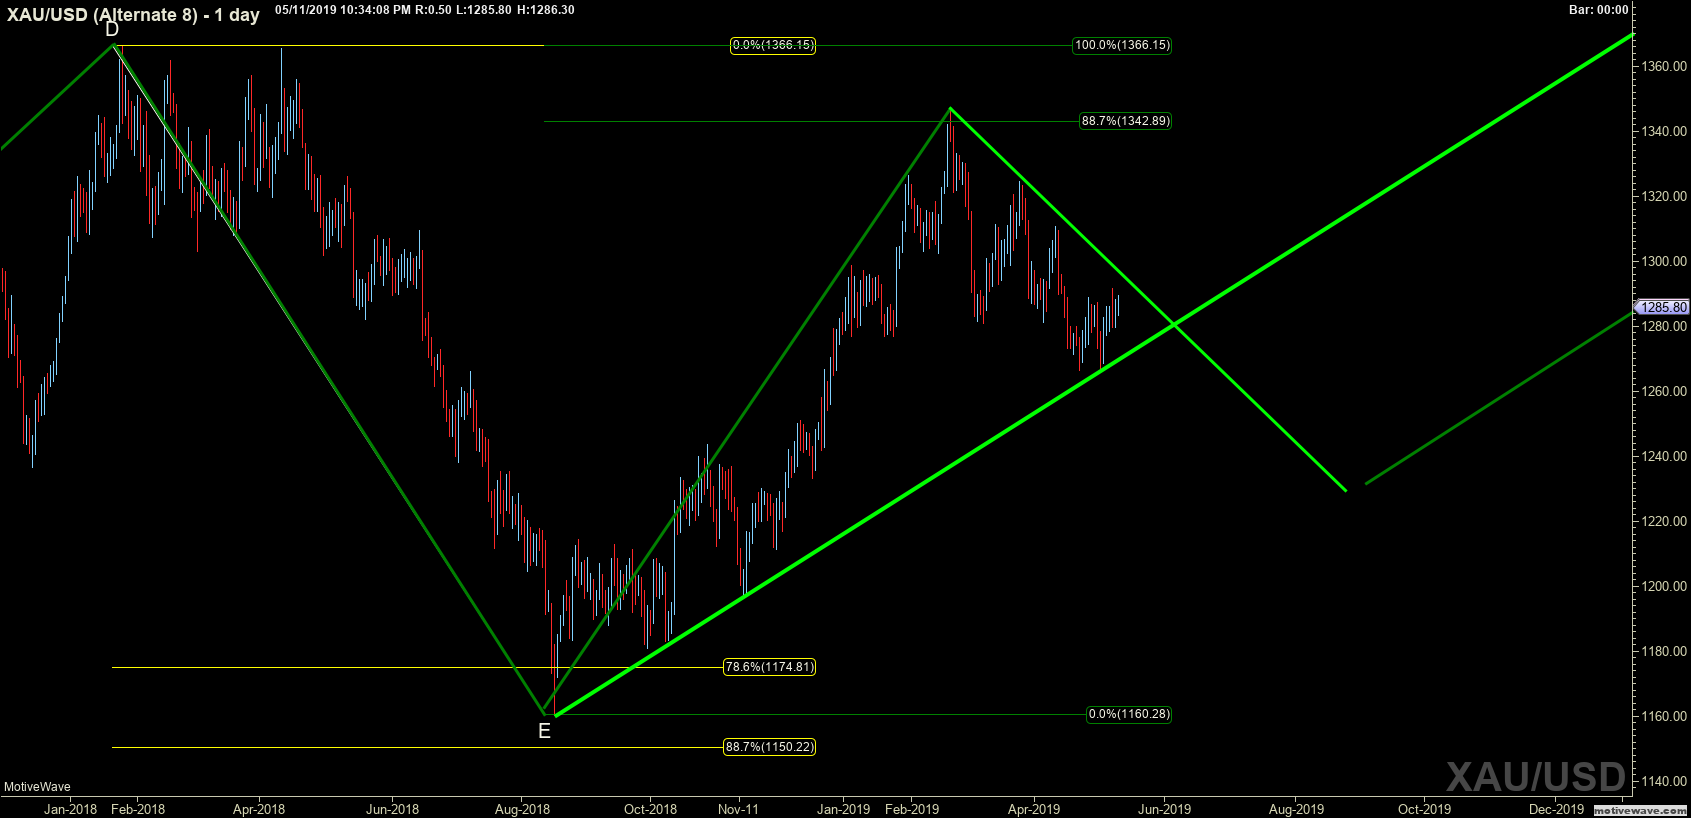
xauusd alternate 8 may 11 2234 pm 1 day png


Pattern Here is one of a variety


Click image for original size
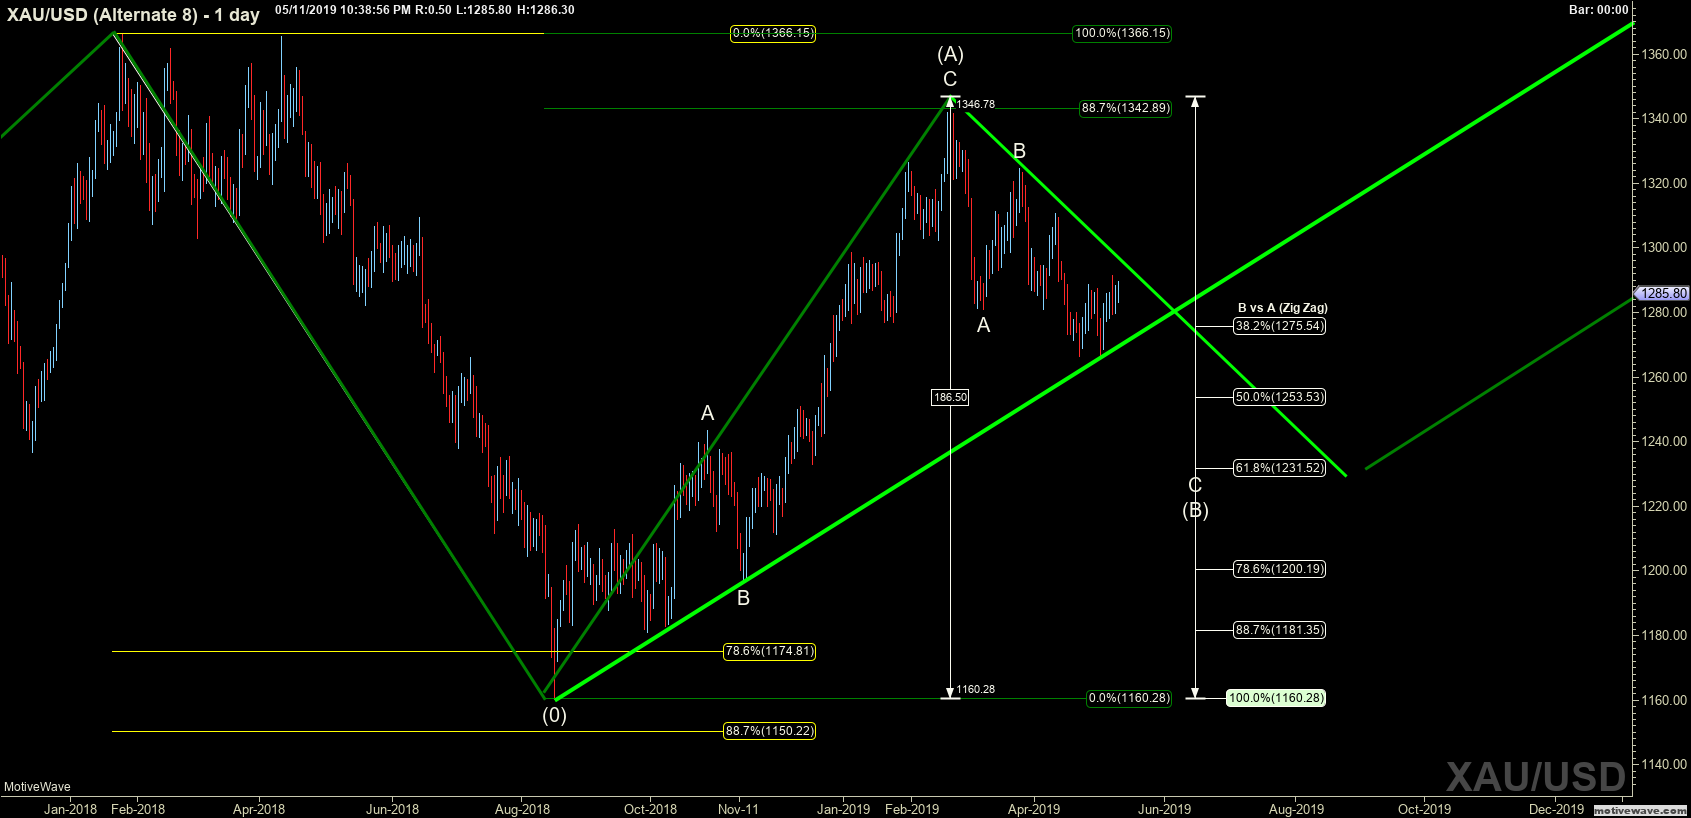
xauusd alternate 8 may 11 2238 pm 1 day png


But when it comes down to it, I trade fibs and lines, so I am looking at @1253 That would be ideal for me.


Click image for original size
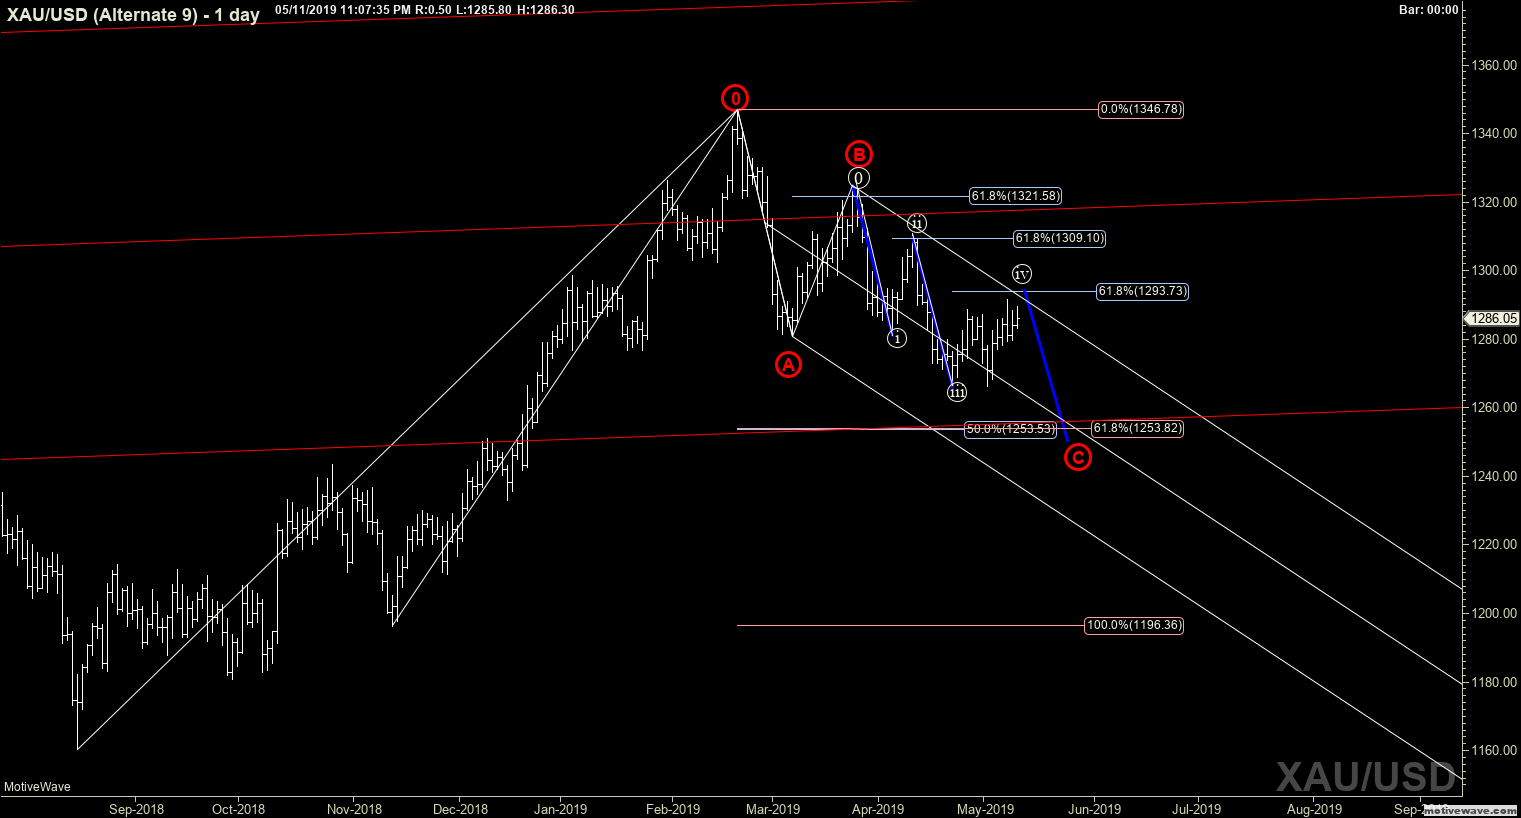
xauusd alternate 9 may 11 2307 pm 1 day png
DU
Duane
Rep: 100
Posts: 1,095
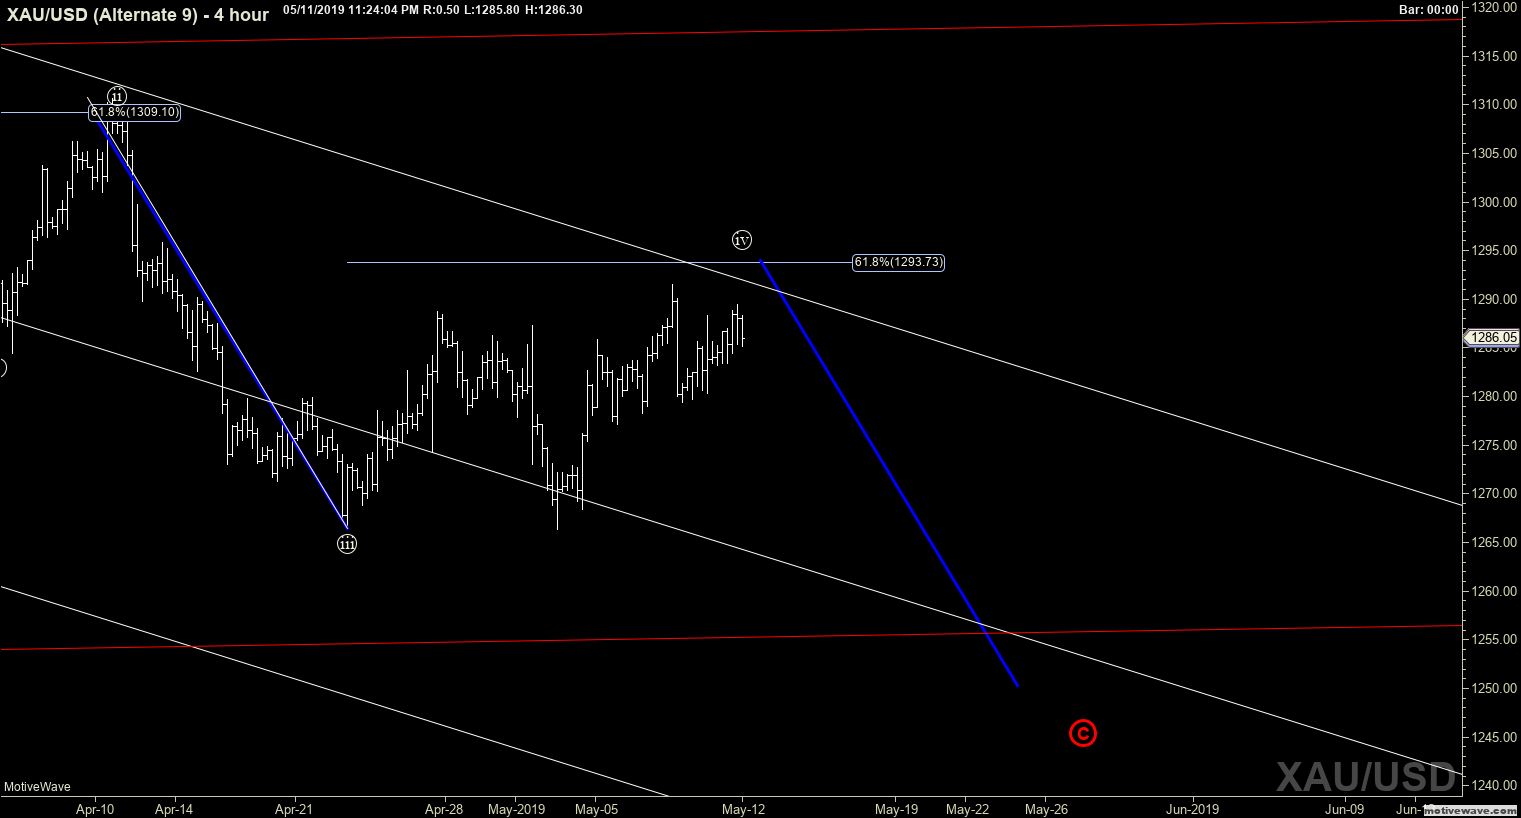
Still corrective, I am WAITING for a impulsive move with an ABCD.


Click image for original size
xauusd alternate 9 may 11 2323 pm 4 hour png
DU
Duane
Rep: 100
Posts: 1,095
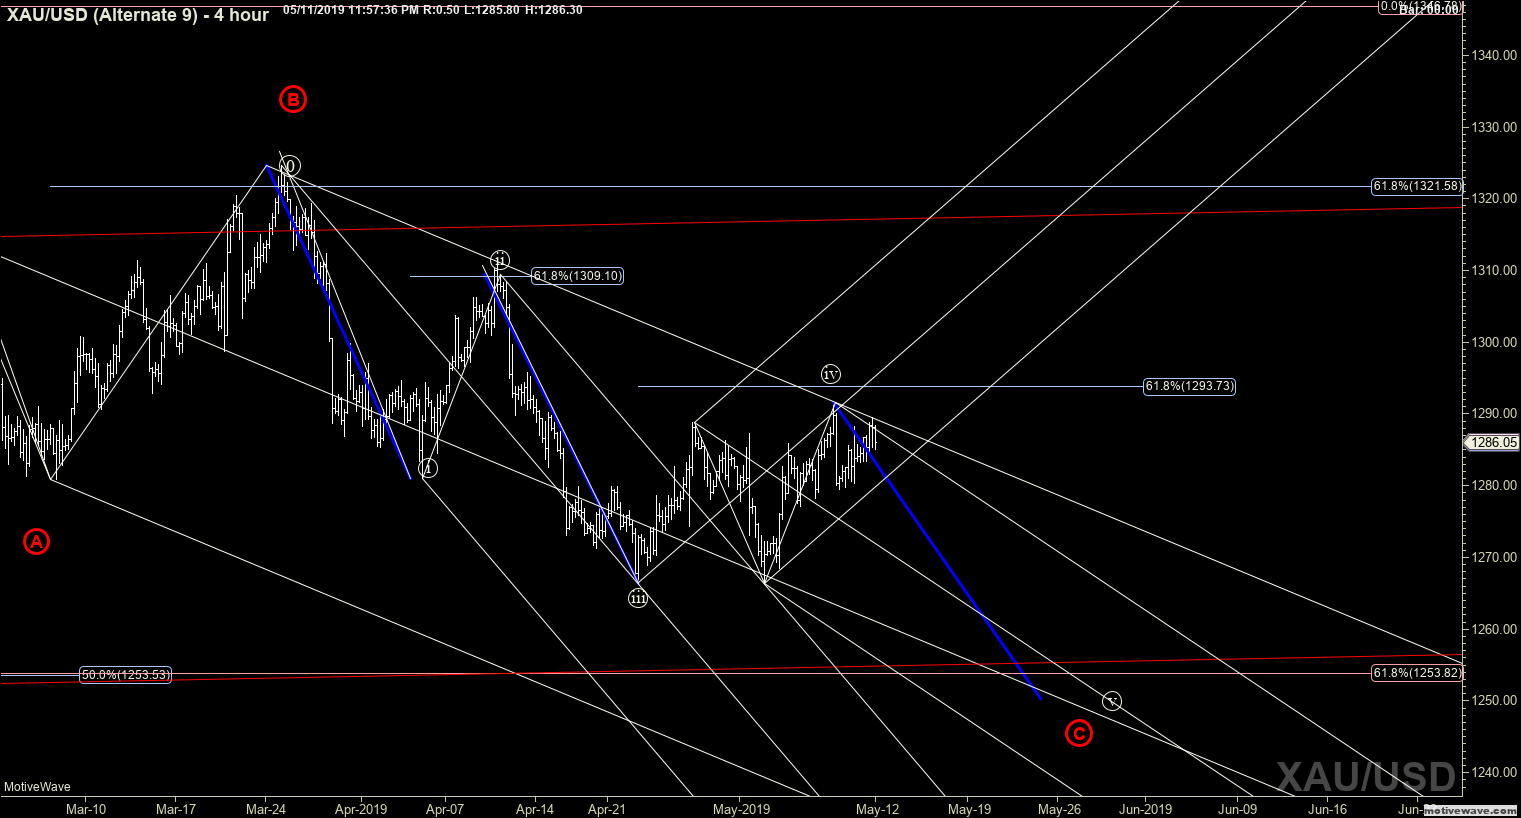
Thats a huge out of proportion ABCD from 3 to 4. Could that mean 1231 is in play? This is why Jim does what he does. Lines and fibs and pattern, and entry signal.


Click image for original size
xauusd alternate 9 may 11 2352 pm 4 hour png
DU
Duane
Rep: 100
Posts: 1,095
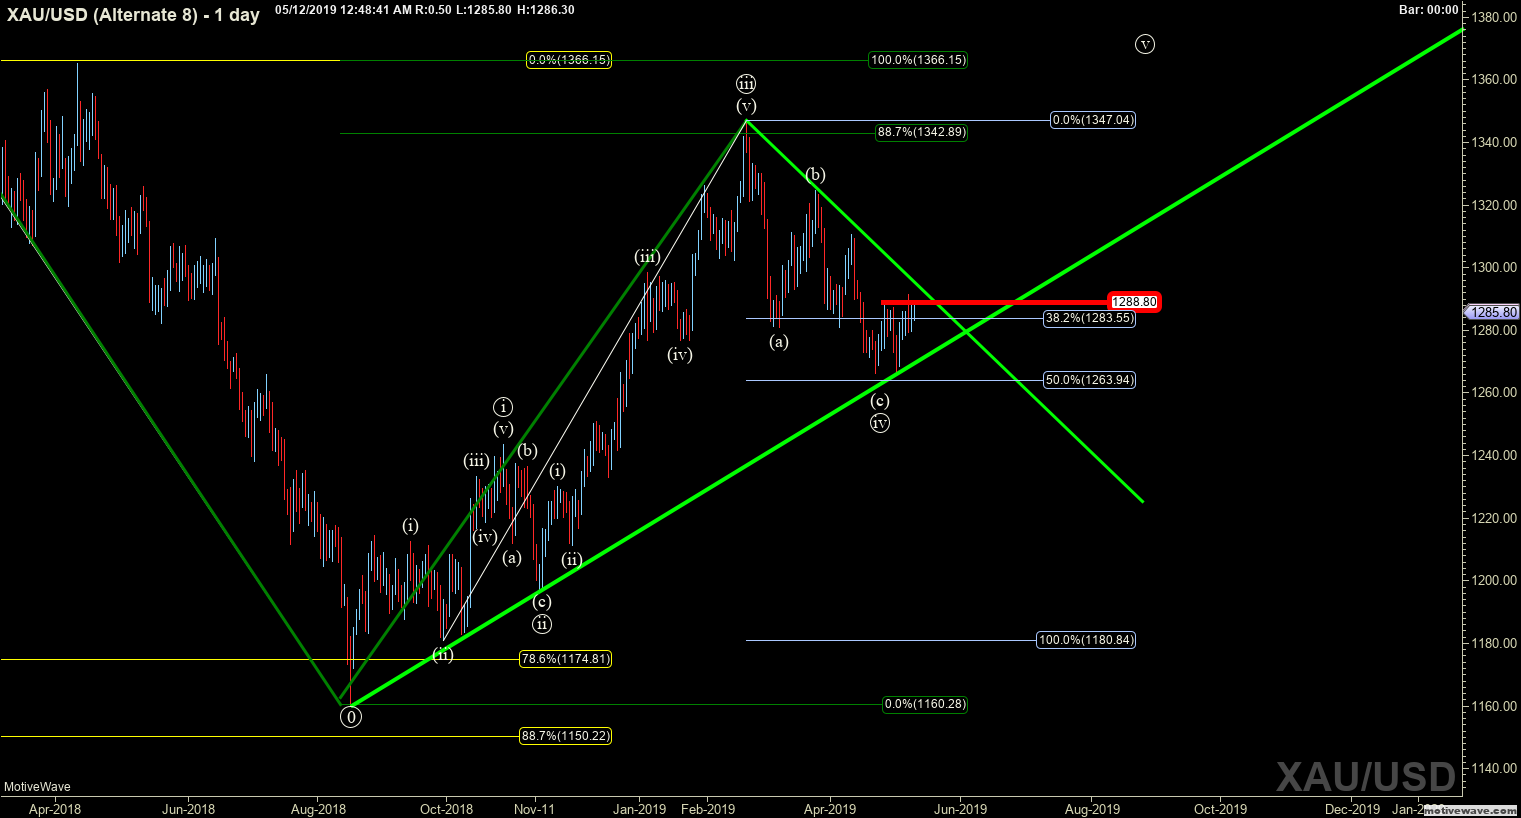
Yeah so, lets trade it, if we breach either trend line I will look for a retest. The breach of 1288 is a higher higher high. So rat let me be perfectly clear about my opinion. I have no idea.LOL


Click image for original size
xauusd alternate 8 may 12 0048 am 1 day png
MA
MarcinO
Rep: 67
Posts: 5,506
Great charts, Duane!
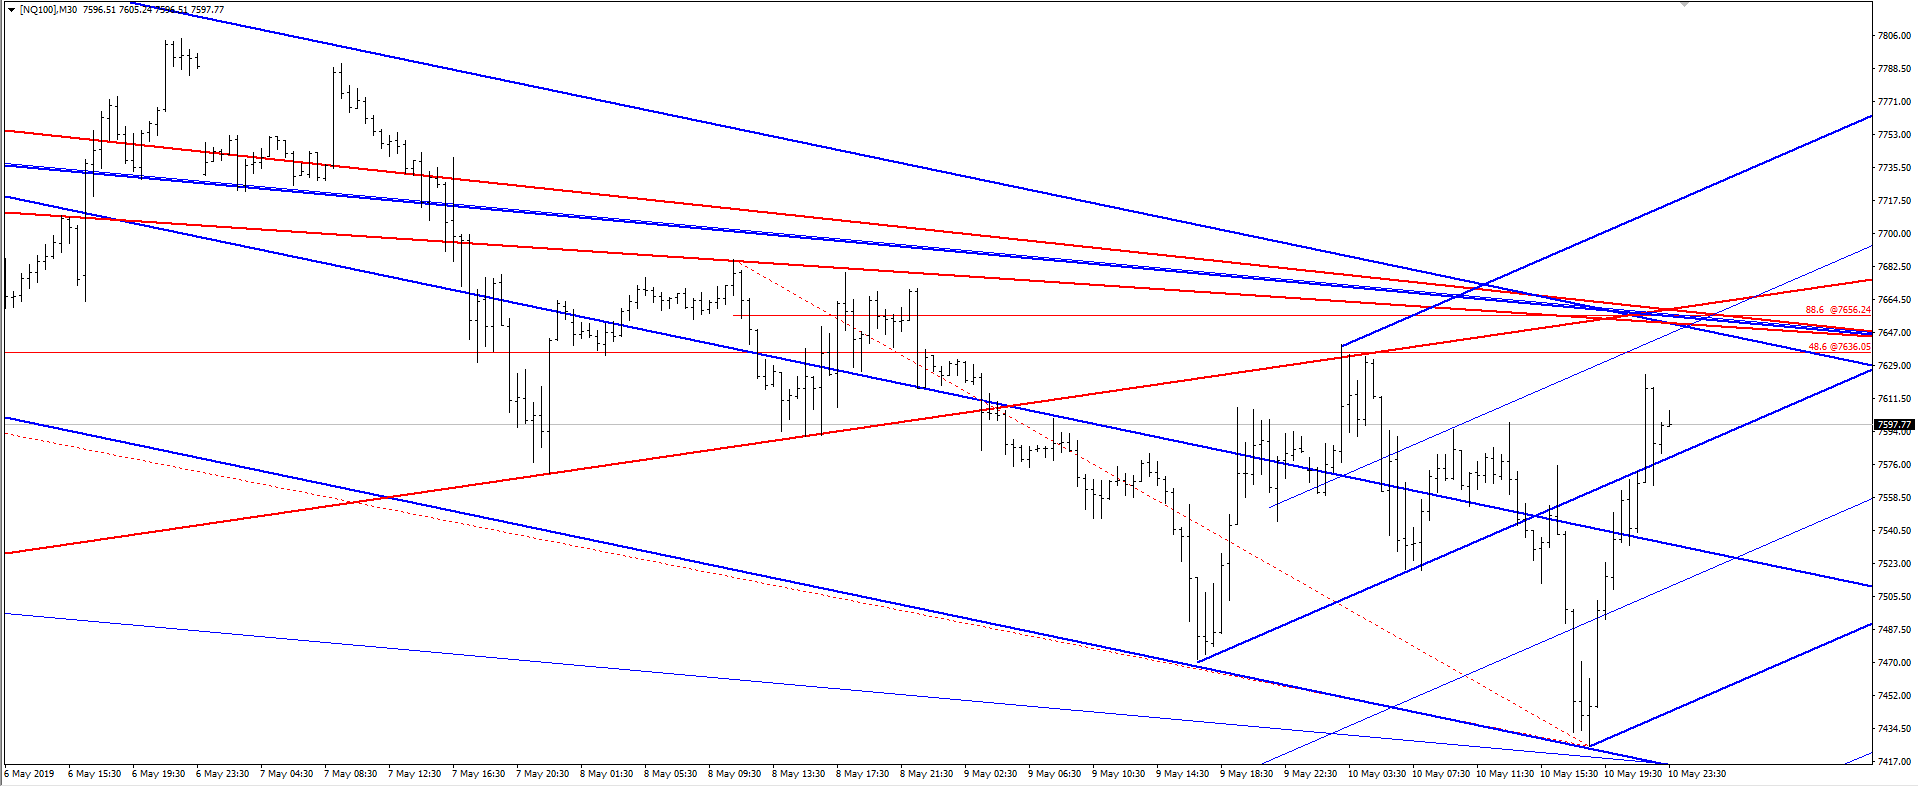
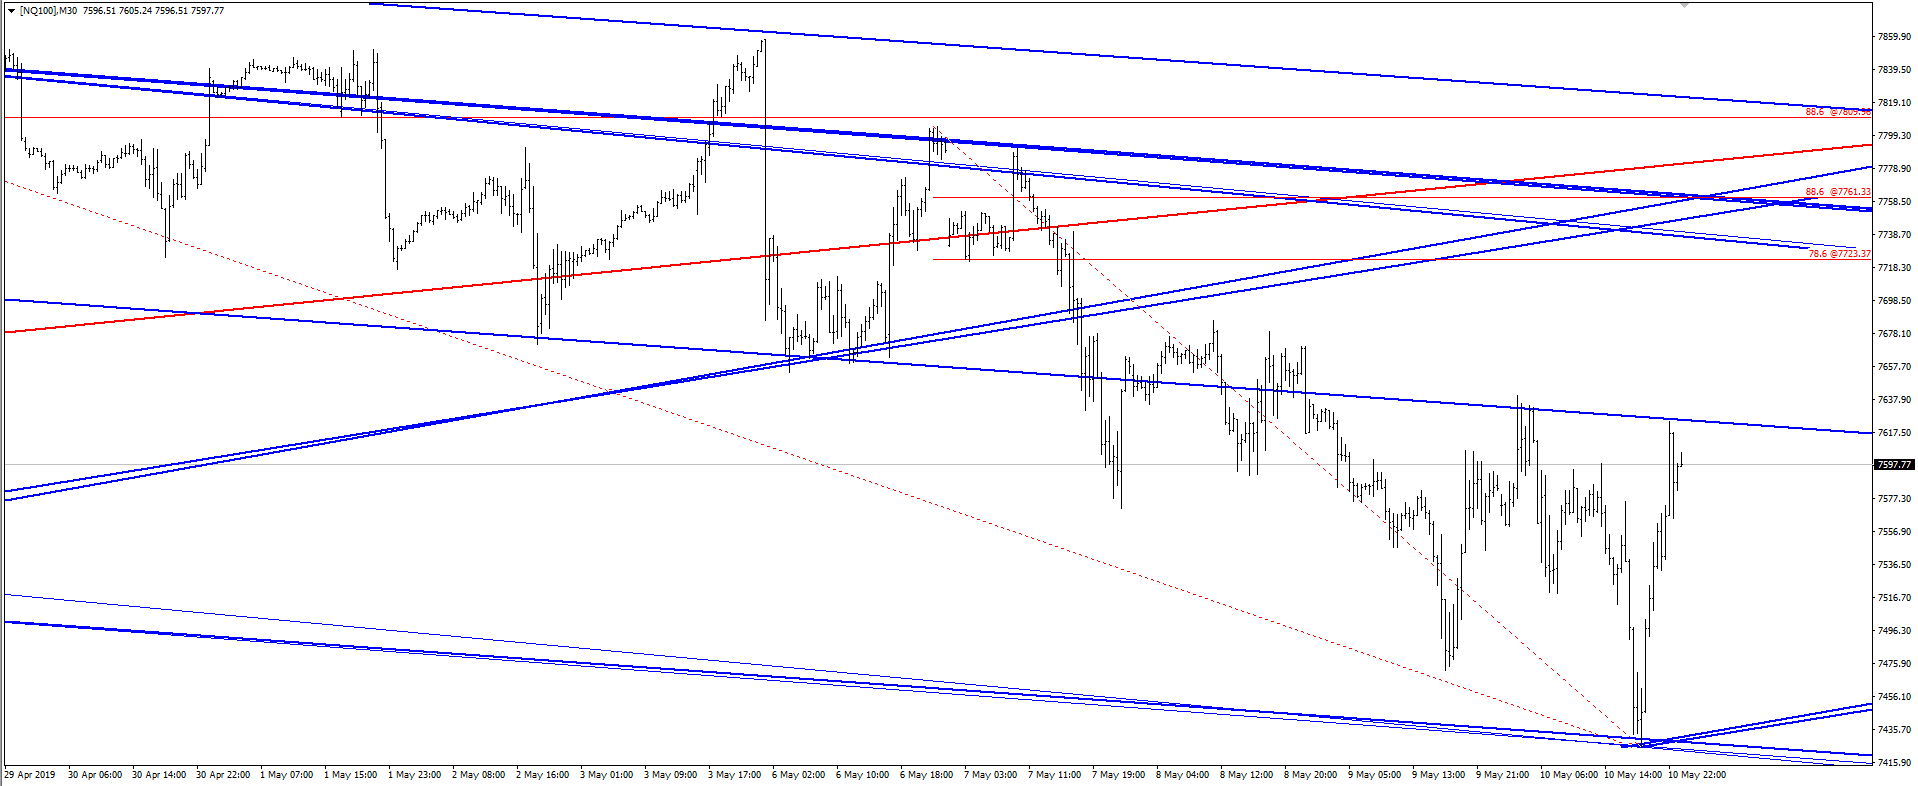
I guess tomorrow (or just after new week starts) Nasdaq will hit 7650 area.

Click image for original size
nq 2019 05 12 png


Assuming, that the move down on daily has not been done yet, I am still not sure this level will be able to send it to new lows. 7725-7750 might be tested next, and given its current propensity for very deep correction 7800 is not out of scope.

Click image for original size
nq 2019 05 12 2 png
RA
rat89
Rep: 0
Posts: 7,015
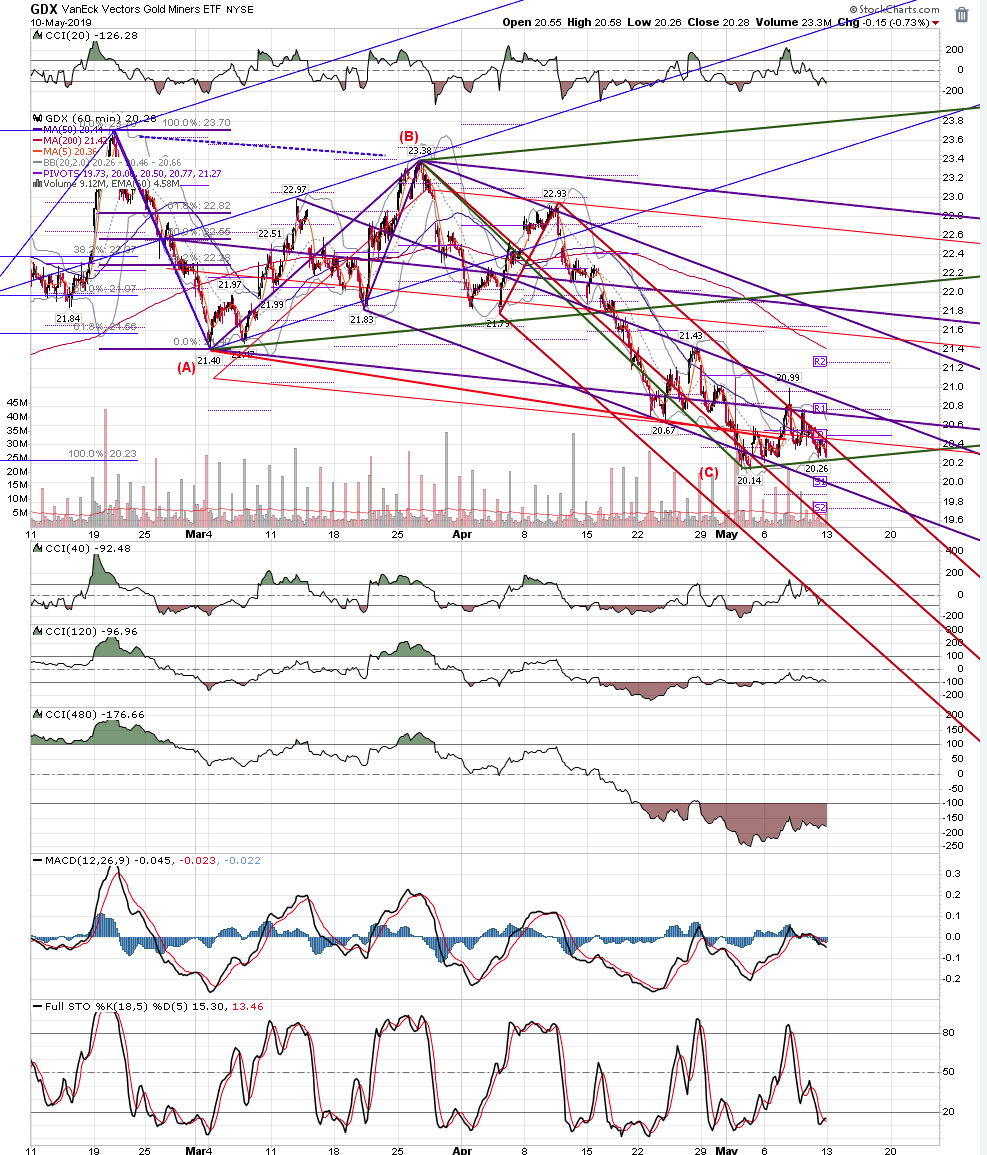
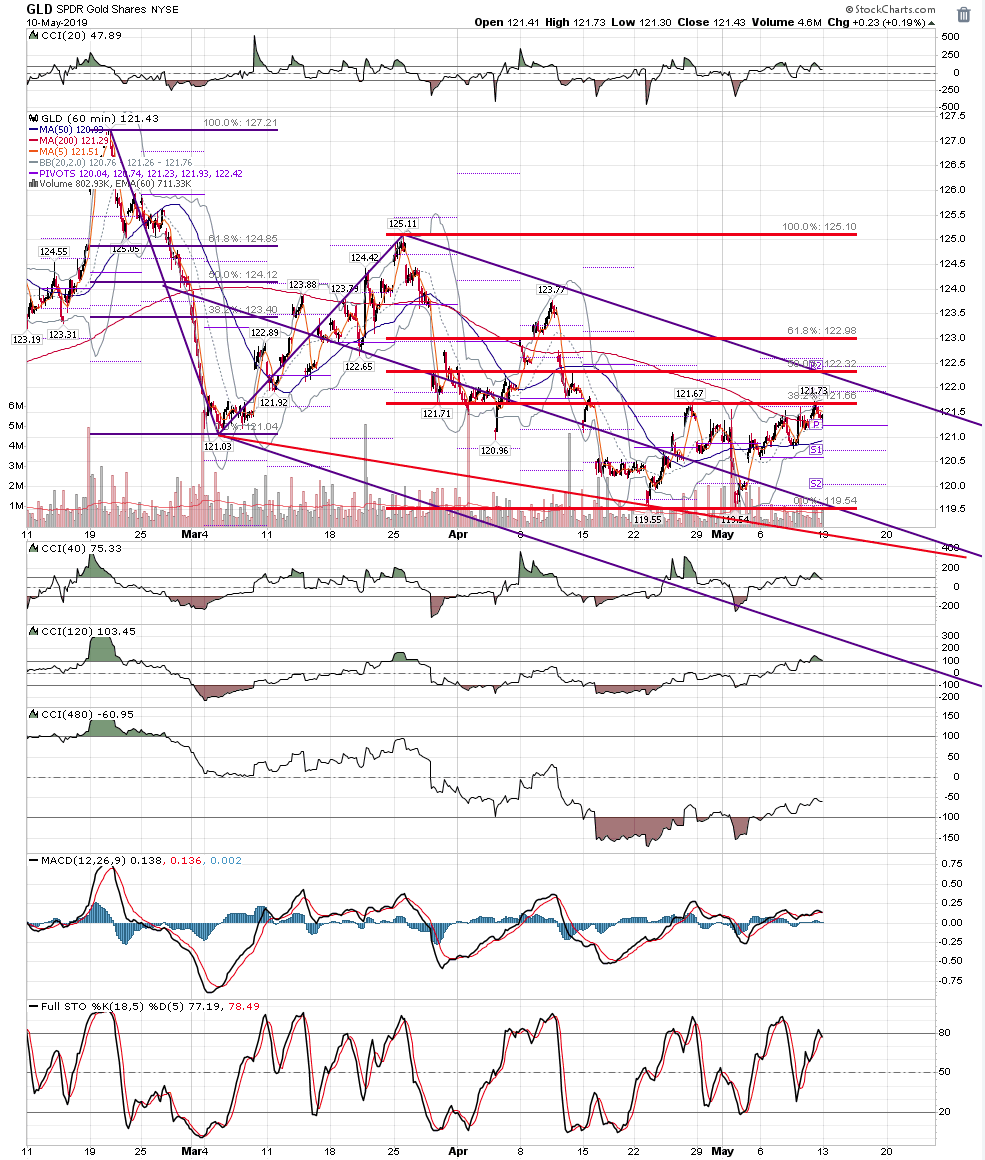
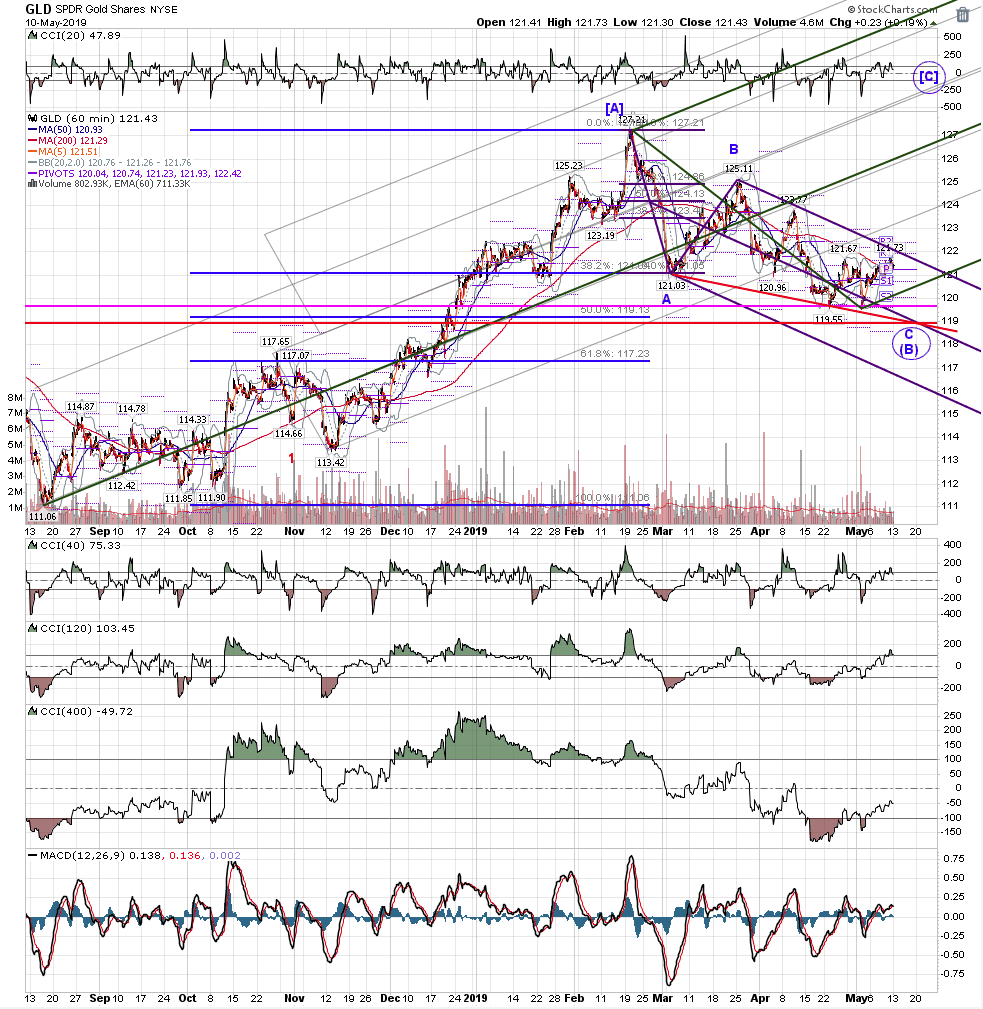
your xau alternate 9 is my thought exactly....gdx has hd multiple retests, and an .886 Friday, but it doesn't feel right. Where was gld during that big spx down last week? Neither up nor down strongly.

gld has a bear abcd, and C=A at 118.93

Click image for original size
screen shot 2019 05 12 at 3 01 13 pm png


Click image for original size
screen shot 2019 05 12 at 3 00 51 pm png

Click image for original size
screen shot 2019 05 12 at 3 03 36 pm png


Originally posted by Duane

Still corrective, I am WAITING for a impulsive move with an ABCD.


Click image for original size
xauusd alternate 9 may 11 2323 pm 4 hour png

MA
MarcinO
Rep: 67
Posts: 5,506
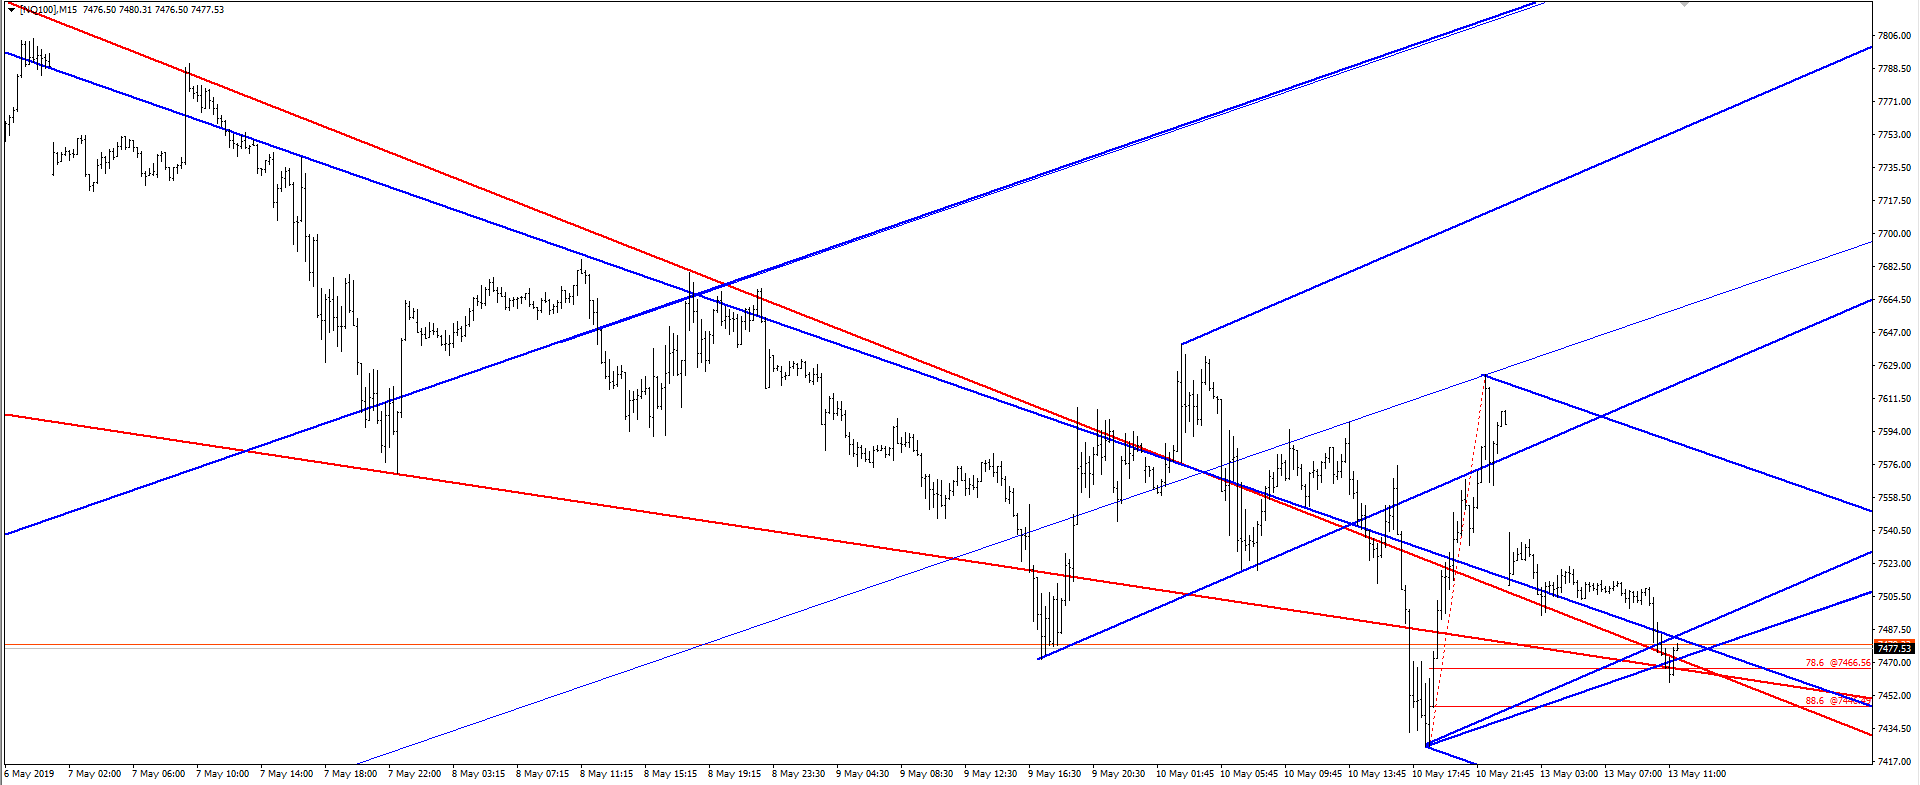
Will Nasdaq rise off 7460 zone? I hope they will send it to 7650, but there are some resistance zones on the way.


Click image for original size
nq 2019 05 13 png
MA
MarcinO
Rep: 67
Posts: 5,506
4 hours of sitting at this support. I guess they want to break it.
AL
albert
Rep: 99
Posts: 3,094
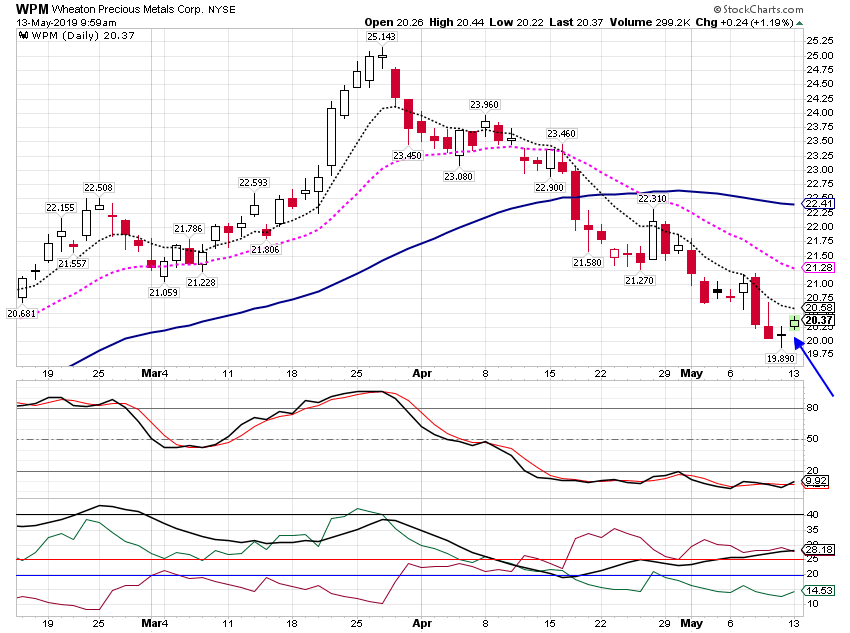
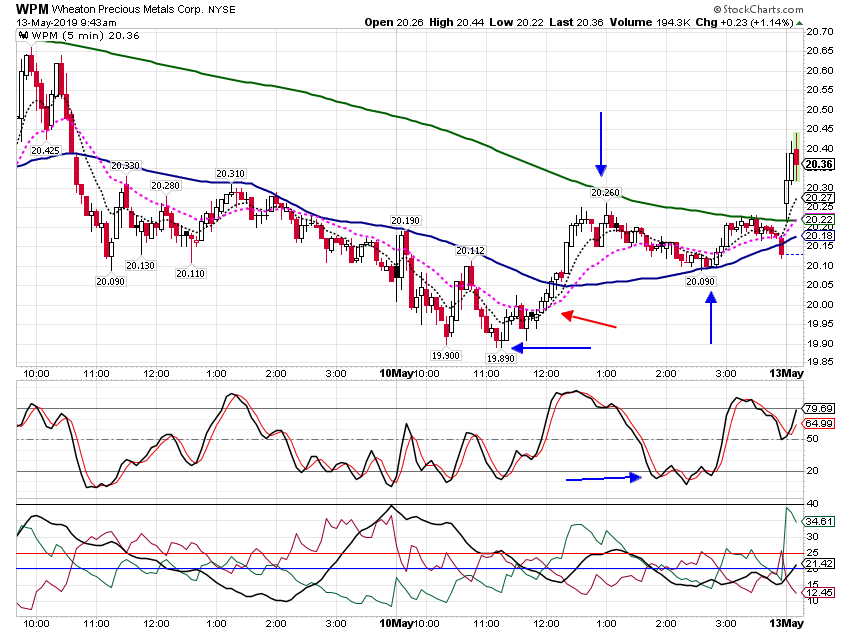
Paper trading on this one. Bought some WPM weekly calls based on the 1234 wfi setup at a STO OS Doji. The gap up after a Doji with STO OS is what Steve Bigelow, a candlestick guy, calls your "Best Friend." I made the mistake of placing a market order and paid too much to get into the trade. :--(


Click image for original size
sc713 png


Click image for original size
sc712 png
RA
rat89
Rep: 0
Posts: 7,015
Click image for original size
screen shot 2019 05 13 at 10 08 00 am png
RA
rat89
Rep: 0
Posts: 7,015
Click image for original size
screen shot 2019 05 17 at 2 26 25 pm png