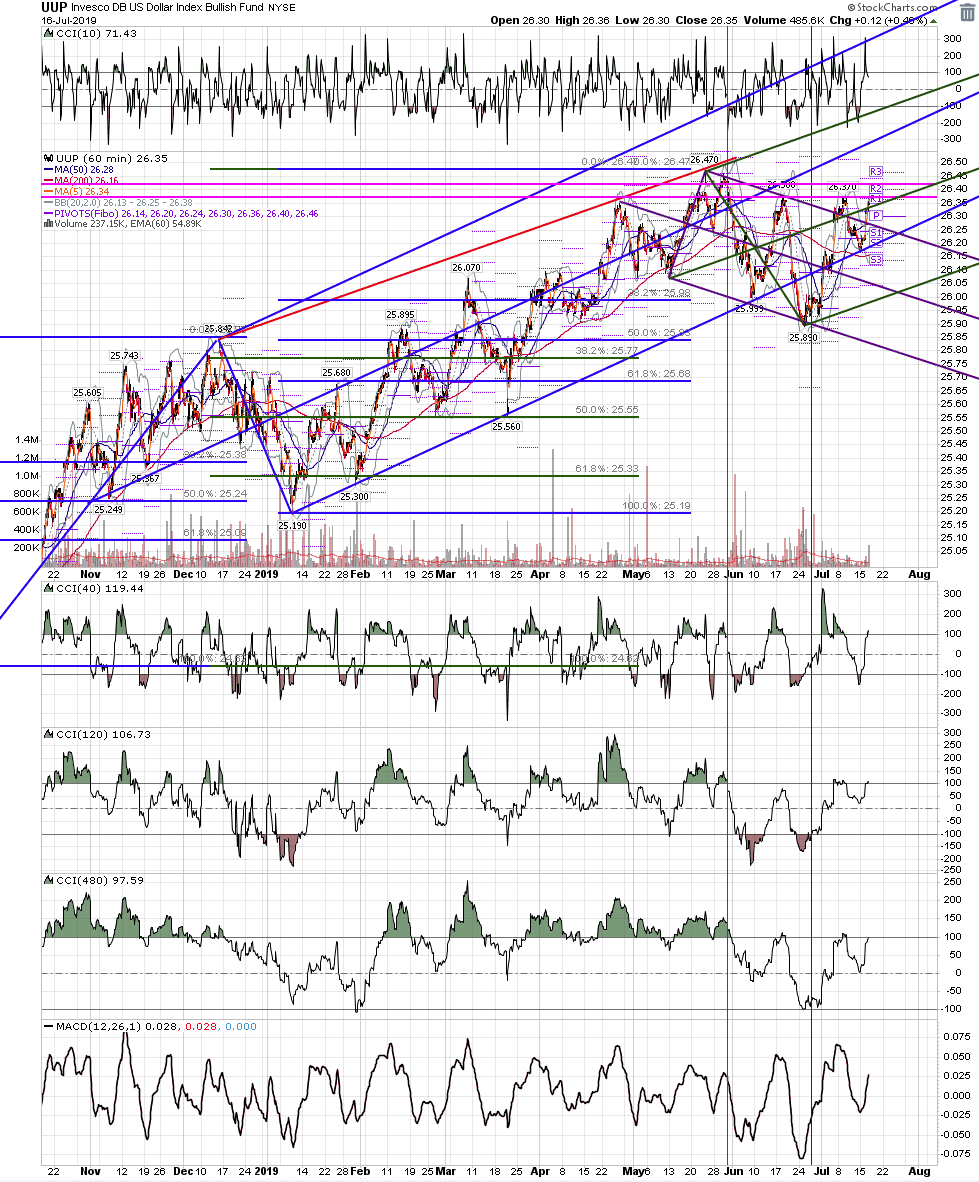
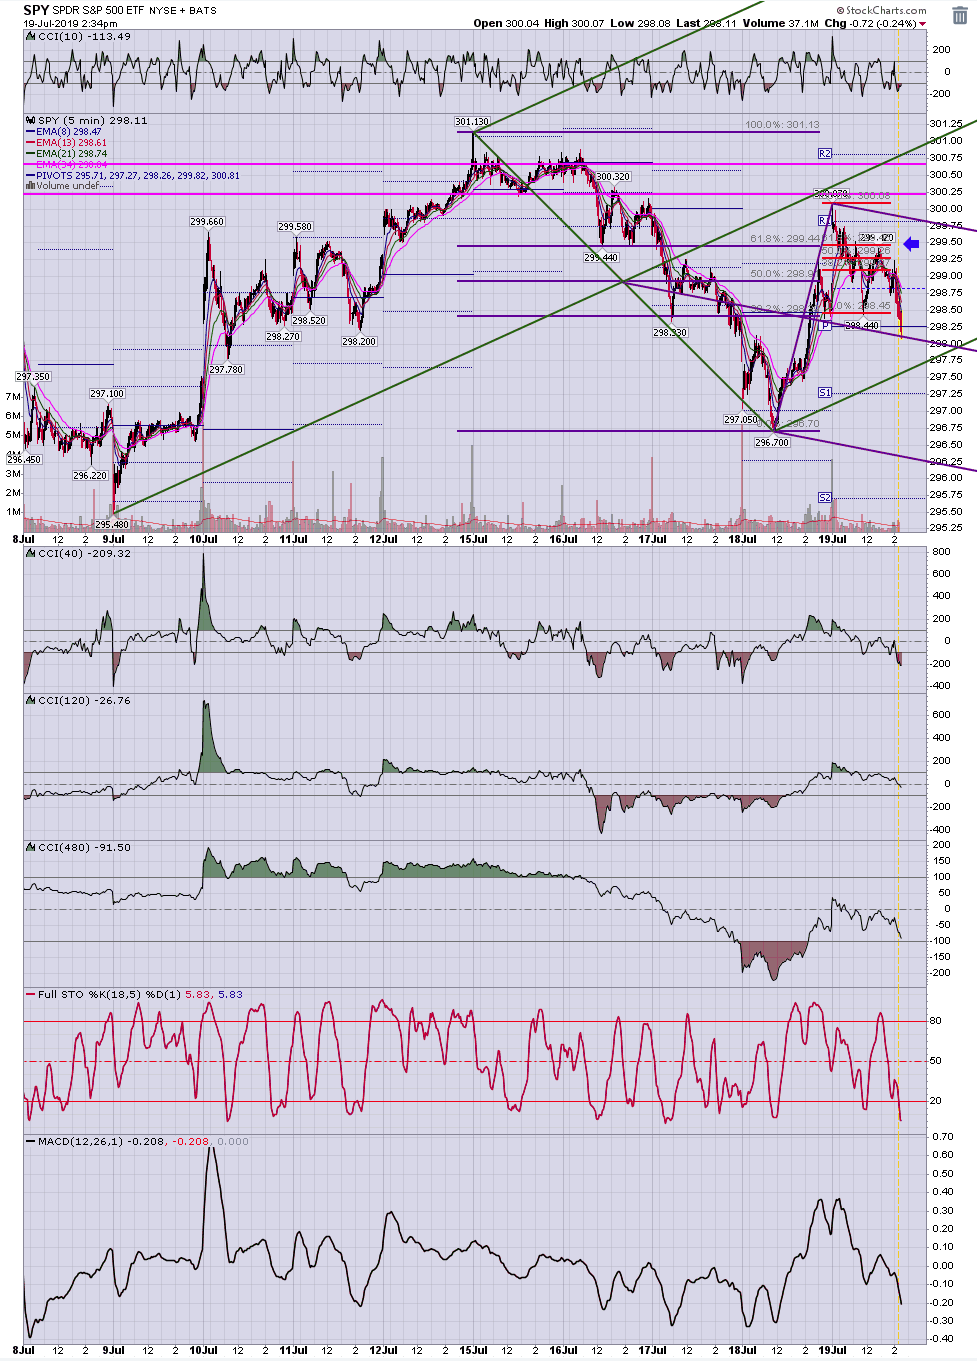
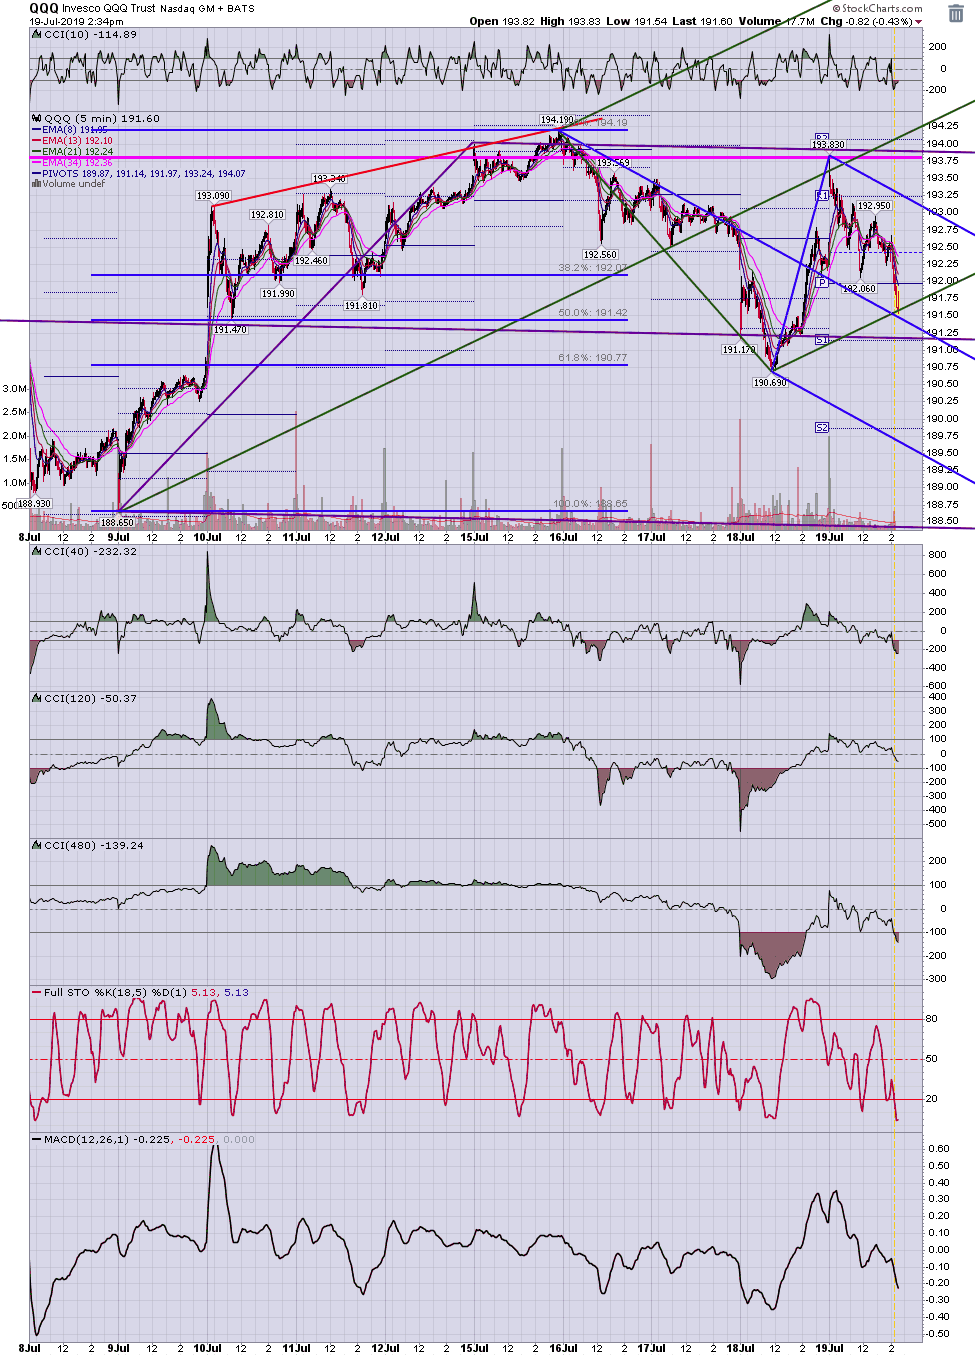
Starting it off.
Al
RA
rat89
Rep: 0
Posts: 7,015
thank you Al, now let's see what they all do. (die, pig, die!) ;)
Originally posted by albert
rat,
Awesome charts.
Al
MA
MarcinO
Rep: 67
Posts: 5,506
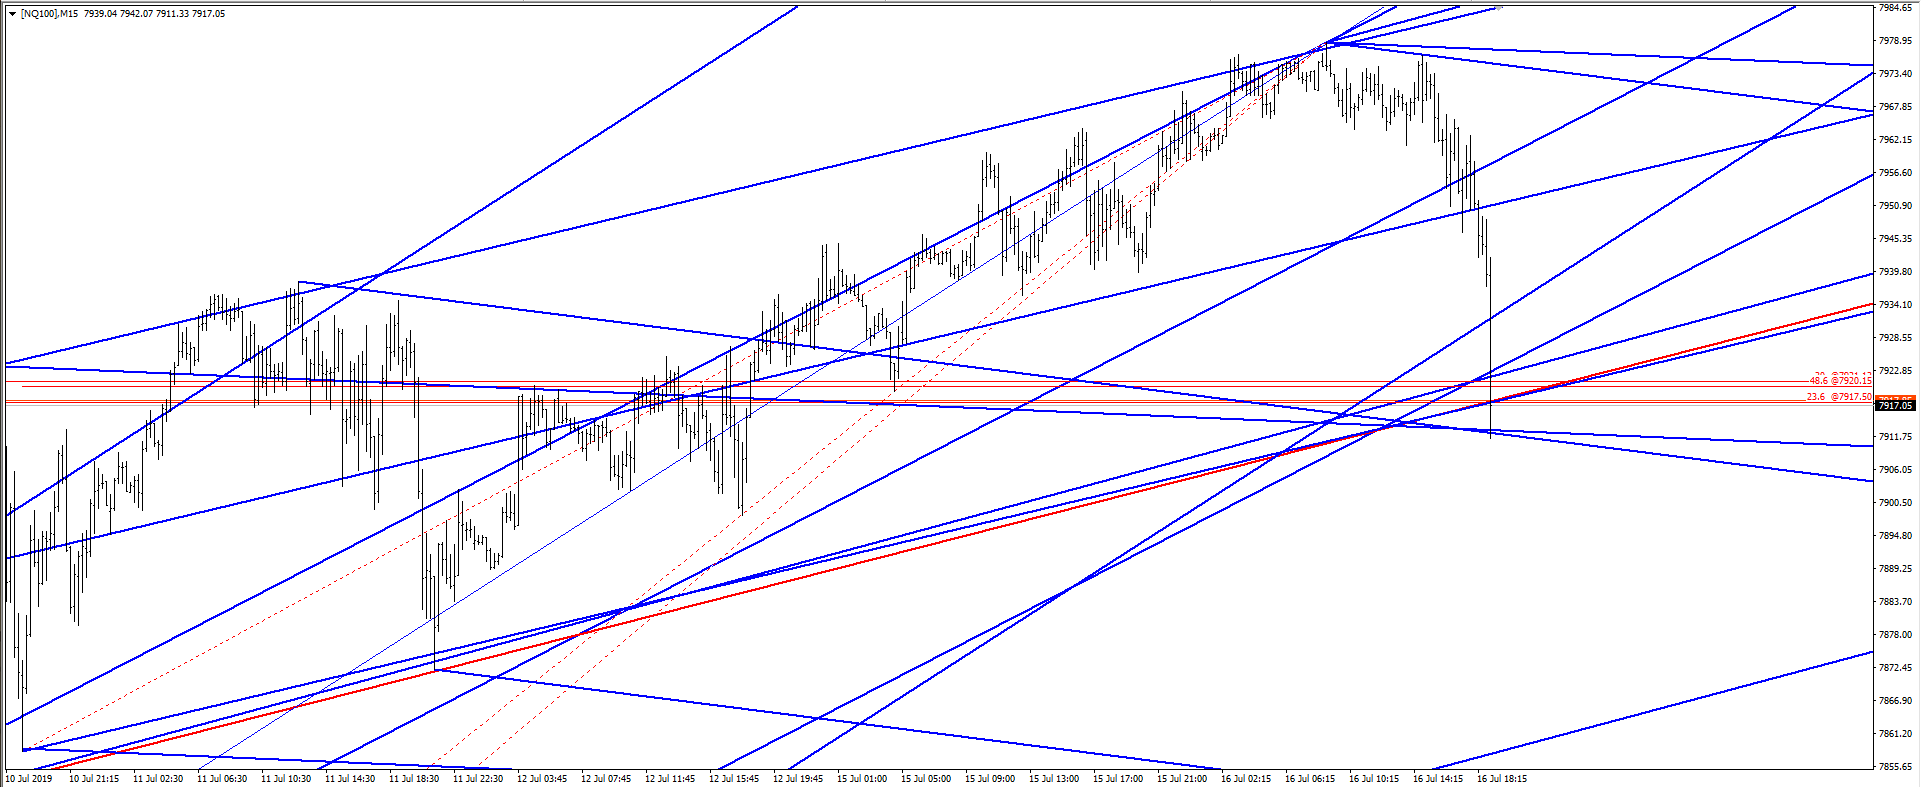
No time to place a clean chart here, but Nasdaq is faliing more, so probably it will test 7880 before a reversal.
RA
rat89
Rep: 0
Posts: 7,015
spx retracements
from 2007 high – 2009 low:
1576.09 – 666.79 = 2.618 at 3047.34
from september 2018 high to december 2018 low:
2940.91 – 2346.58 = 1.128 at 3016.98
april high to may low:
2954.13 – 2728.81 = 1.27 at 3014.97
from 2007 high – 2009 low:
1576.09 – 666.79 = 2.618 at 3047.34
from september 2018 high to december 2018 low:
2940.91 – 2346.58 = 1.128 at 3016.98
april high to may low:
2954.13 – 2728.81 = 1.27 at 3014.97
MA
MarcinO
Rep: 67
Posts: 5,506
I will place a cleared chart tomorrow, rat, but what happened today makes me think about a larger drop to about 7820-30.
Originally posted by rat89
marcin - sweet! (die, pig, die!)
RA
rat89
Rep: 0
Posts: 7,015
if spx does not take out its high, or certainly the 2045 area, I'm looking for a much larger drop, with a first stop around 2650. Then a retest of the 3000 area before a wave [3] sinks it.
Originally posted by MarcinO
I will place a cleared chart tomorrow, rat, but what happened today makes me think about a larger drop to about 7820-30.
Originally posted by rat89
marcin - sweet! (die, pig, die!)
AL
albert
Rep: 99
Posts: 3,094
rat,
Very interesting. Will look at in more detail later!
Al :--)
Very interesting. Will look at in more detail later!
Al :--)
Originally posted by rat89
spx retracements
from 2007 high – 2009 low:
1576.09 – 666.79 = 2.618 at 3047.34
from september 2018 high to december 2018 low:
2940.91 – 2346.58 = 1.128 at 3016.98
april high to may low:
2954.13 – 2728.81 = 1.27 at 3014.97