Starting it off.
Al
MA
MarcinO
Rep: 67
Posts: 5,506
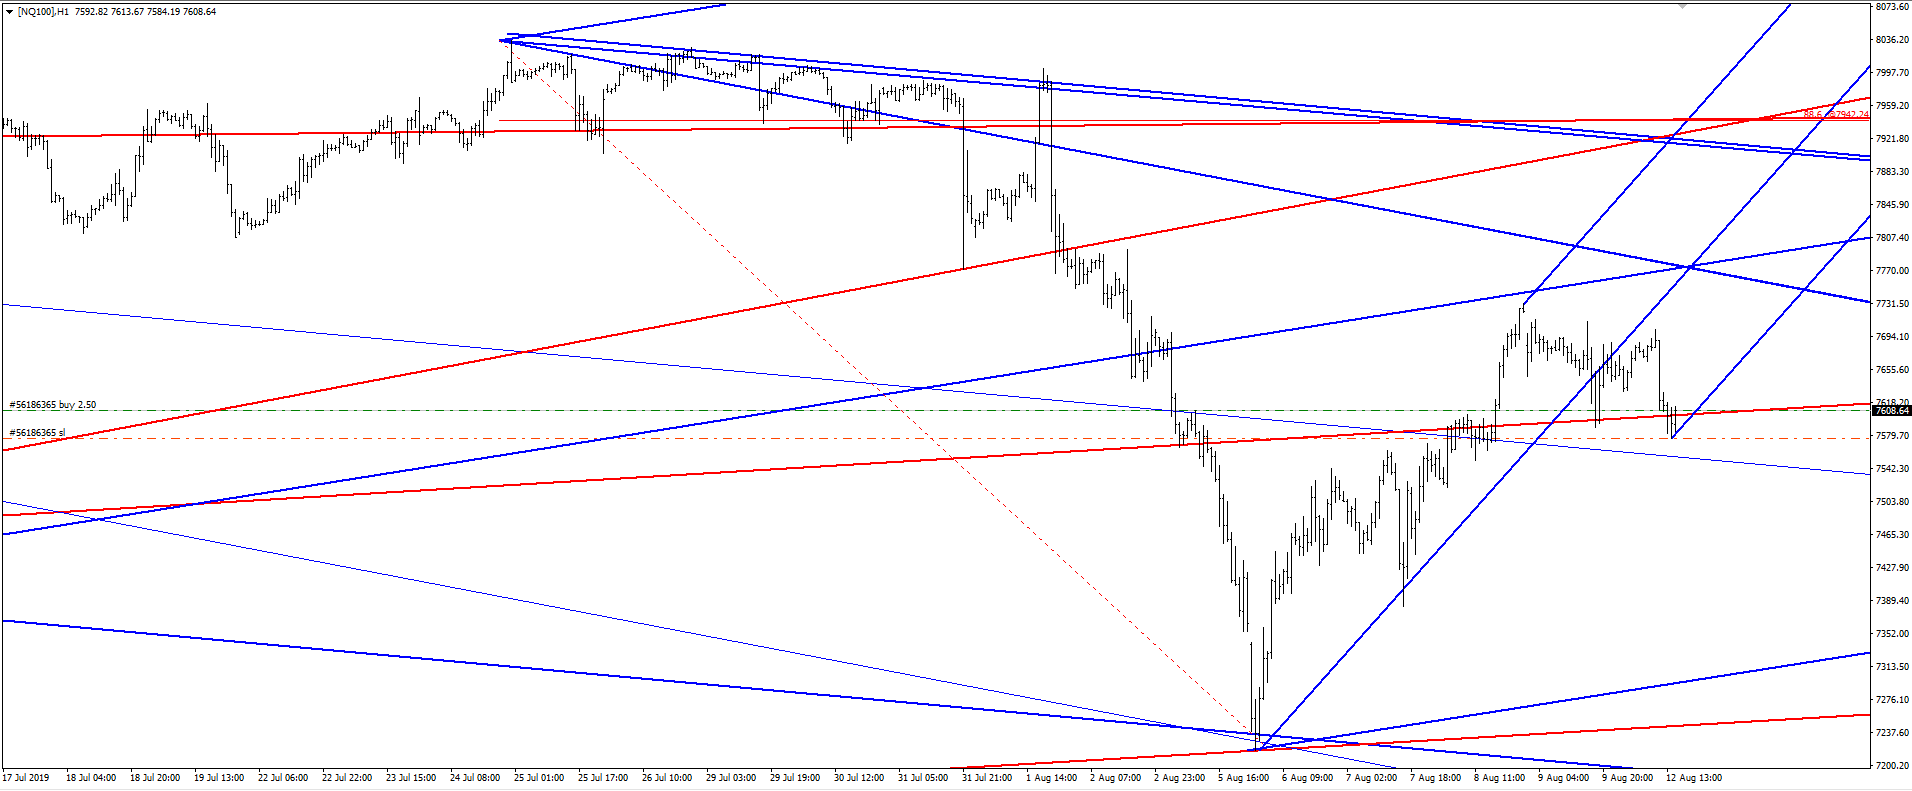
Hi, guys. I guess Nasdaq may test 7770 today before another solid leg down. Low 7900's works as an alternative resistance.
Click image for original size
RA
rat89
Rep: 0
Posts: 7,015
howdy gents, don't forget it's oe week, so we could see some sharp moves ;)
RA
rat89
Rep: 0
Posts: 7,015
Click image for original size
Click image for original size
Click image for original size
Click image for original size
AL
albert
Rep: 99
Posts: 3,094
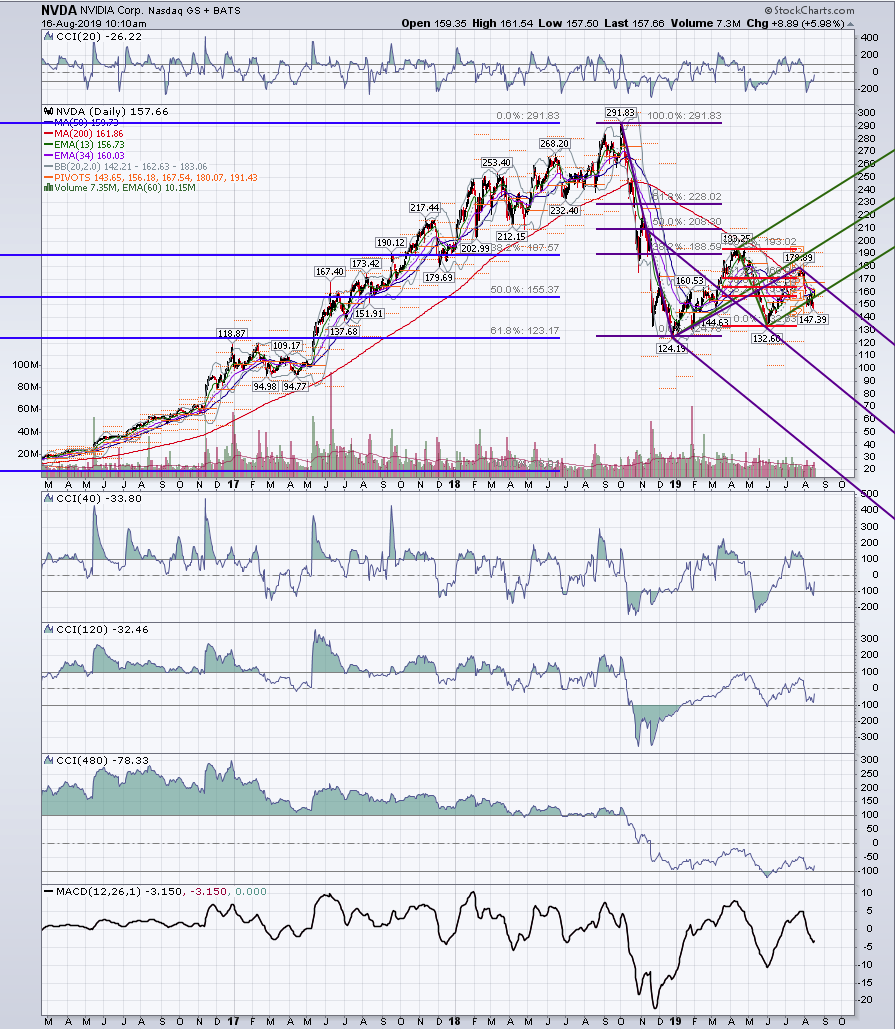
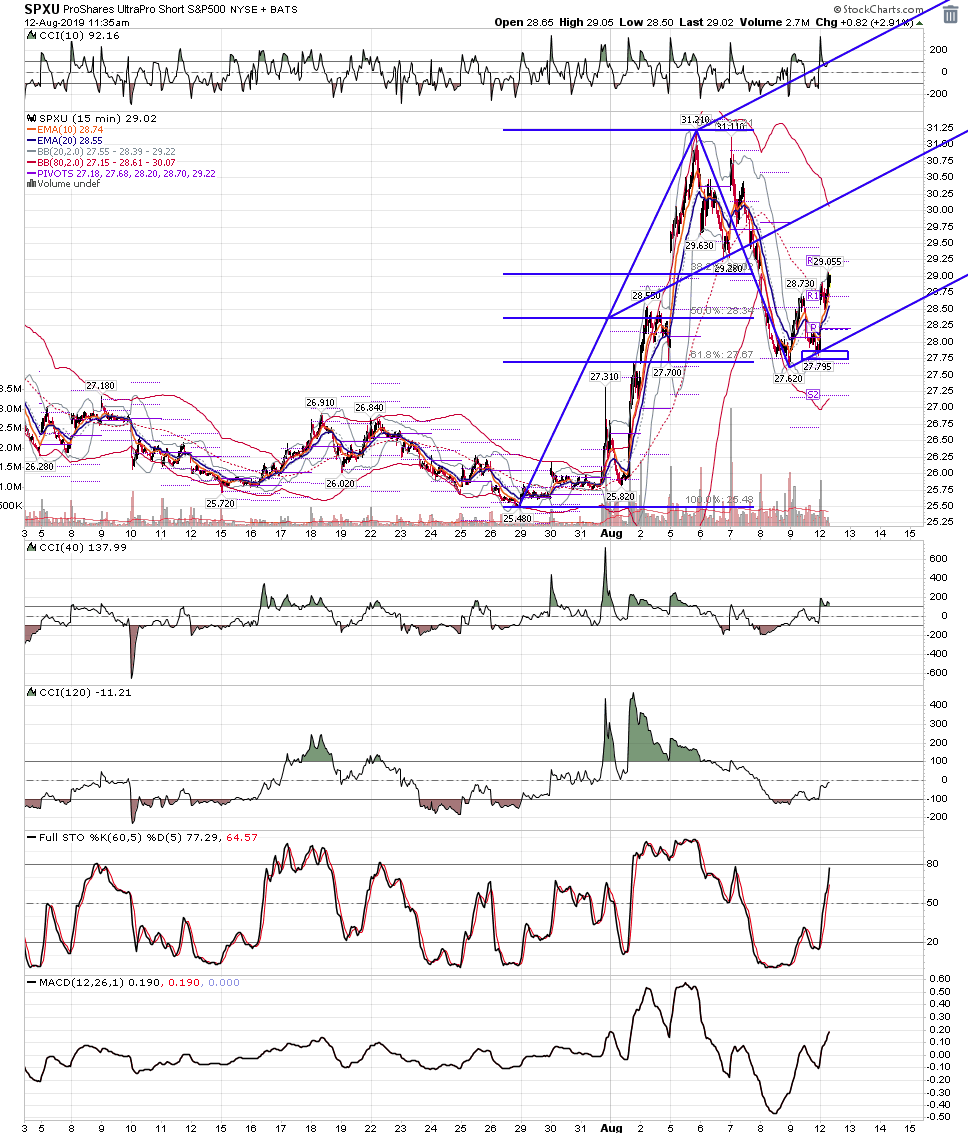
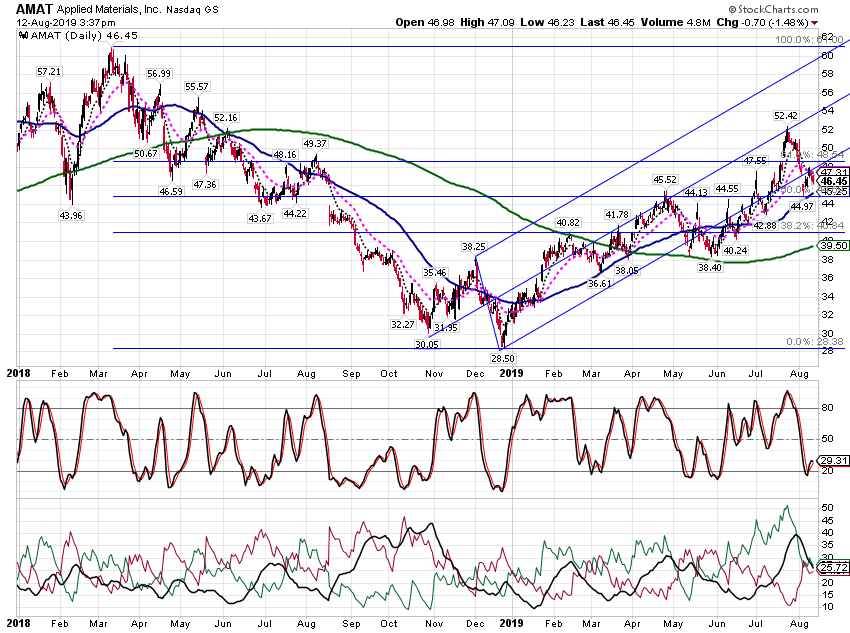
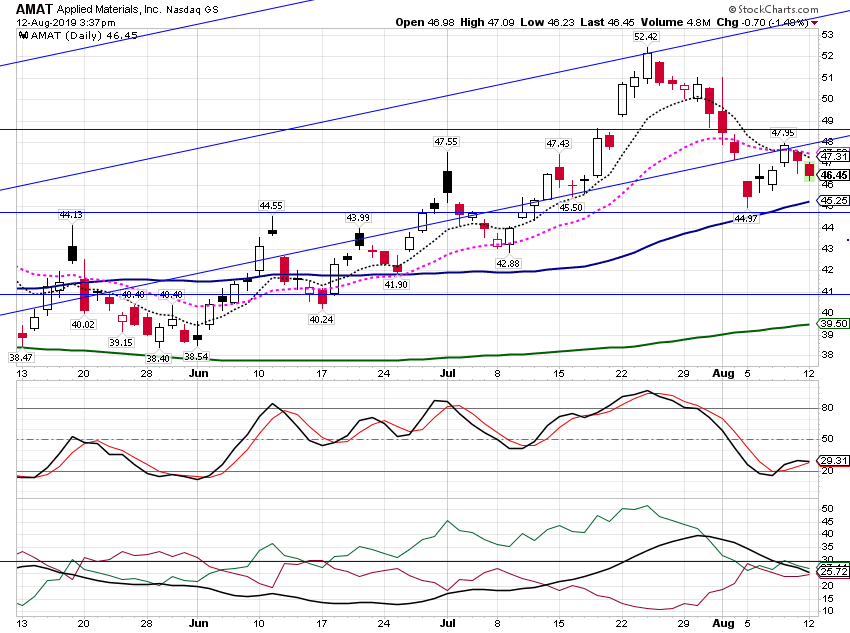
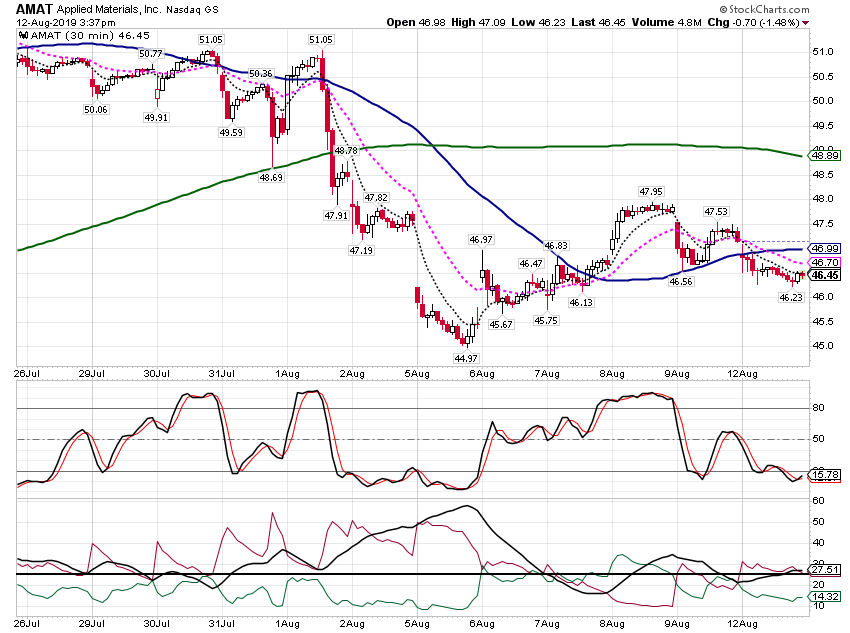
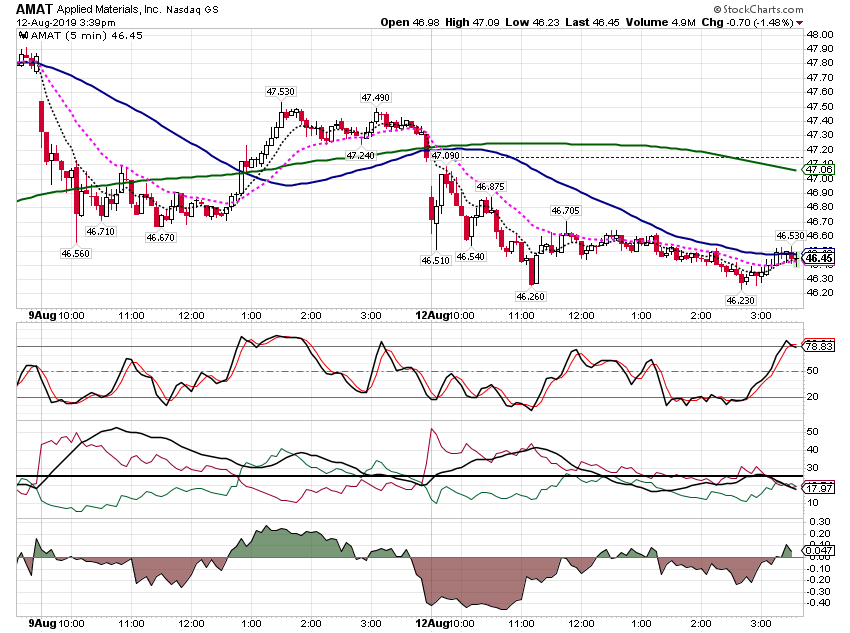
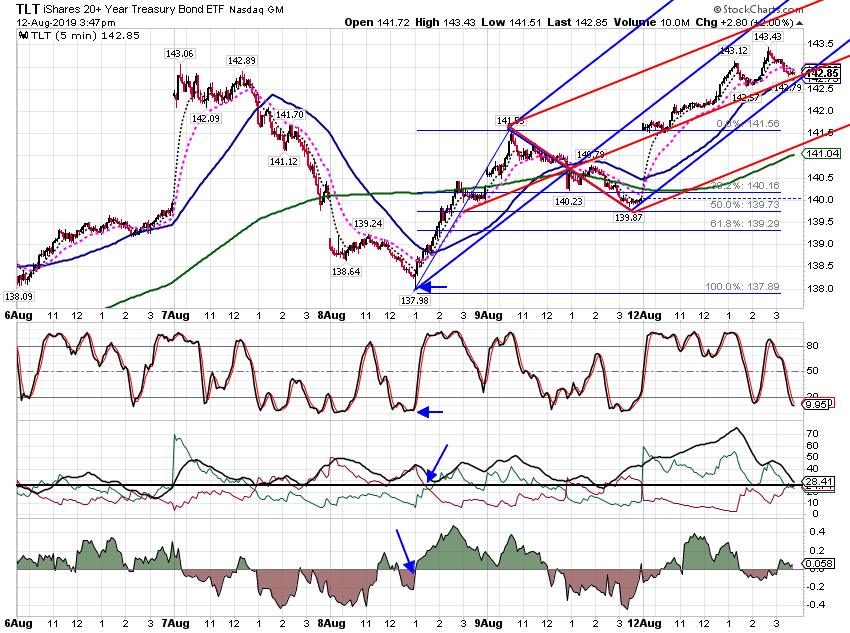
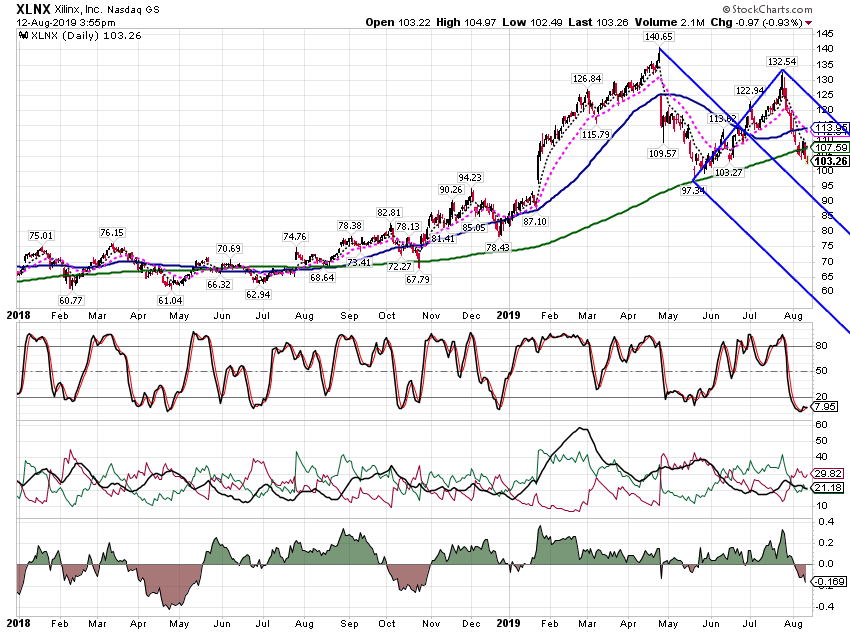
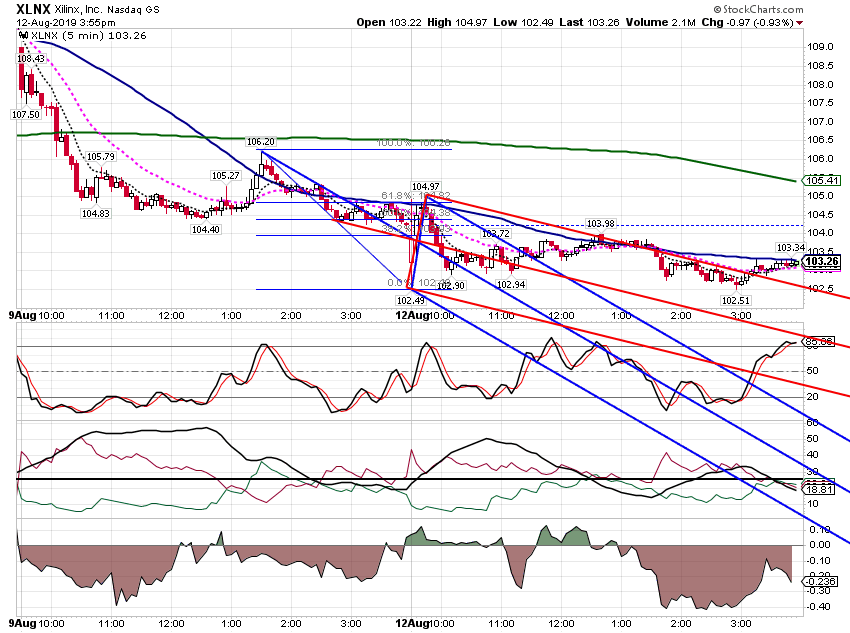
Paper trading. Lost some on AMD and XLNX. Made some on TLT.
Al
Al
Click image for original size
Click image for original size
Click image for original size
Click image for original size
Click image for original size
Click image for original size
Click image for original size
RA
rat89
Rep: 0
Posts: 7,015
spx 60 - with and without annotations for the bear count - remember, the bear count is that spx topped at 3028. the bull count is that 2822 was only minor 2 of Major [3] P5. Be aware that this is oe week, and that prices tend to make extreme moves into oe, frequently with one major reversal during oe week. So the question is, was Monday the reversal, or was Tuesday the reversal? Tricky.
Click image for original size
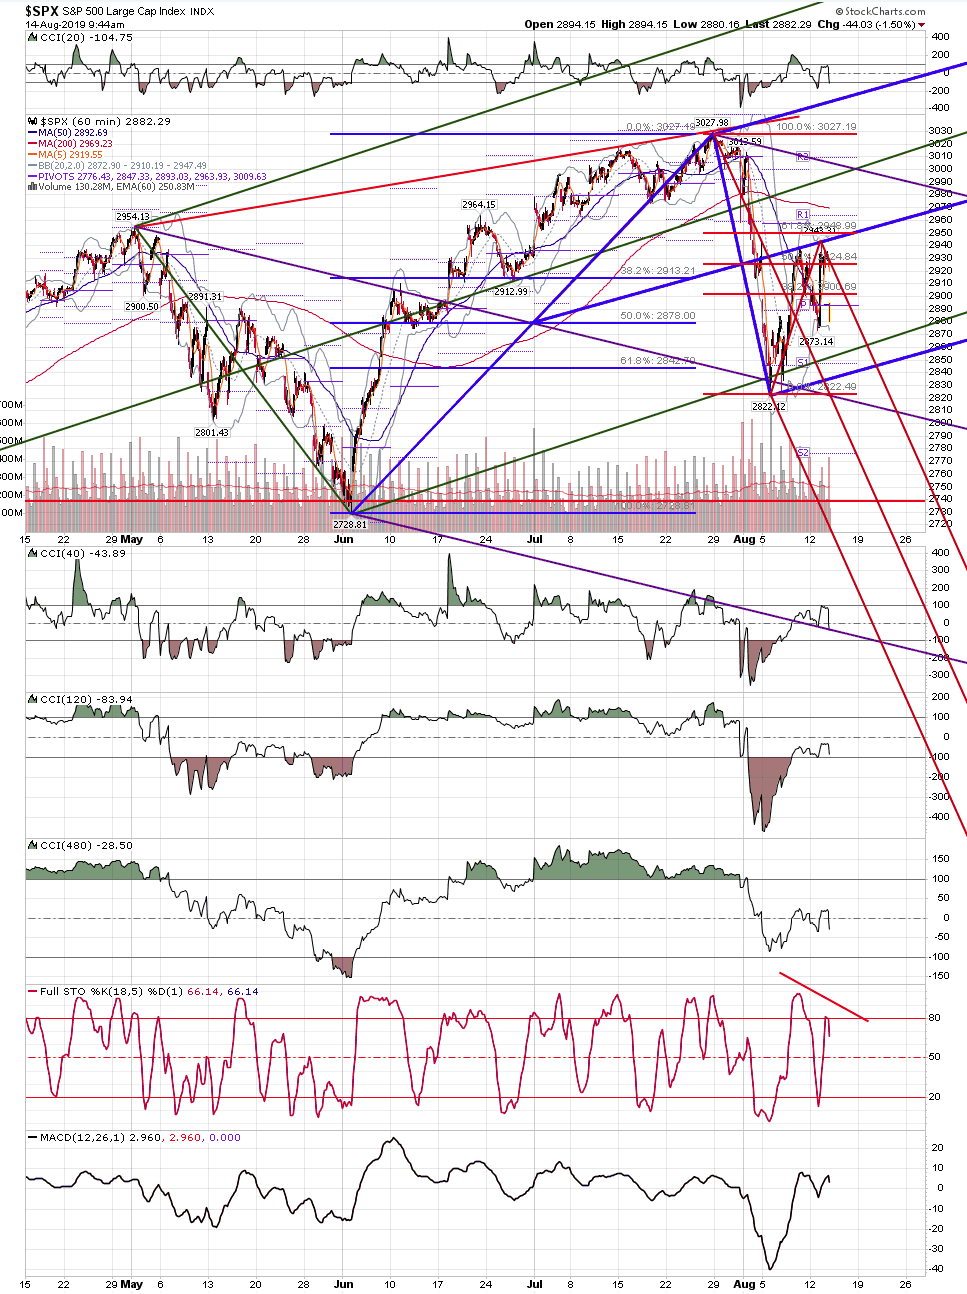
Click image for original size
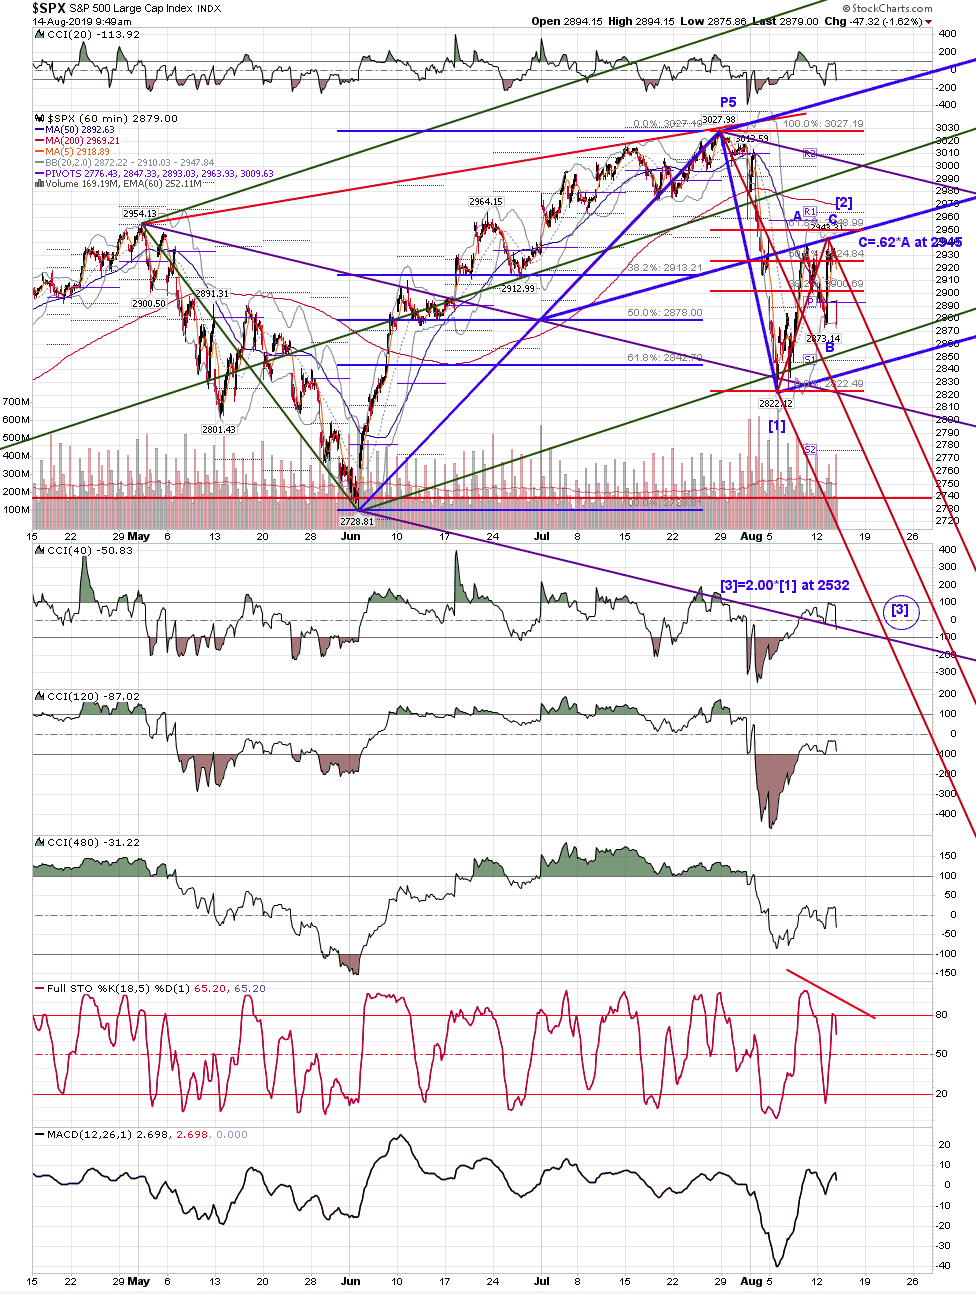
RA
rat89
Rep: 0
Posts: 7,015
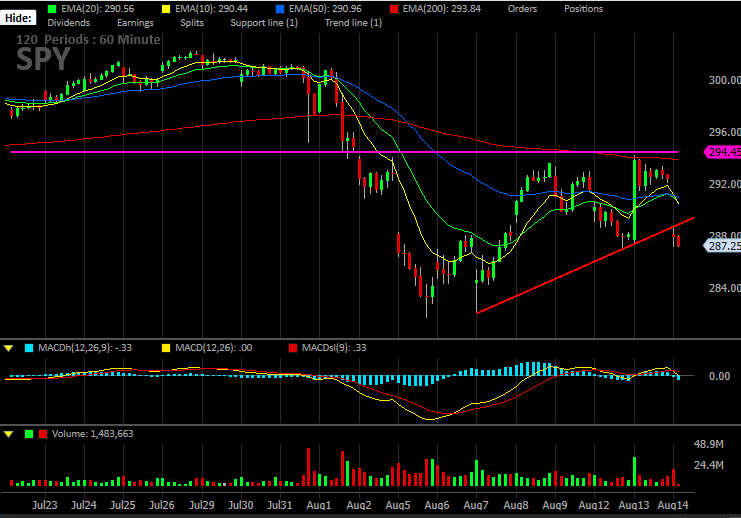
spy 60 - there is a potentially bullish 5 waves up to 294.15, where it stalled at the .618 retrace of the drop.....for the bullish setup, a retest of the low area in the .786 - .886 zone = 284.38 - 283.14 would be a typical wave 2 given the volatility, and a good setup for a wave 3 move up, but that low would probably not present itself until early next week. For the bear setup, there is a bear flag with an ABC move up to the .618 retrace of the drop, where C=.62*A at 294.36
Click image for original size