Starting it off.
Al
AL
albert
Rep: 99
Posts: 3,094
rat
yaw (you are welcome)
Al :--)
yaw (you are welcome)
Al :--)
Originally posted by rat89
ty
Originally posted by albert
rar,
The explanation was quite good, too.
Al :--)
Originally posted by albert
rat,
Wow. Awesome work and analysis.
Al :--)
AL
albert
Rep: 99
Posts: 3,094
Marcin,
Good work!
Al :--)
Good work!
Al :--)
Originally posted by MarcinO
Great charts, guys.
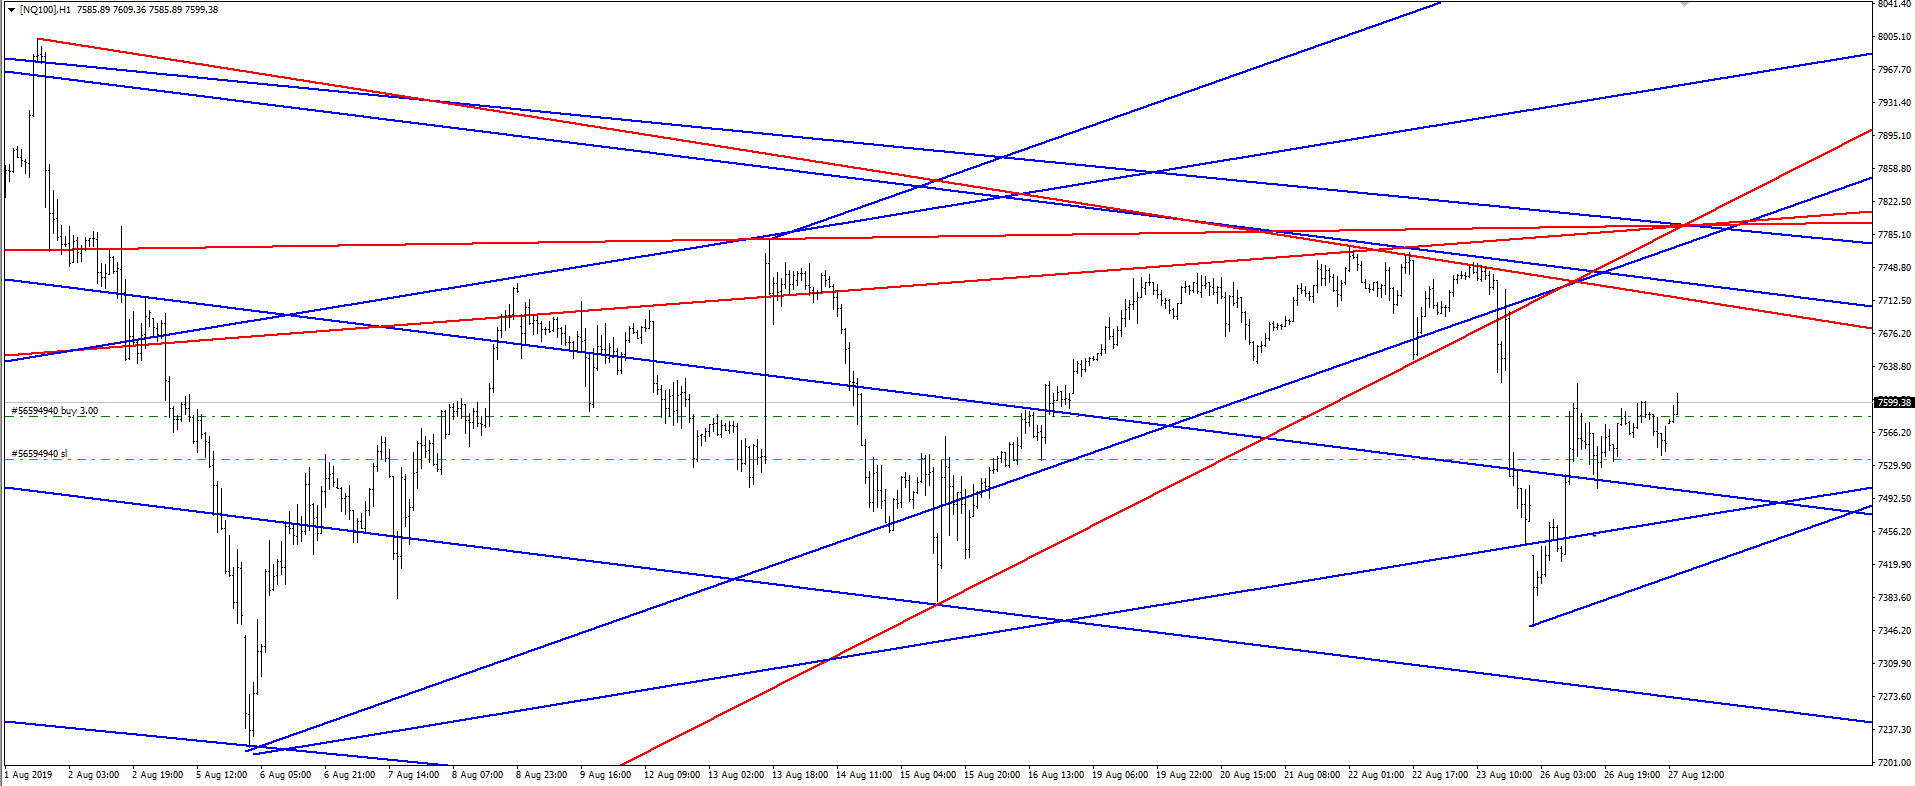
I guess this big ABCD marks the end of Nasdaq's correction on daily TF. 7785 is my first serious resistance in this scenario.
7710-20 is a minor level.
Click image for original size
AL
albert
Rep: 99
Posts: 3,094
Paper trading. Made some on NVDA yesterday. Lost somre more on NVDA today.
Al
Al
RA
rat89
Rep: 0
Posts: 7,015
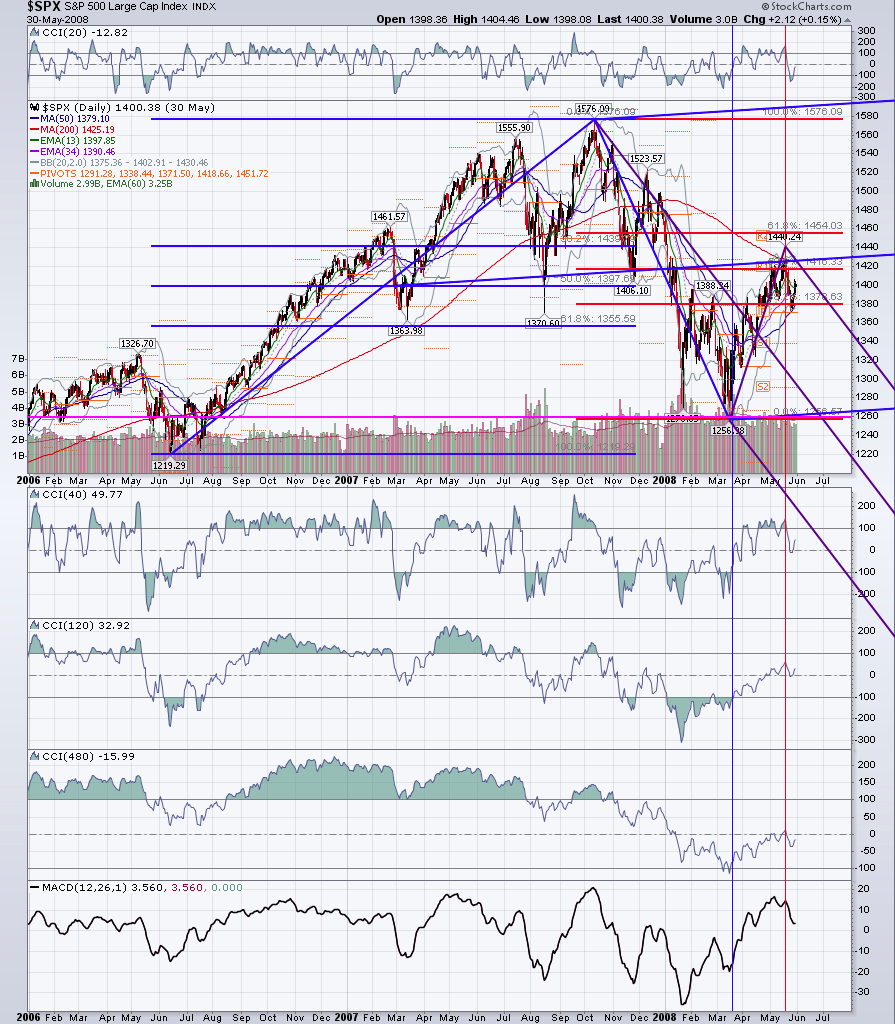
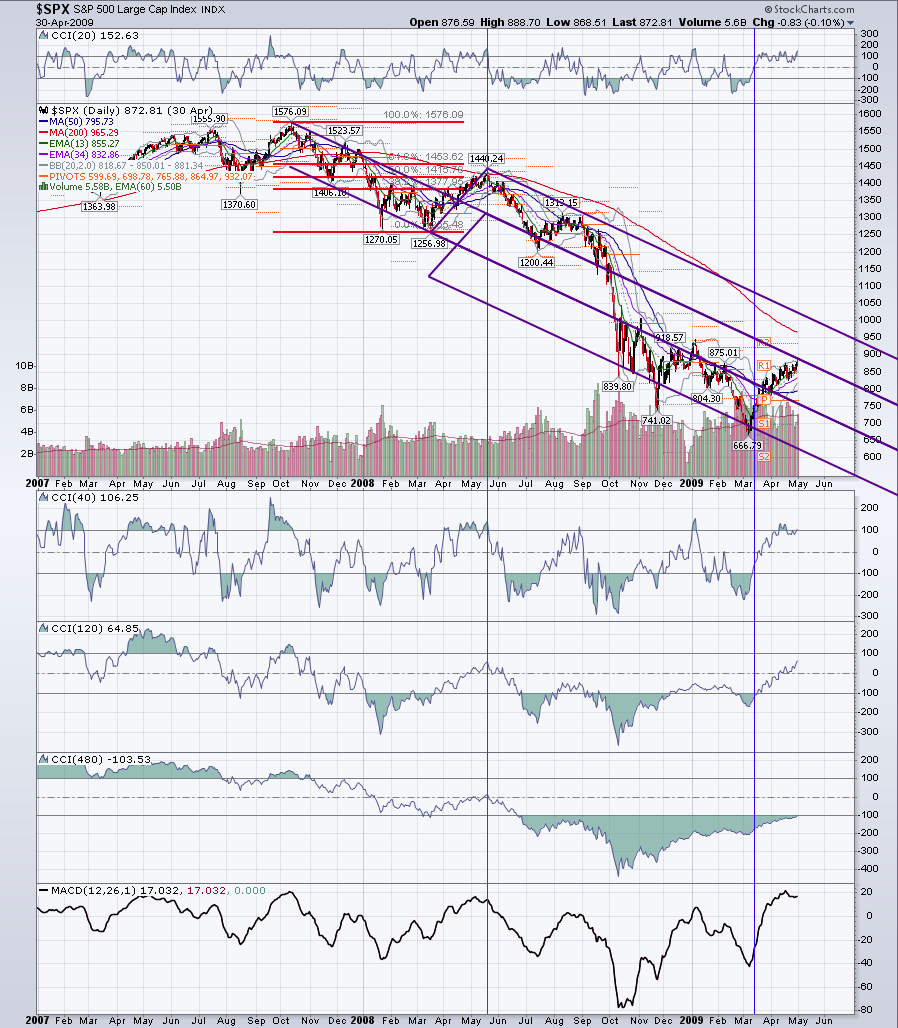
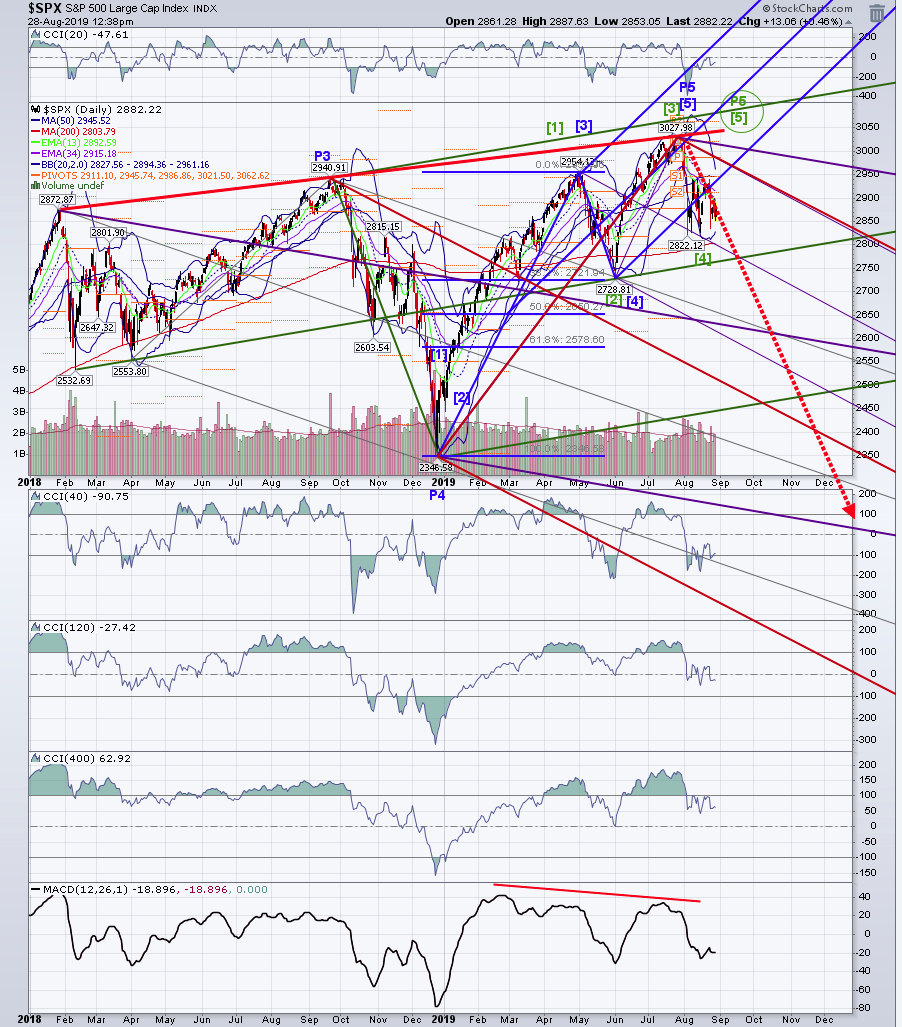
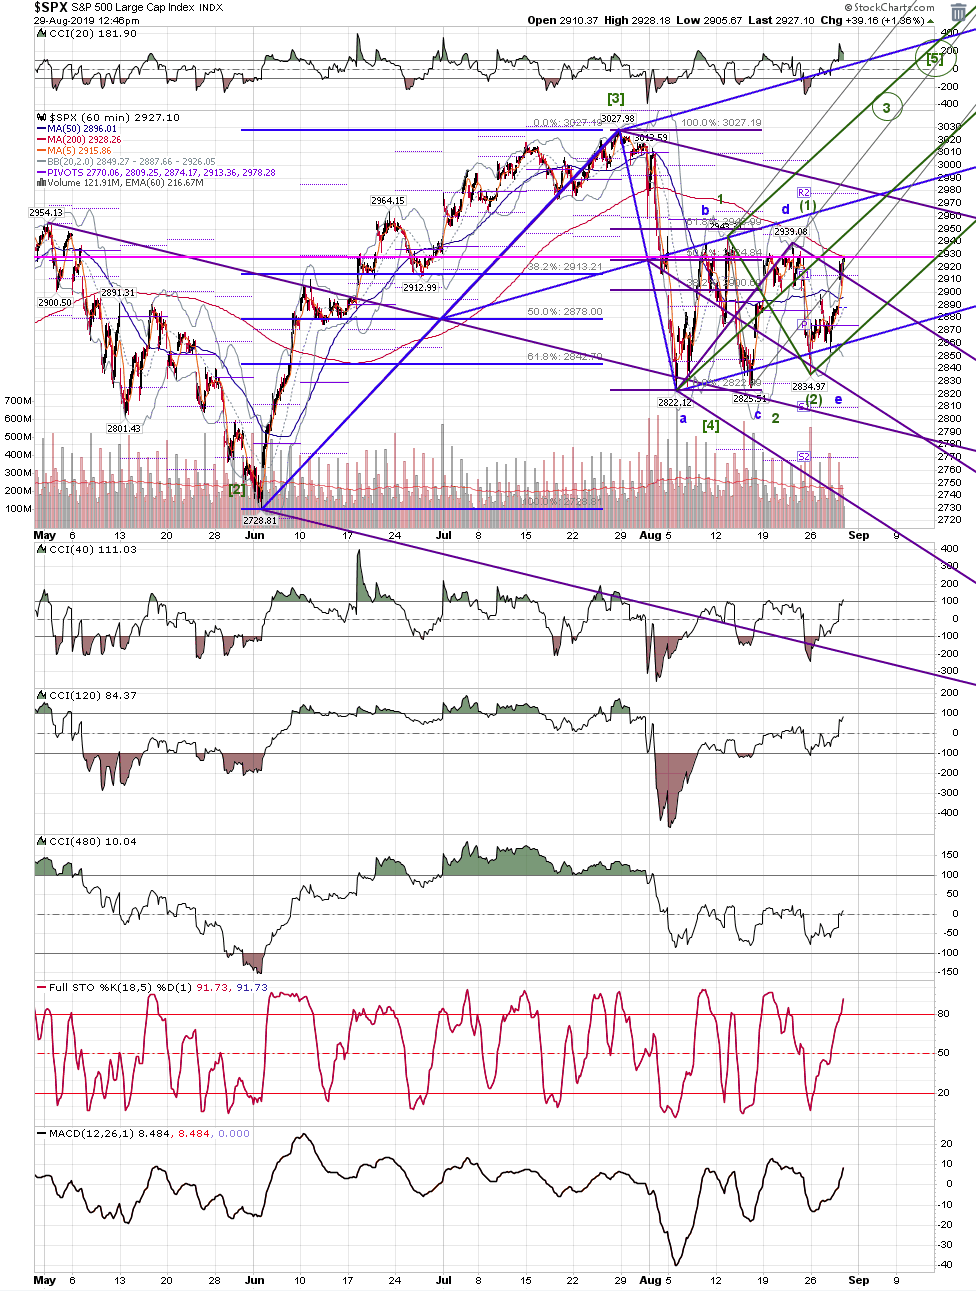
spx 2007 - 2008 ancient history charts - worth looking at since we had an abc up move into the .618 area last wee at 2939, and it's difficult to discern which way spx wants to go
Click image for original size
Click image for original size
RA
rat89
Rep: 0
Posts: 7,015
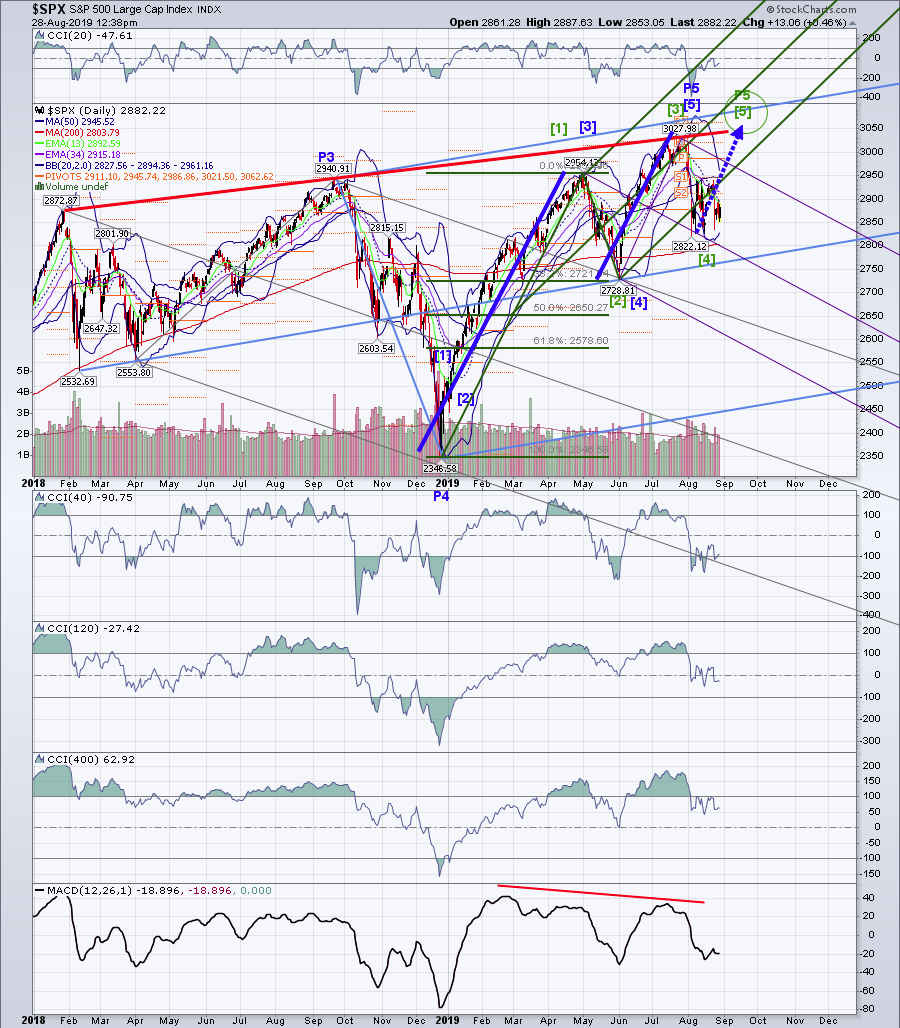
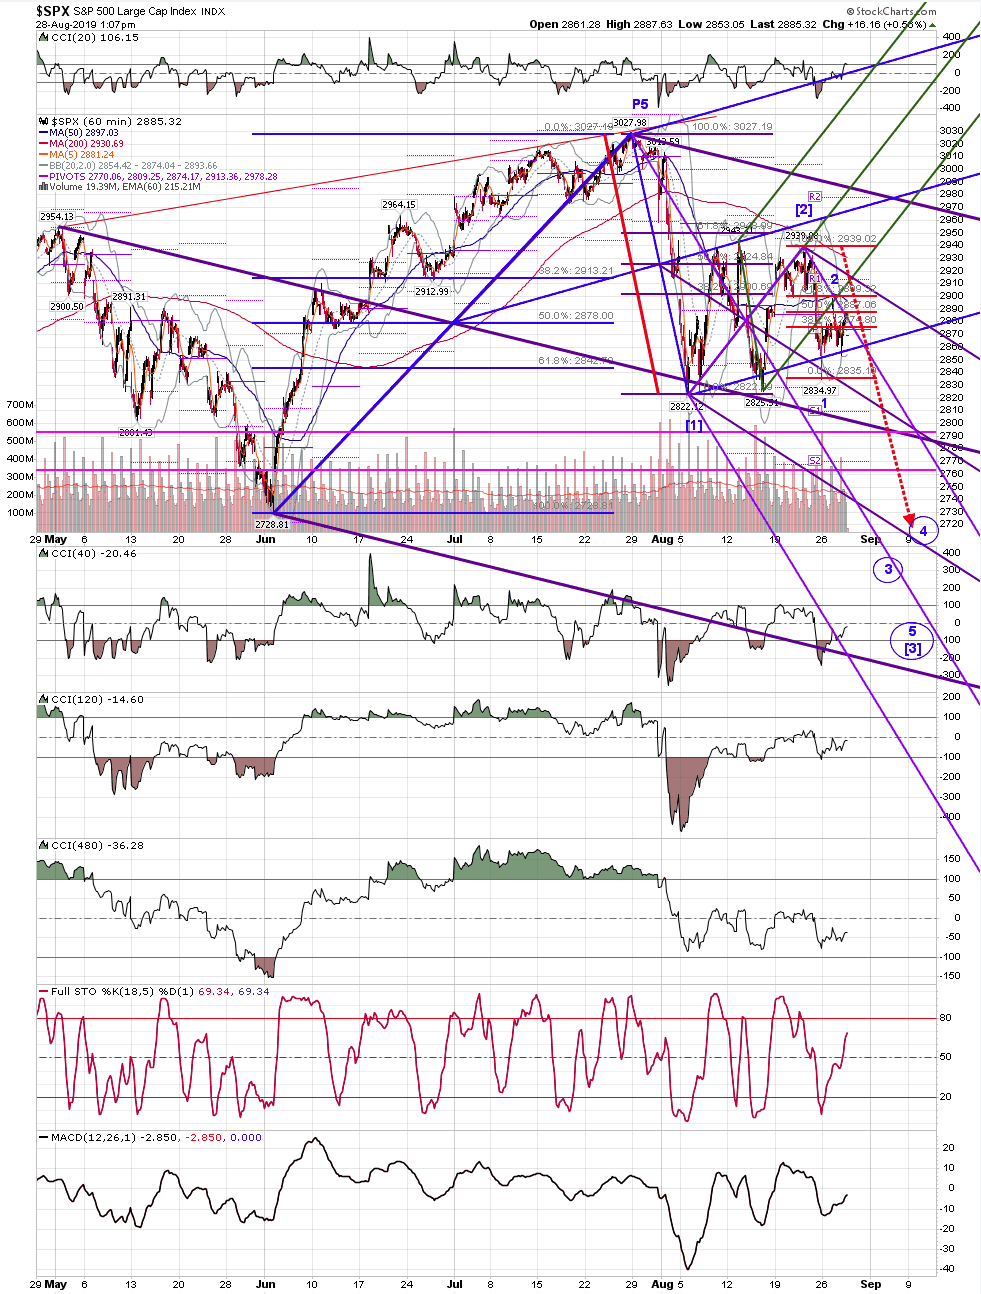
spx has a green count and a blue count: the green count says one more high around 3050, while the blue count says the high is in at 3028
60 minute showing the potential blue count move....note that the green count would send it up from here:
Click image for original size
Click image for original size
60 minute showing the potential blue count move....note that the green count would send it up from here:
Click image for original size
AL
albert
Rep: 99
Posts: 3,094
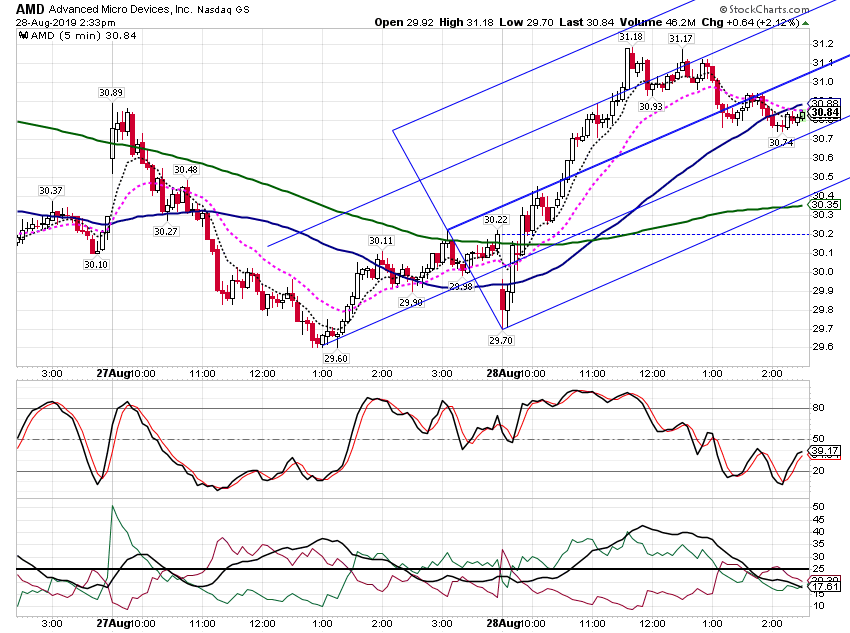
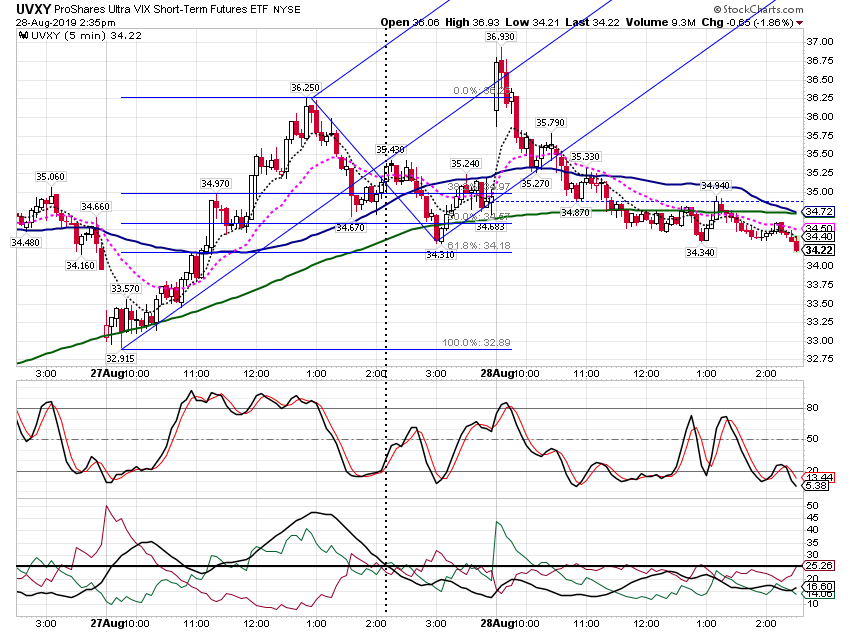
Paper trading. Made a bit on an AMD CALL. Lost some om a UVXY call.
Al
Al
Click image for original size
Click image for original size
RA
rat89
Rep: 0
Posts: 7,015
showed spx 60 blue count yesterday - here's the green count, either a minor 1-2, (1)-(2) or a wave [4] triangle, abcde......the green count for a move up into the 3050 area for a perfect ending diagonal into the end of the third week in september, around oe, would be very elegant
Click image for original size
DU
Duane
Rep: 100
Posts: 1,095
Excellent work Thank you.
Originally posted by rat89
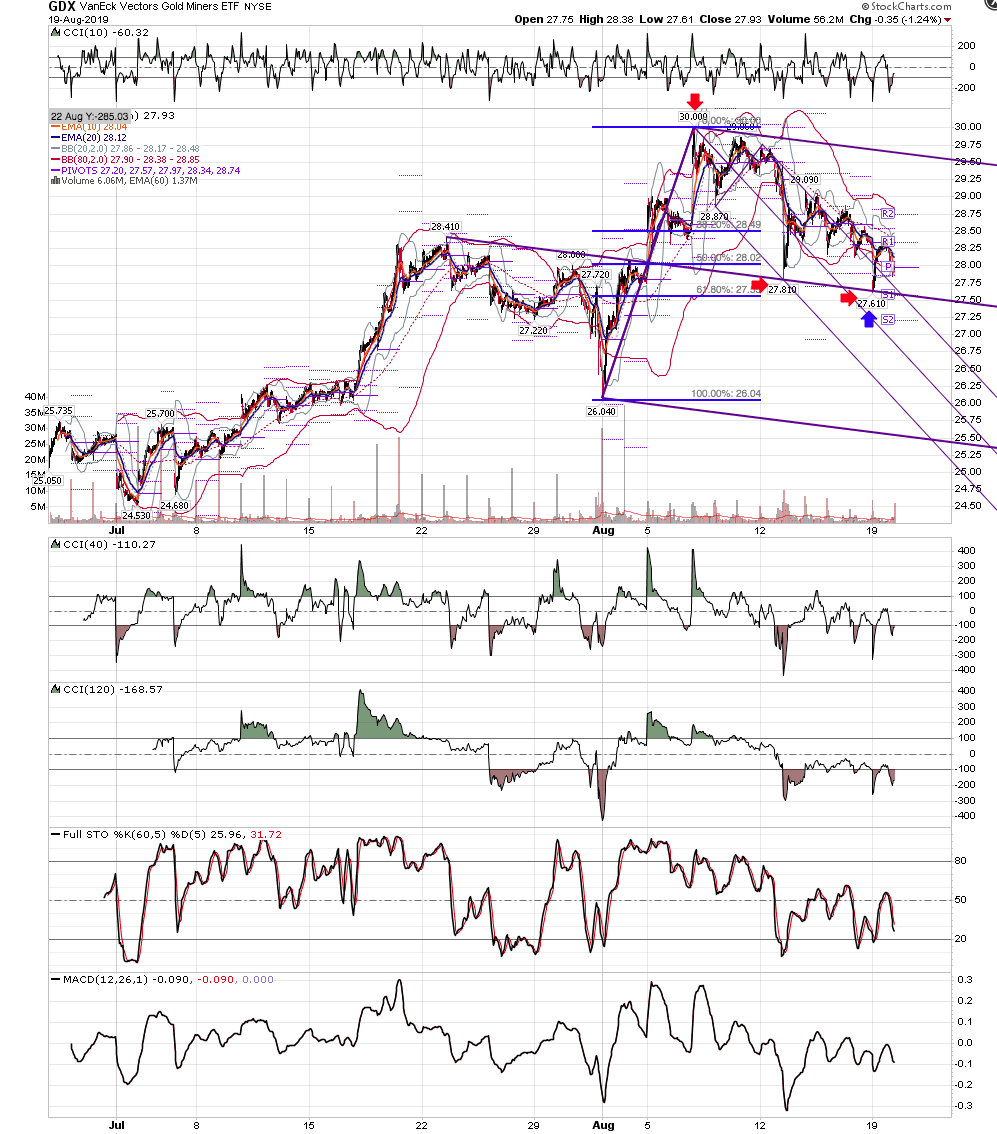
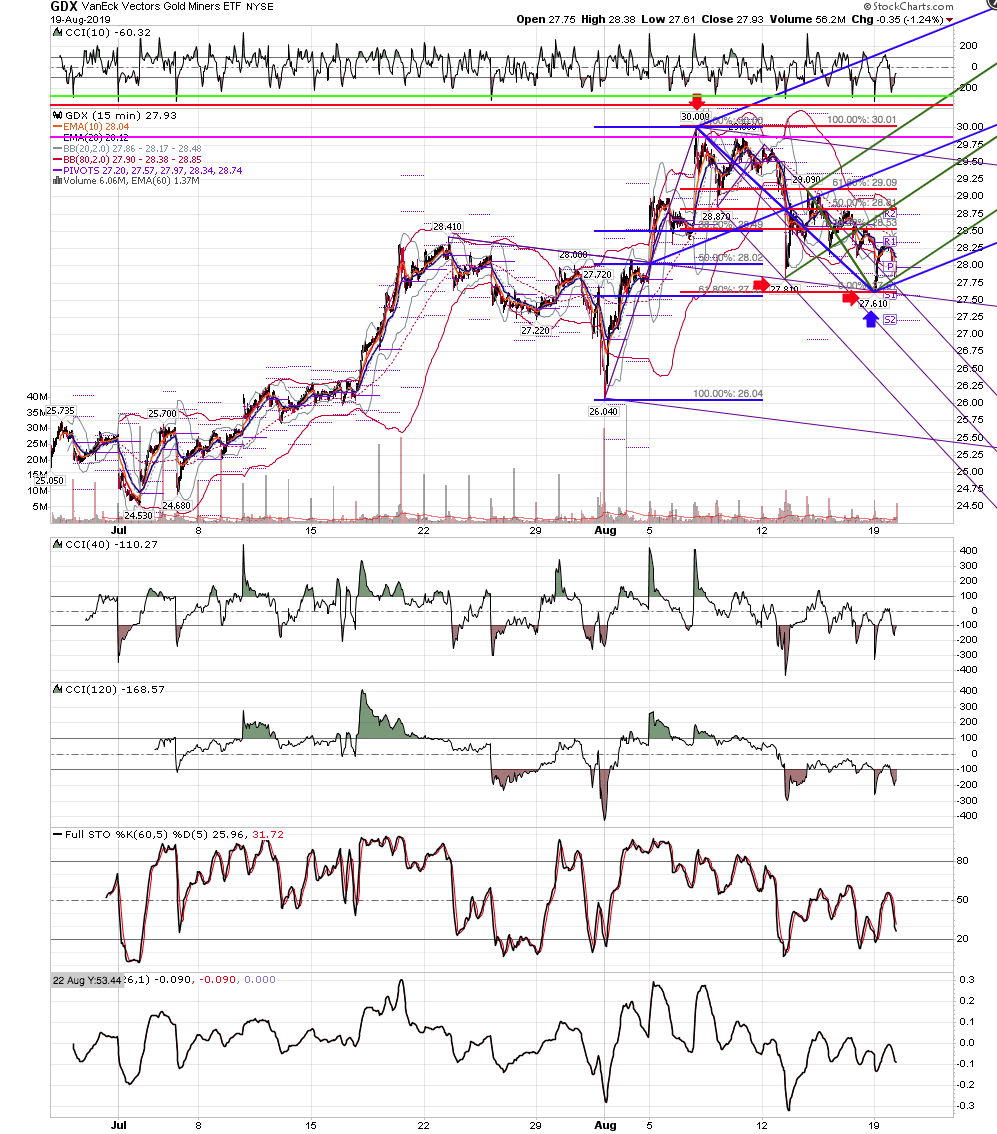
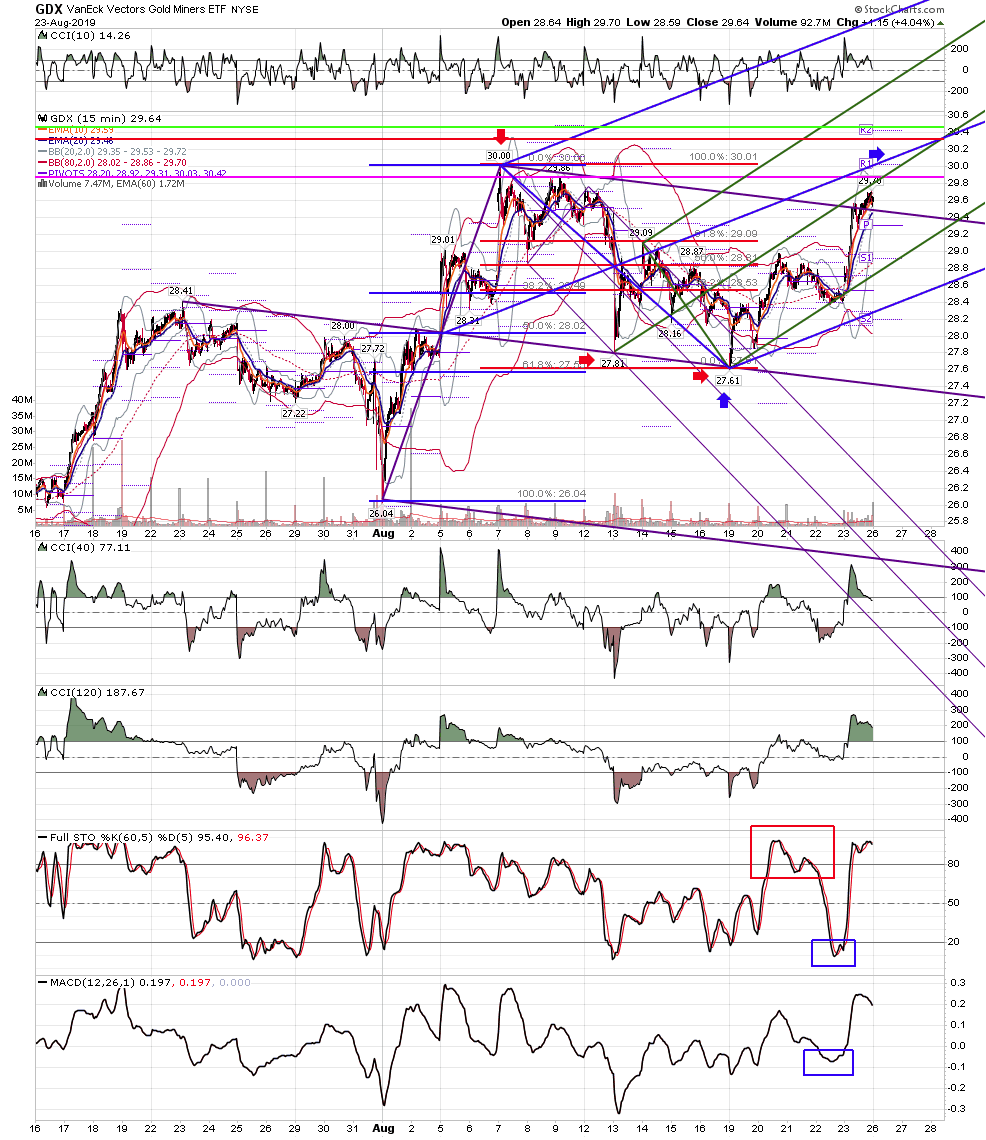
gdx 15 - using median line sets as a predictive tool....the move down starts at the upper anchor point of the swing high, and targets the median line, tags it once, then twice, hitting the minimum trade target. At this point, price can either coil, accelerate, or reverse, and we can look to the cyclical indicators and the larger time frames for clues. Adding a bullish median line set and calculating the key fib areas around the prior high, of both internal and external retracements, give clues as to where a move up might target. Once the median line of the purple set has been hit, the upper line of the purple set fails to have a predictive use in my tools, as it no longer counts as a retest area given the fact that price went all the way to the median line target. That doesn't mean price couldn't happen to stop there, but over hundreds of samples, I can say that this isn't a high probability trade - from the median line back up to the upper line. Only if the median line were NOT hit. The lower line would still be in play though.
Click image for original size
Click image for original size
Click image for original size
AL
albert
Rep: 99
Posts: 3,094
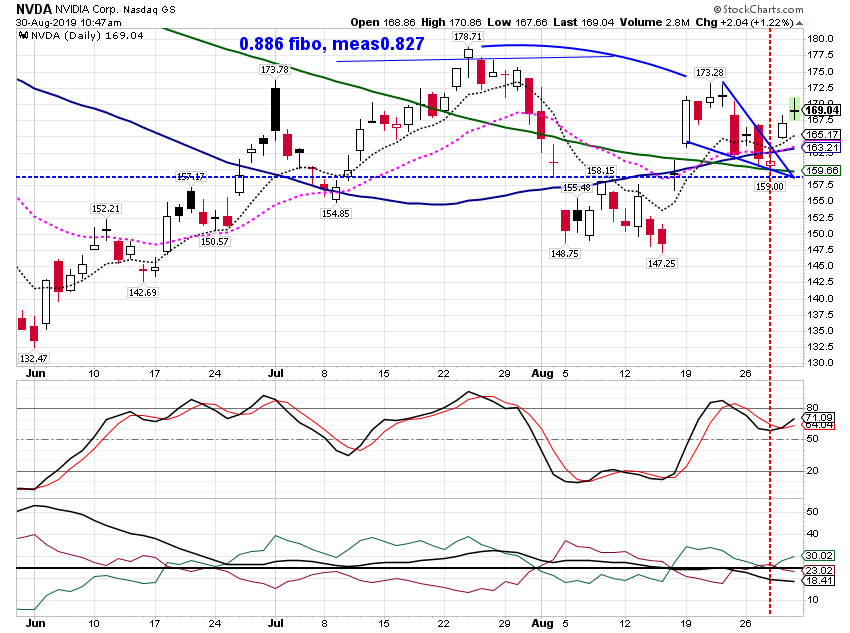
Paper trading. Made some yesterday on NVDA calls, and lost some today on NVDA calls. I do not know for sure, but I think that NVDA is NOT in a Jerry's Dragon pattern. I think the dragon tail is too high.
Al :--)
Al :--)
Click image for original size
AL
albert
Rep: 99
Posts: 3,094
Duane,
Good to hear from you.
Al :--)
Good to hear from you.
Al :--)
Originally posted by Duane
Excellent work Thank you.
Originally posted by rat89
gdx 15 - using median line sets as a predictive tool....the move down starts at the upper anchor point of the swing high, and targets the median line, tags it once, then twice, hitting the minimum trade target. At this point, price can either coil, accelerate, or reverse, and we can look to the cyclical indicators and the larger time frames for clues. Adding a bullish median line set and calculating the key fib areas around the prior high, of both internal and external retracements, give clues as to where a move up might target. Once the median line of the purple set has been hit, the upper line of the purple set fails to have a predictive use in my tools, as it no longer counts as a retest area given the fact that price went all the way to the median line target. That doesn't mean price couldn't happen to stop there, but over hundreds of samples, I can say that this isn't a high probability trade - from the median line back up to the upper line. Only if the median line were NOT hit. The lower line would still be in play though.
Click image for original size
Click image for original size
Click image for original size