Starting it off.
Al
AL
albert
Rep: 99
Posts: 3,094
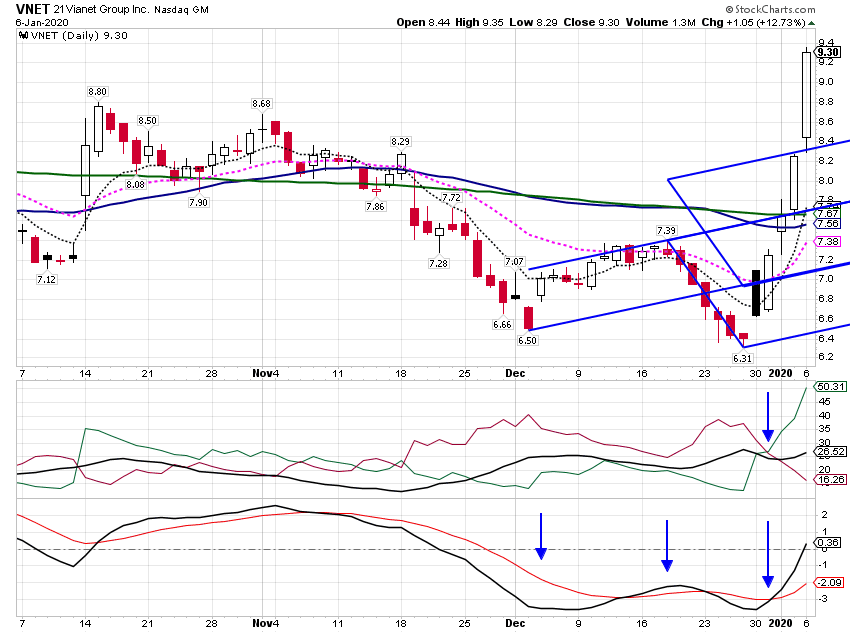
Paper trading. Made some on a VNET long call. Broke even, had to pay commissions, on NS long call.
Al :--)
Al :--)
Click image for original size
Click image for original size
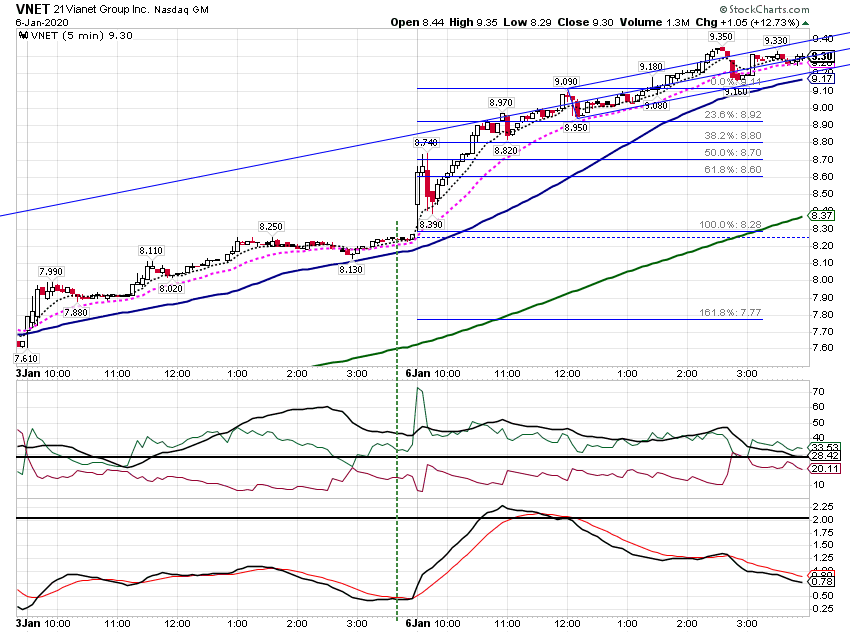
Click image for original size
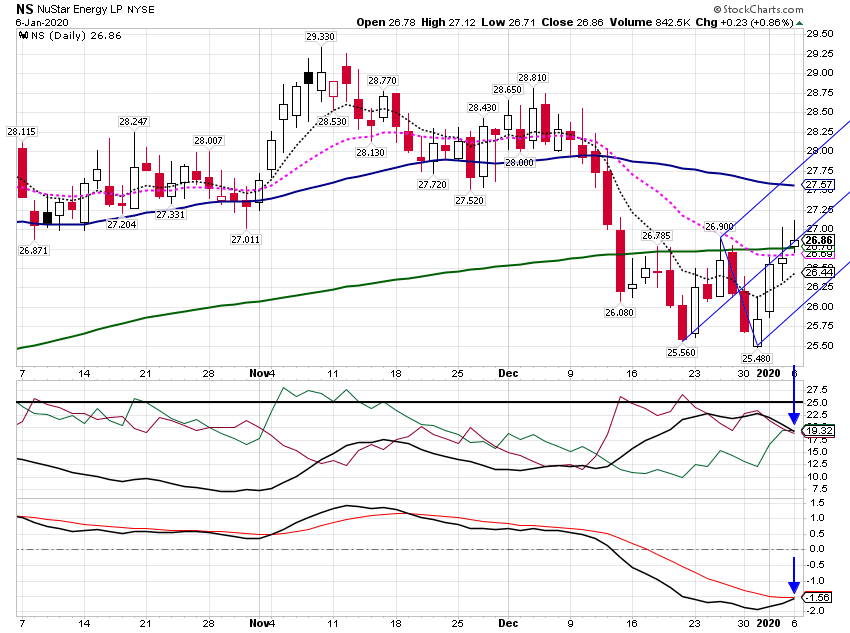
Click image for original size
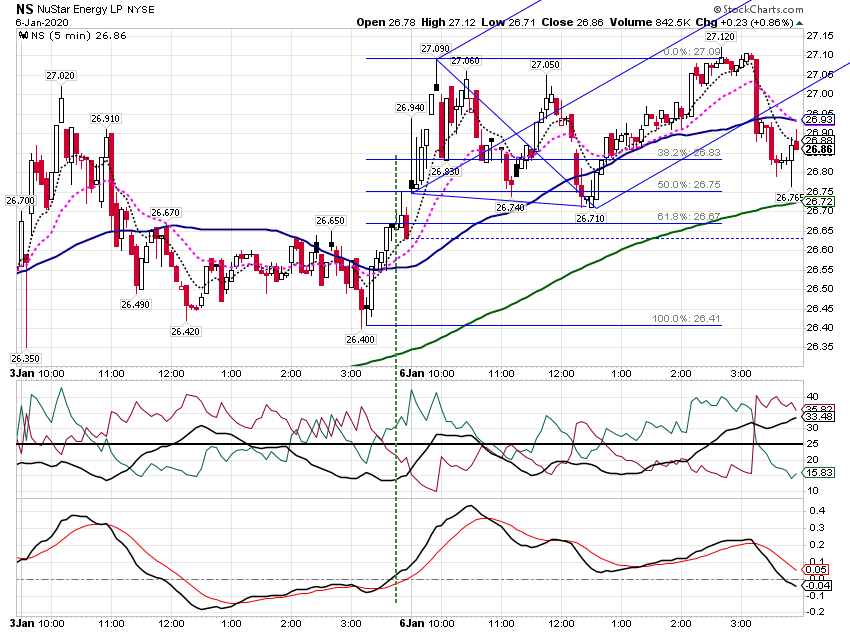
AL
albert
Rep: 99
Posts: 3,094
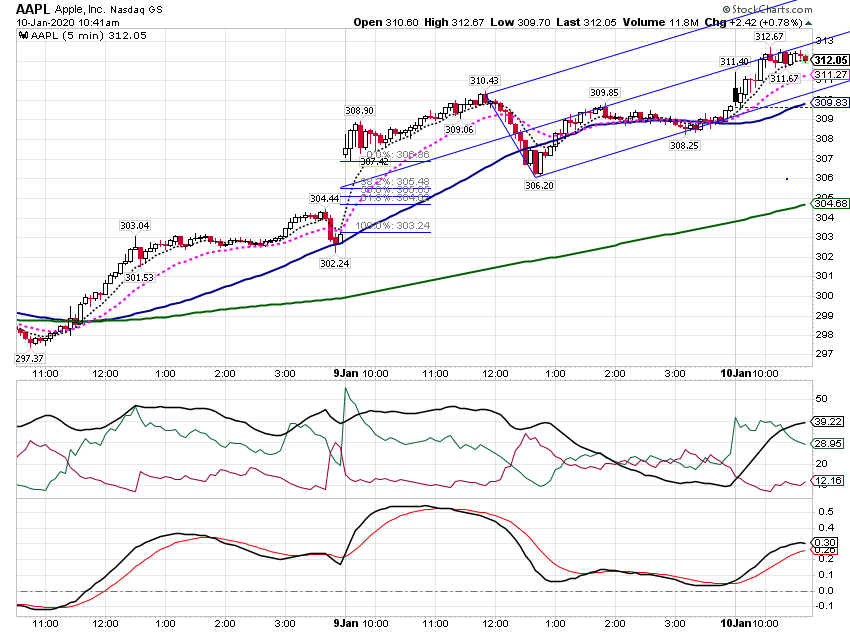
Paper trading. Made some on a quick AAPL trade by selling a weekly call option and buying it back at a lower price.
Al :--))
Al :--))
Click image for original size
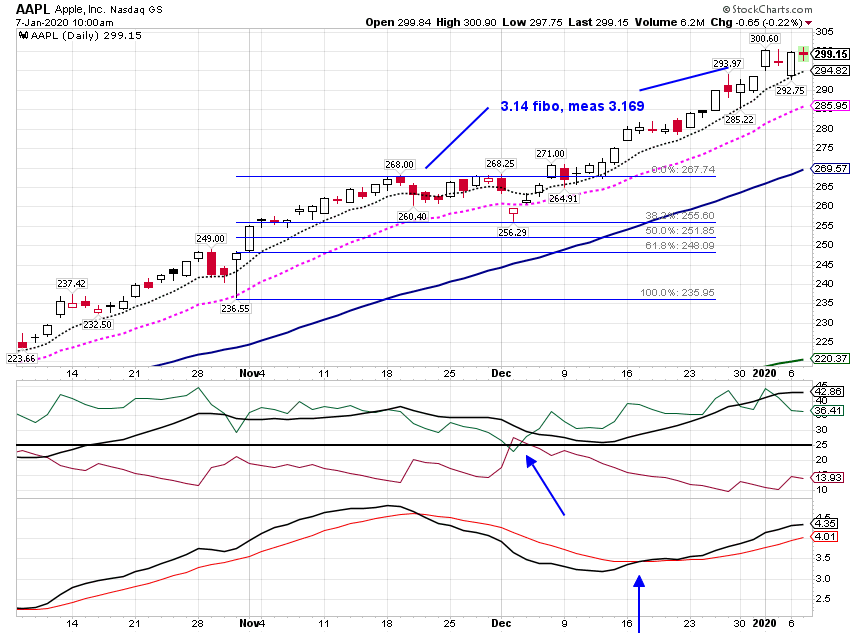
Click image for original size
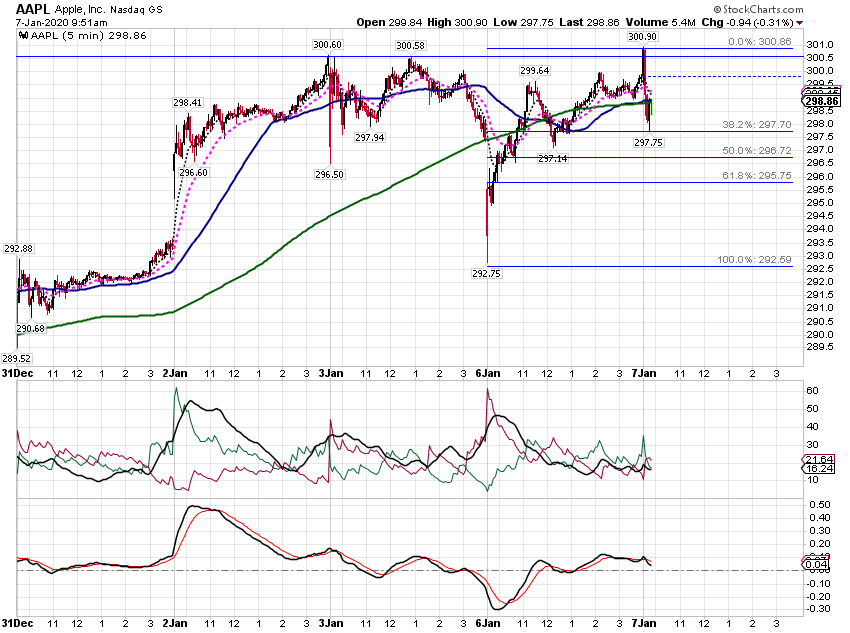
Click image for original size
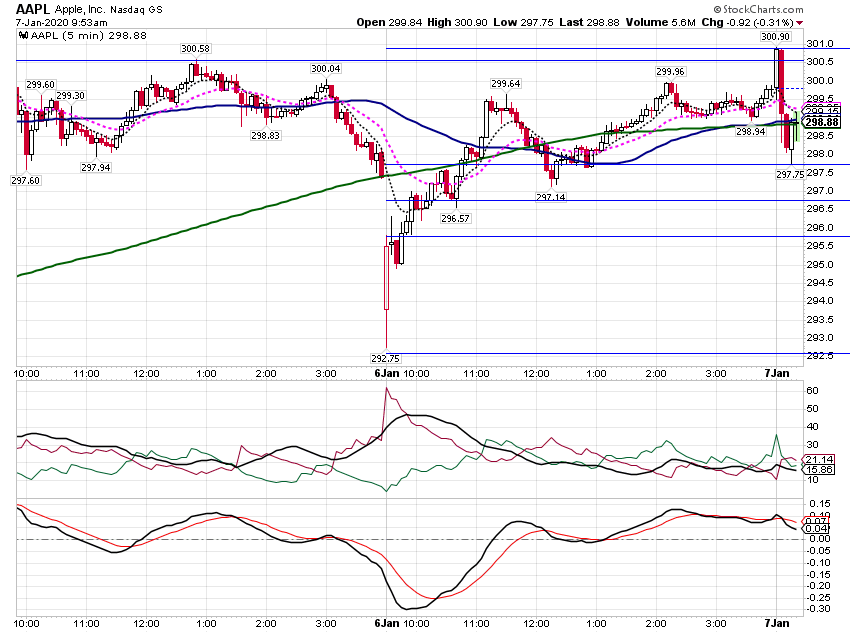
Click image for original size
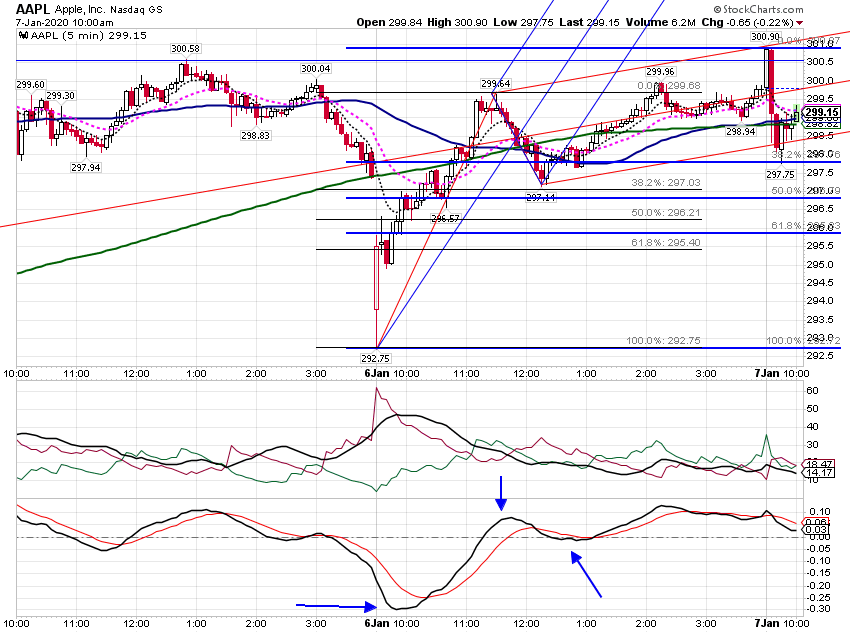
RA
rat89
Rep: 0
Posts: 7,015
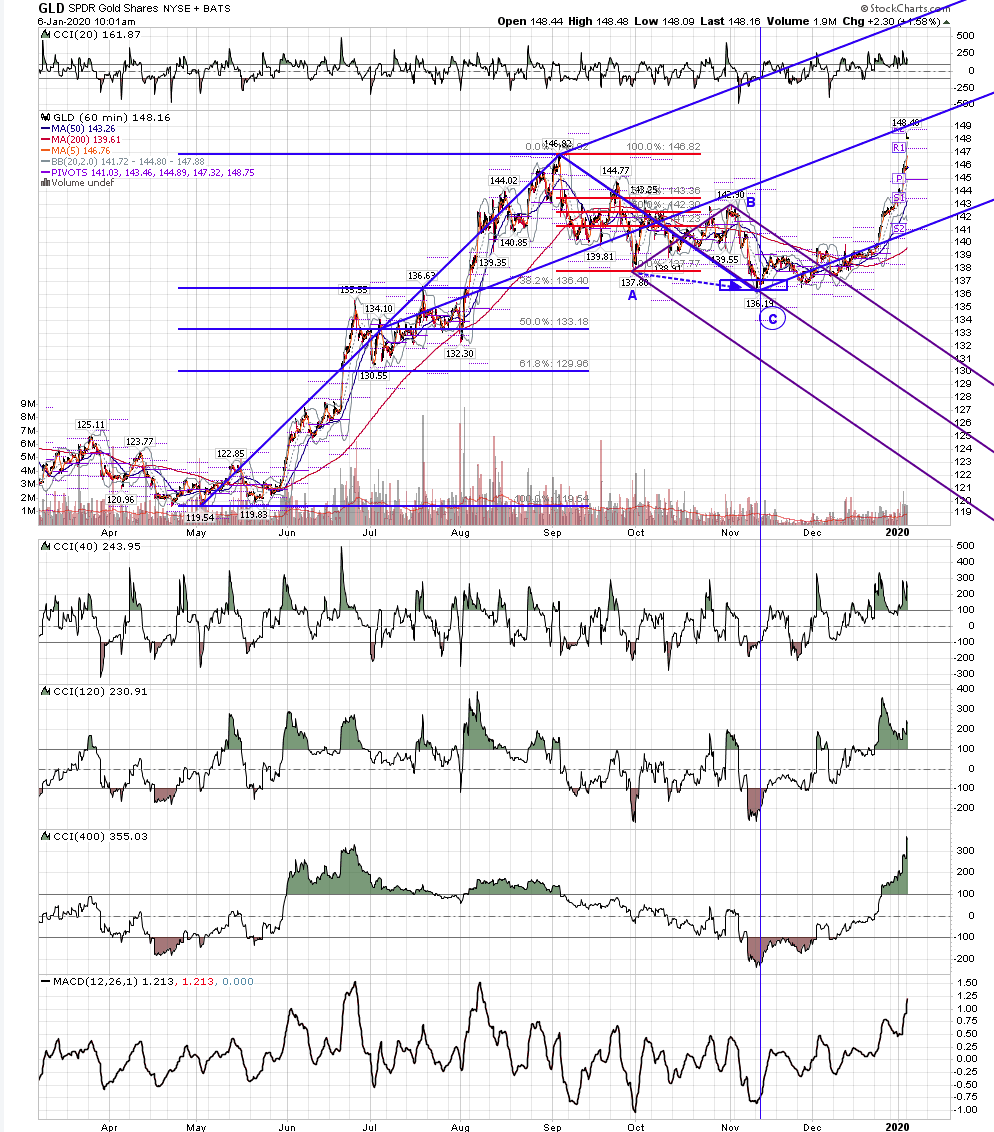
Mine too....not sure how it gets there, but targets from 153 - 167
Originally posted by albert
rat,
Good work. More up, maybe? My two cents.
Al
RA
rat89
Rep: 0
Posts: 7,015
spx has an alternate count that has the 5 wave target area around 3300 spx only the end of wave Major [3], rather than the end of Major [5]. Based on what I am seeing, and the fact that certain indicators are so high, I am leaning to that as the count we should be watching. With all the bad "news" we see buying on shallow dips. We don't see any true negative divergence yet. These are clues that the end of the move into P5 needs more time and a wave Major [4] down to set all that up.
Click image for original size
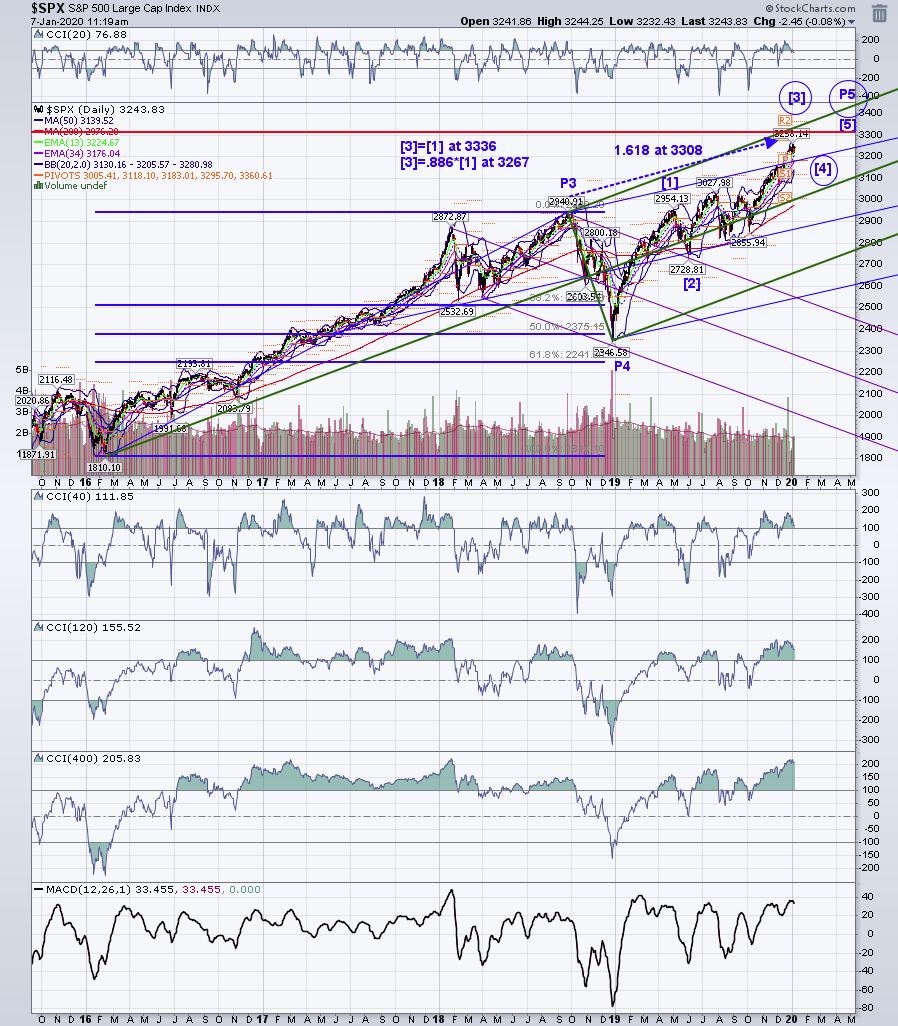
RA
rat89
Rep: 0
Posts: 7,015
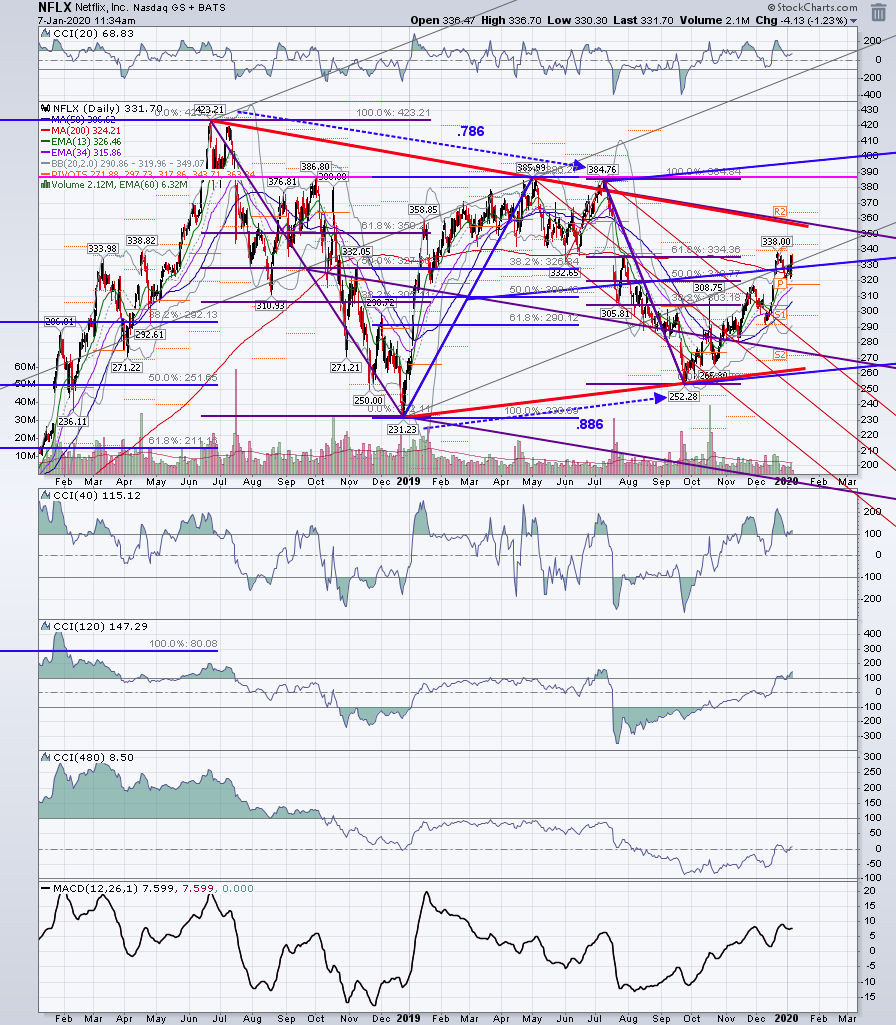
nflx daily – has the move up from 252 ended here in the .618 area just above the median line of the blue modified schiff set? Maybe. I find myself asking the question, if spx is only completing Major [3] here, and it takes another few months for it to trace out [4] and then [5], what laggards might surprise us? nflx is a prior leader that has disappointed during this move. If it woke up, I could see it finding a way to get to the 401 area at the upper blue line, where the inverse fibs lie, where:
384.76 – 252.28 = 1.128 at 401.72
423.21 – 231.23 = .886 at 401.32
384.76 – 252.28 = 1.128 at 401.72
423.21 – 231.23 = .886 at 401.32
Click image for original size
MA
MarcinO
Rep: 67
Posts: 5,506
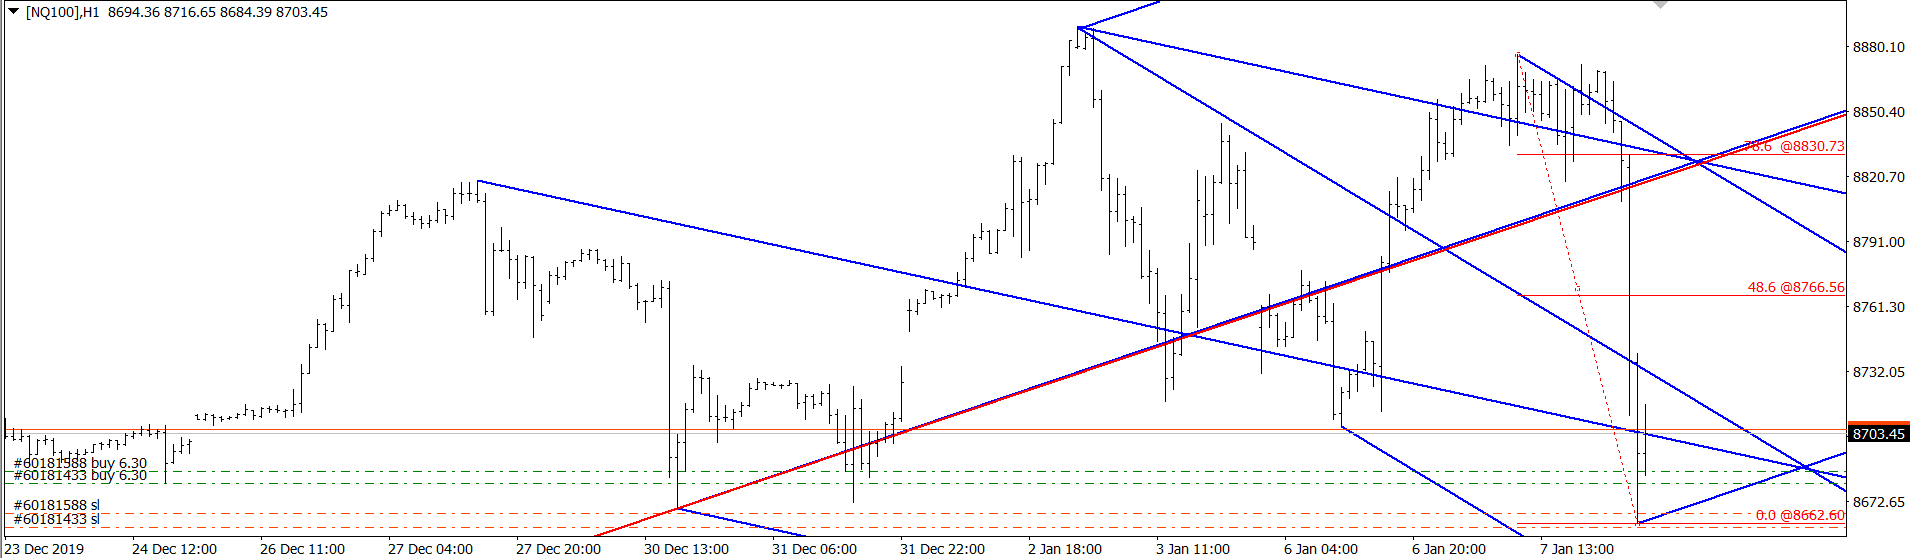
So, the news about Iranian attack on American base in Iraq comes just after RTH close, with one hour for Nasdaq to reflect it, yet nothing happens. All of the sudden they drop it just below December the 31st low on thin market, after 6 PM EST. Most likely it will come back again to 8830 level, before another solid leg down, not before tomorrow open - they need solid volume to close another part of long positions in stock market. To me it all looks like a clasic closing of large long positions before letting the market to fall. Just my opinion.
Click image for original size