Starting it off.
Al
AL
albert
Rep: 99
Posts: 3,094
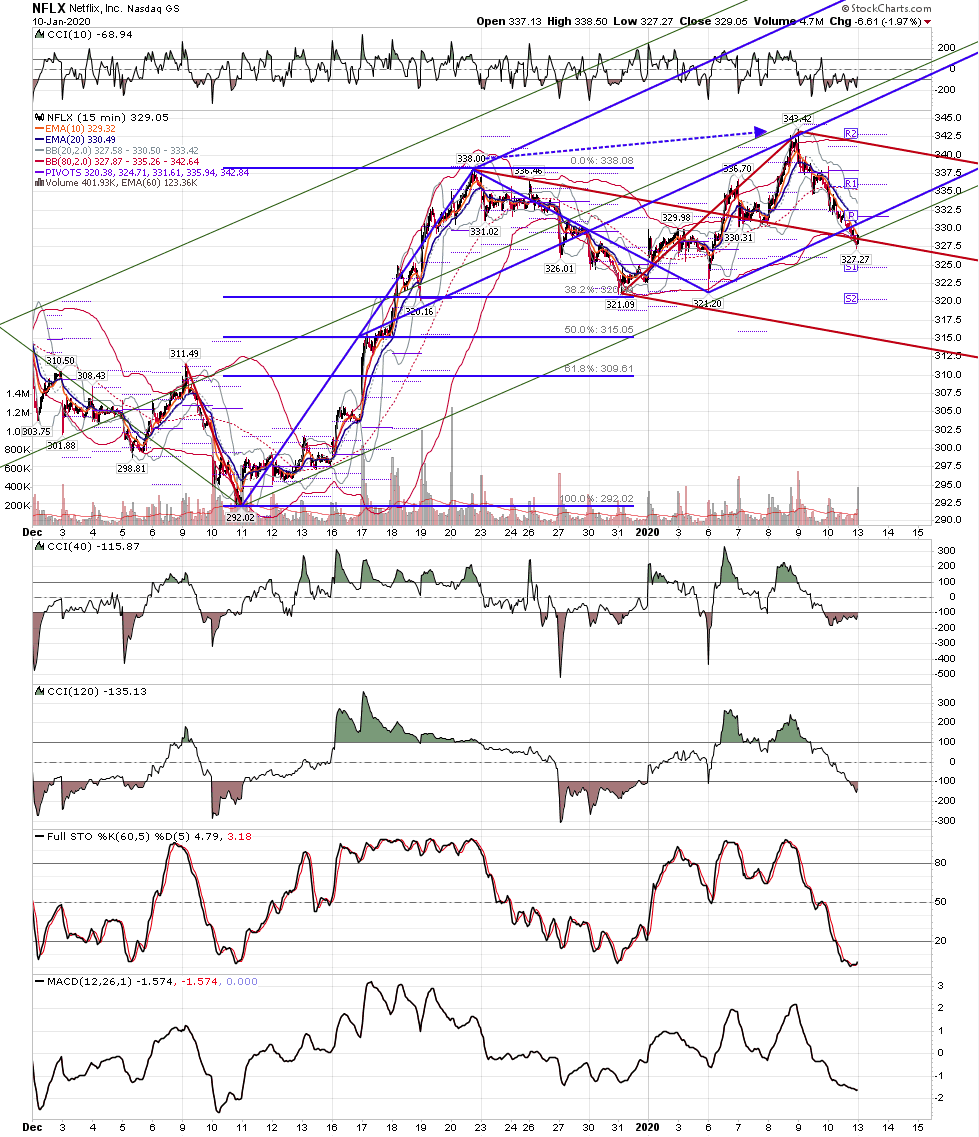
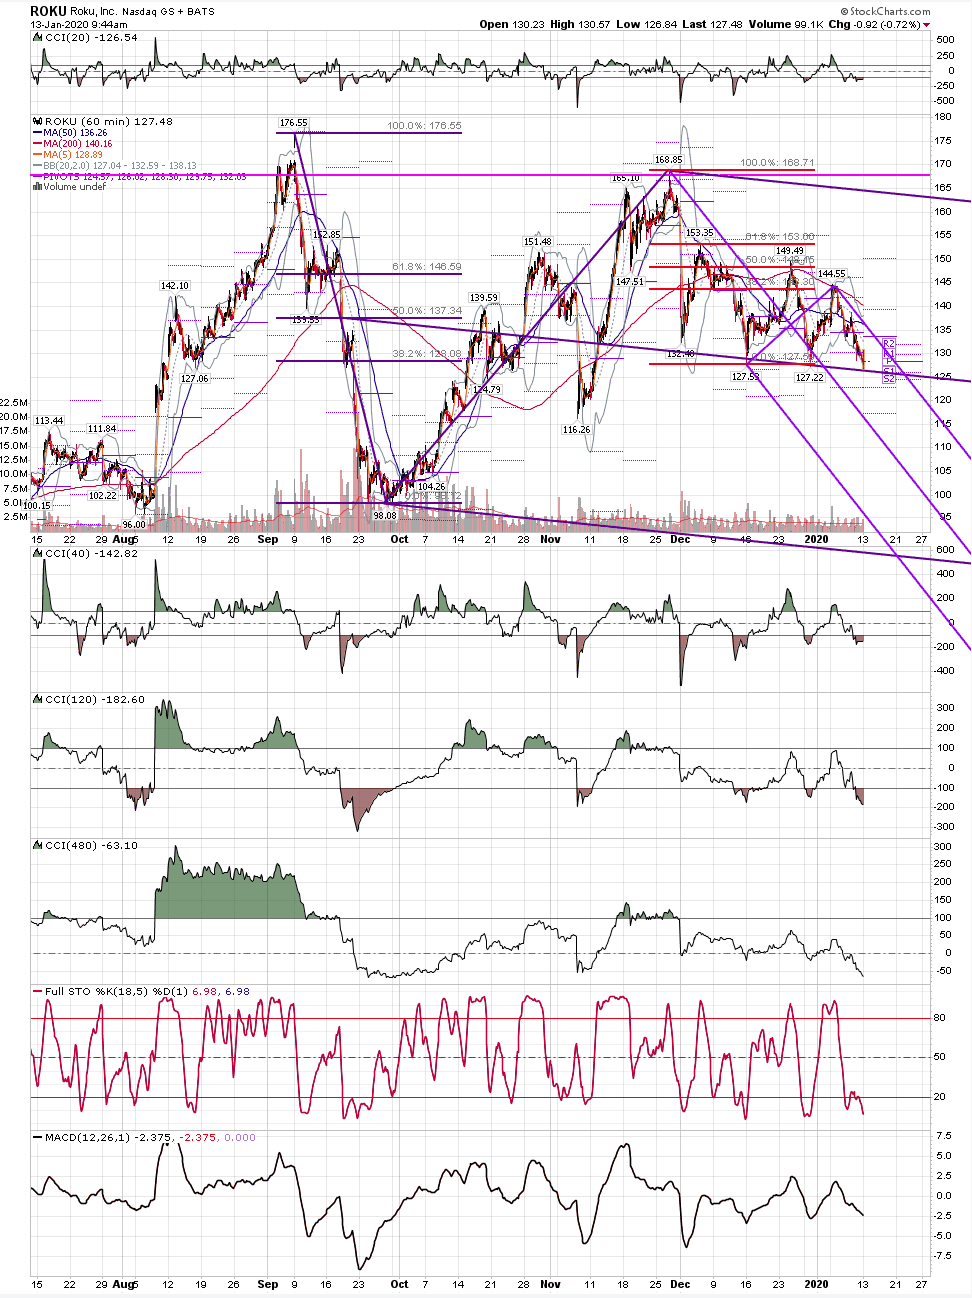
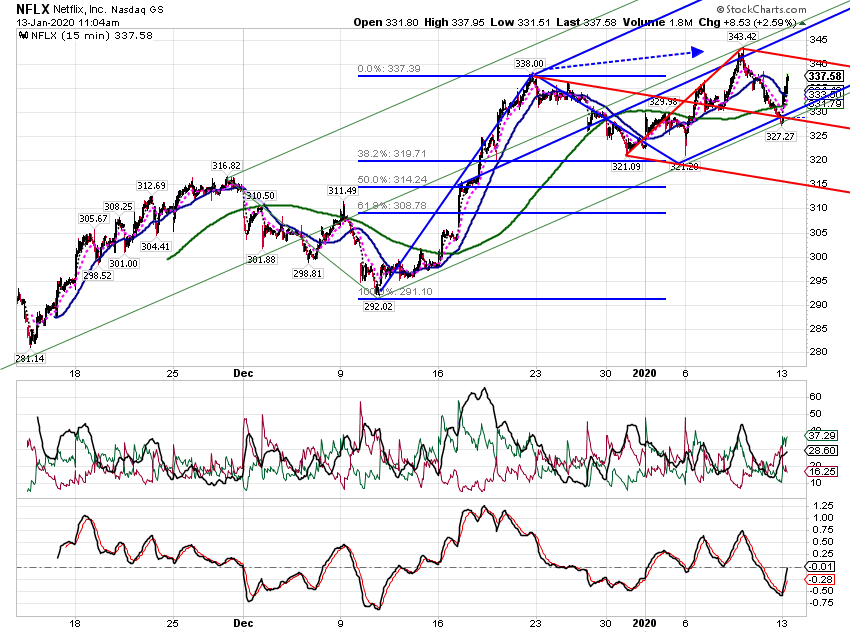
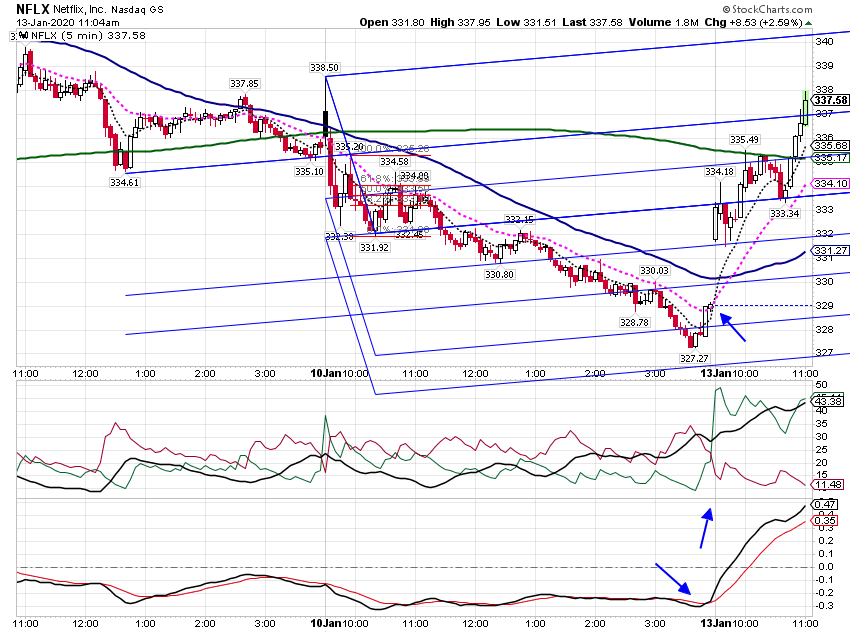
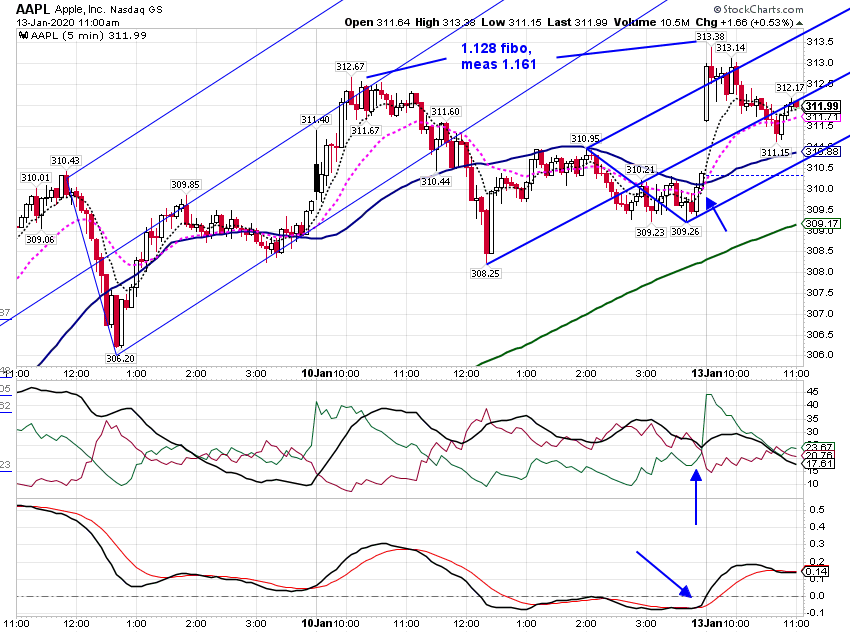
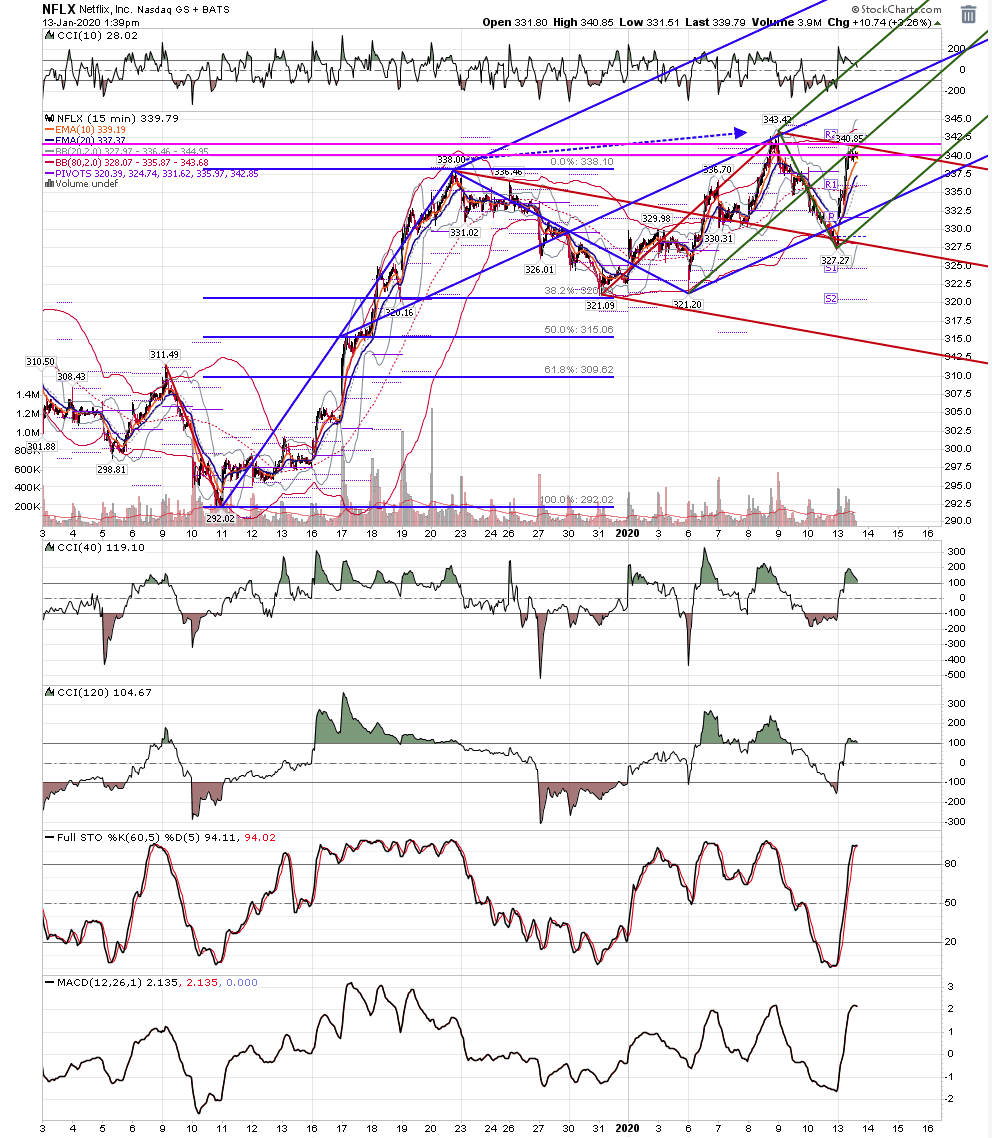
Paper trading. Made some on NFLX long weekly calls. Thanks rat, for your wonderful chart work. Lost some on AAPL long weekly calls, but overall today, I made more than I lost, Something unusual happened in my AAPL exit. I entered a market SELL order to get out of a losing AAPL trade, and the order did not execute for about thirty minutes. Thats a new one on me.
Al :--)
Al :--)
Click image for original size
Click image for original size
Click image for original size
AL
albert
Rep: 99
Posts: 3,094
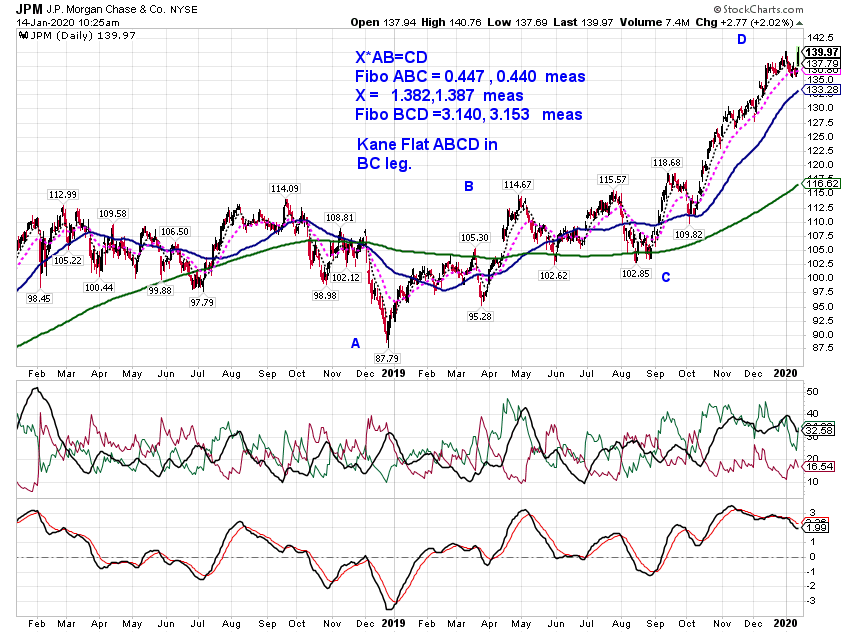
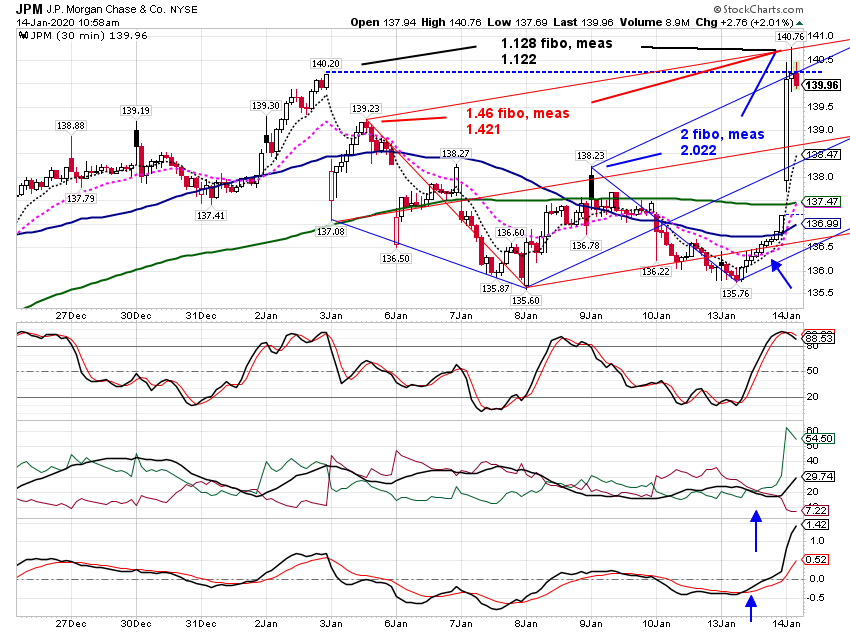
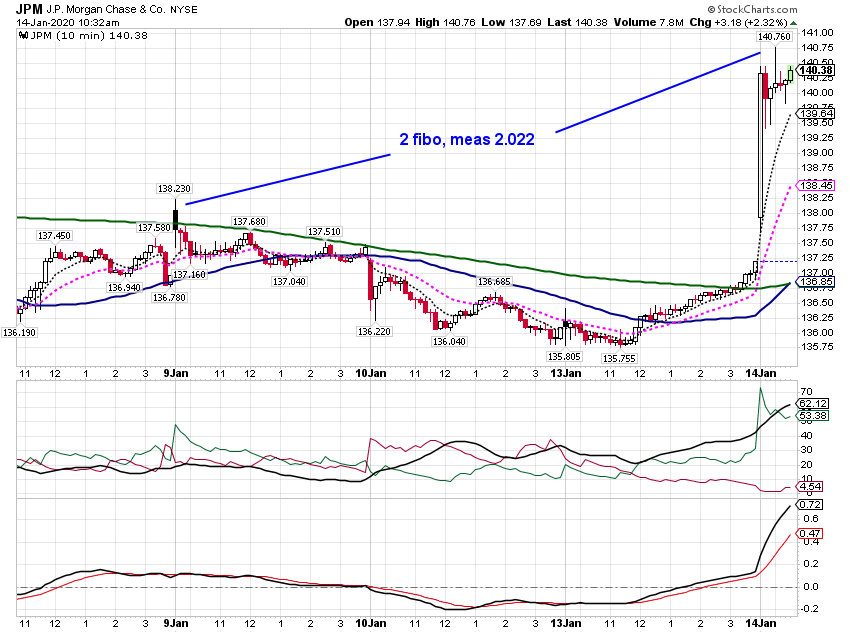
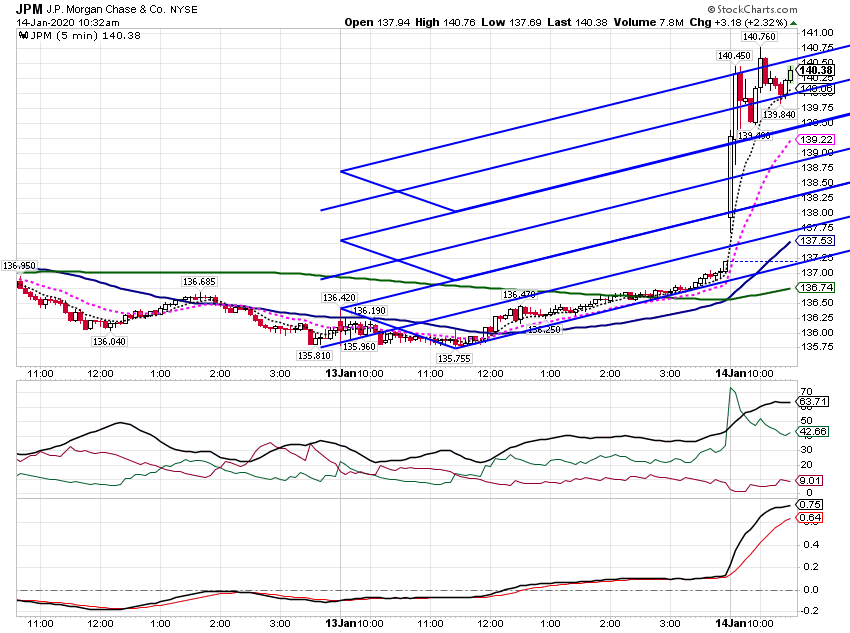
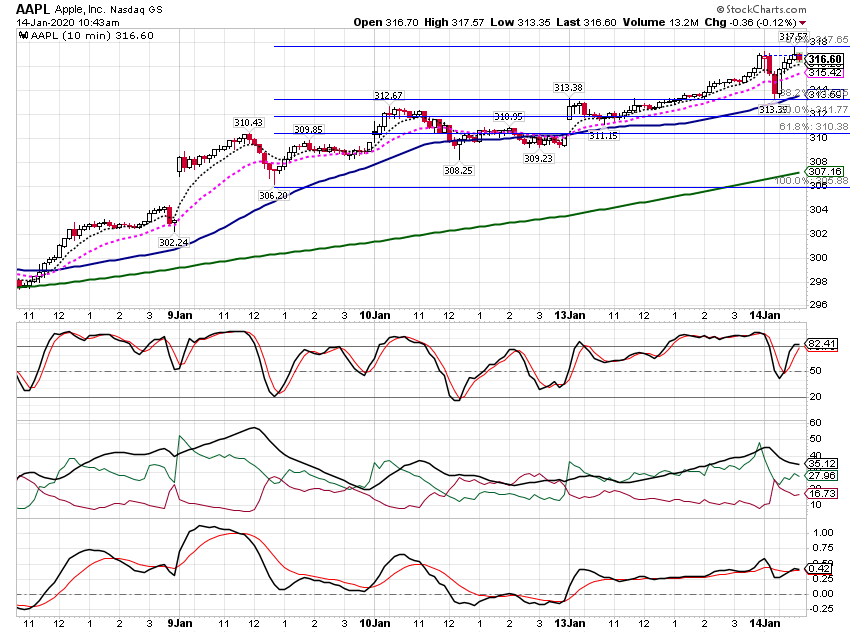
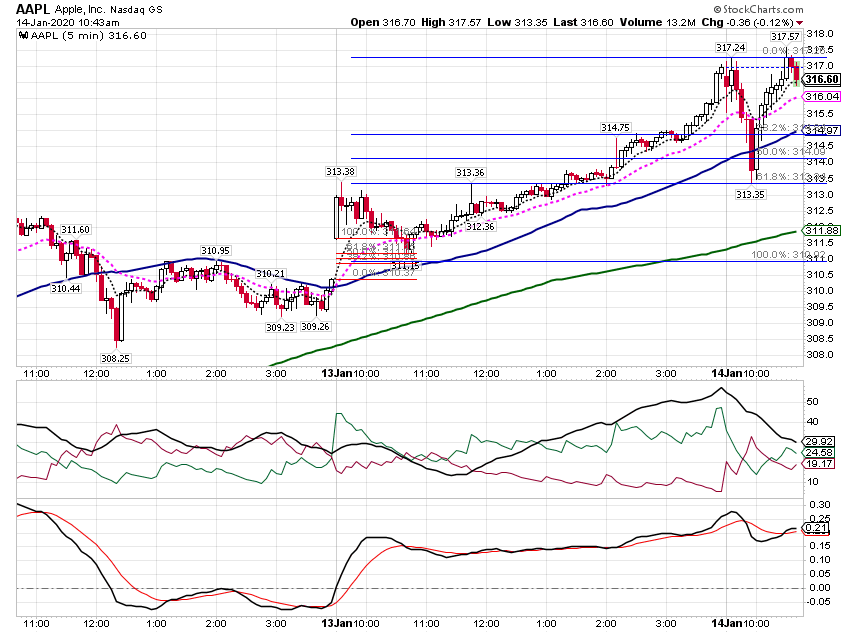
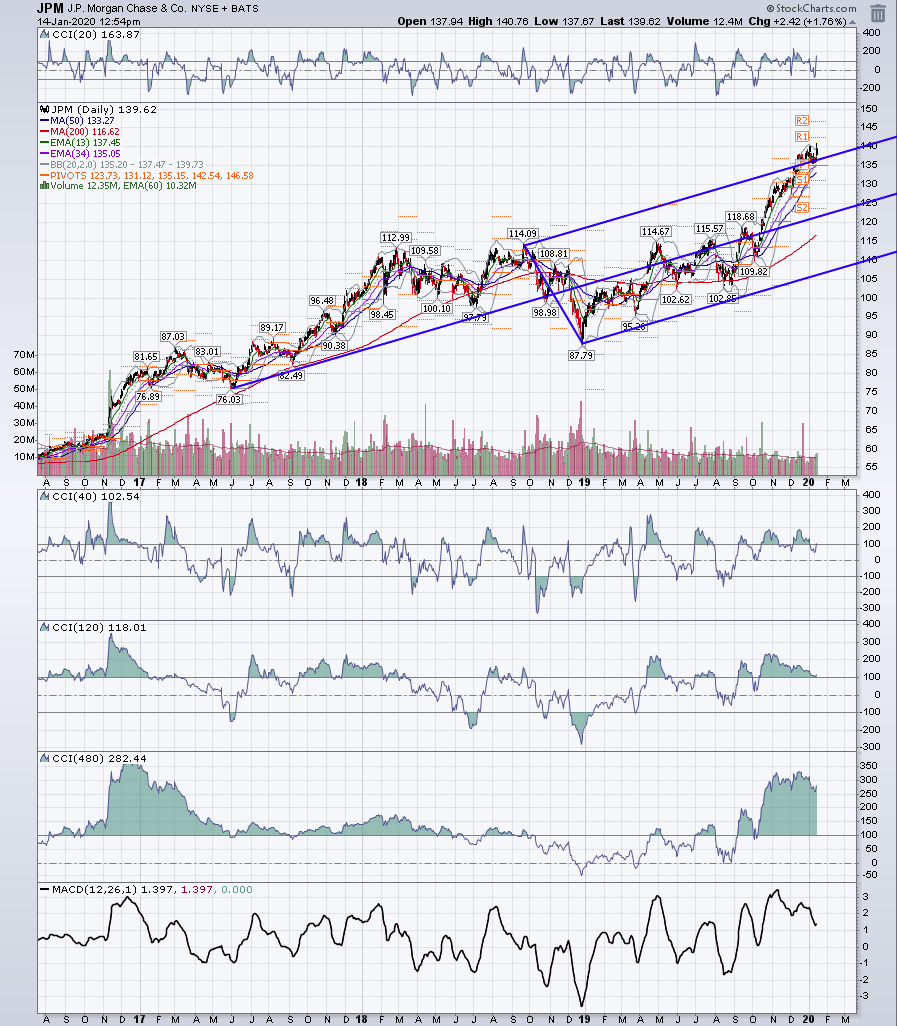
Paper trading. Made some on JPM long calls. JPM had a longer term X*AB=CD with a Kane Flat ABCD in the BC leg. I added a couple of AAPL charts, which I did not trade, to show a 0.382 fibo and a 0.618 fibo overlap at a price reversal.
Al :--)))
And AAPL:
Al :--)))
Click image for original size
Click image for original size
Click image for original size
Click image for original size
And AAPL:
Click image for original size
Click image for original size
AL
albert
Rep: 99
Posts: 3,094
rat,
Nice! Good one!
Al :--))
Nice! Good one!
Al :--))
Originally posted by rat89
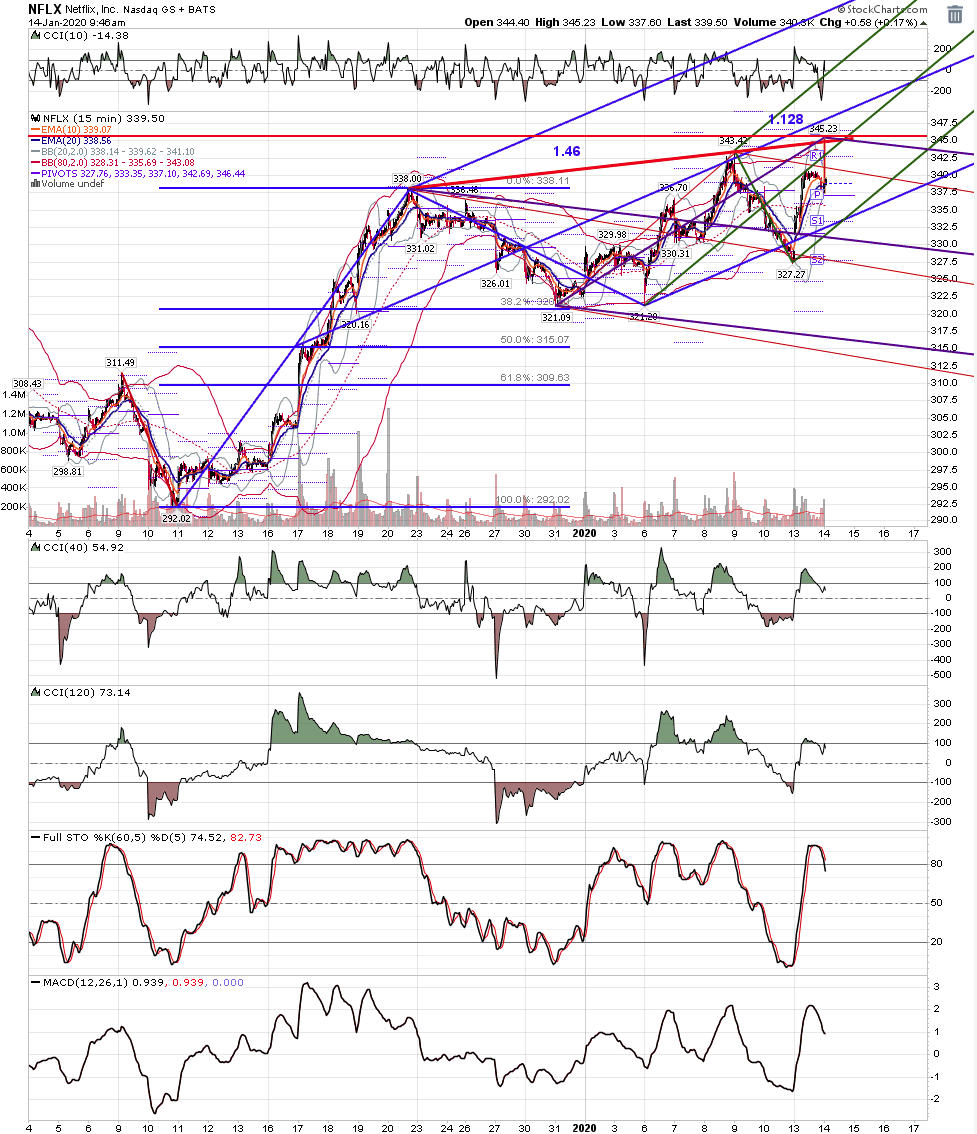
nflx 15 - nice gap open pop to 1.128
Click image for original size
RA
rat89
Rep: 0
Posts: 7,015
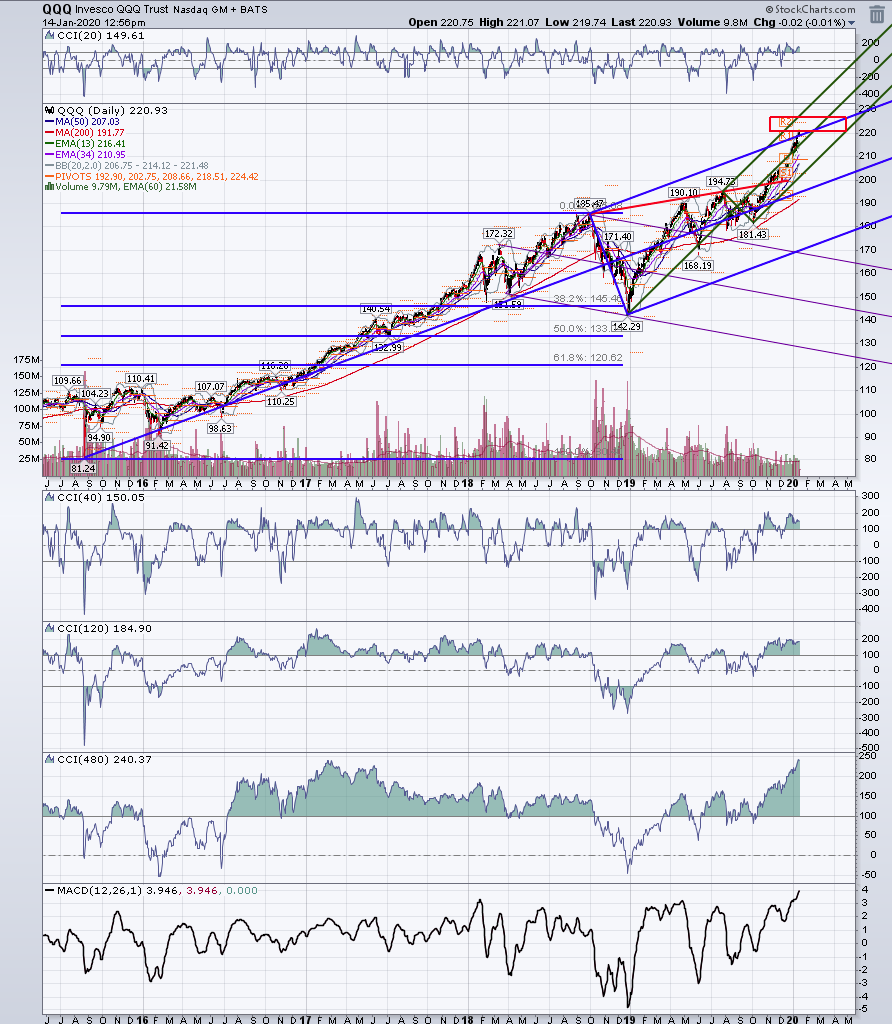
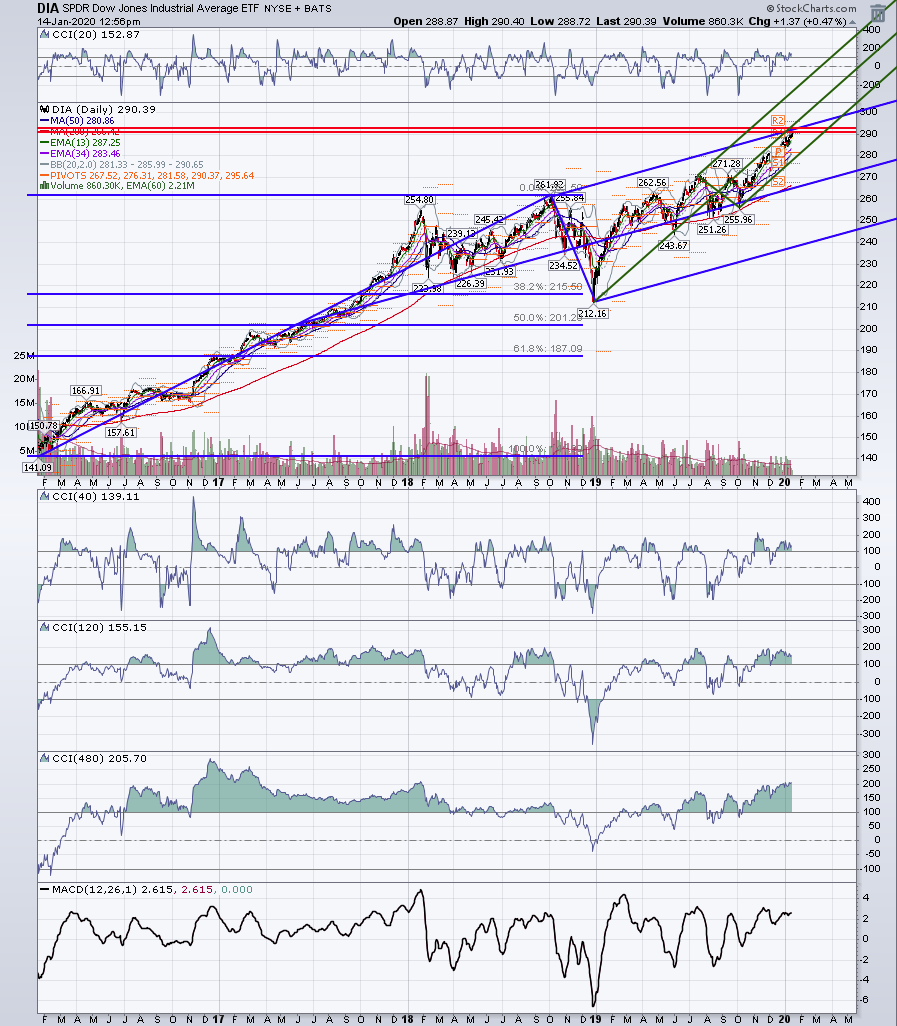
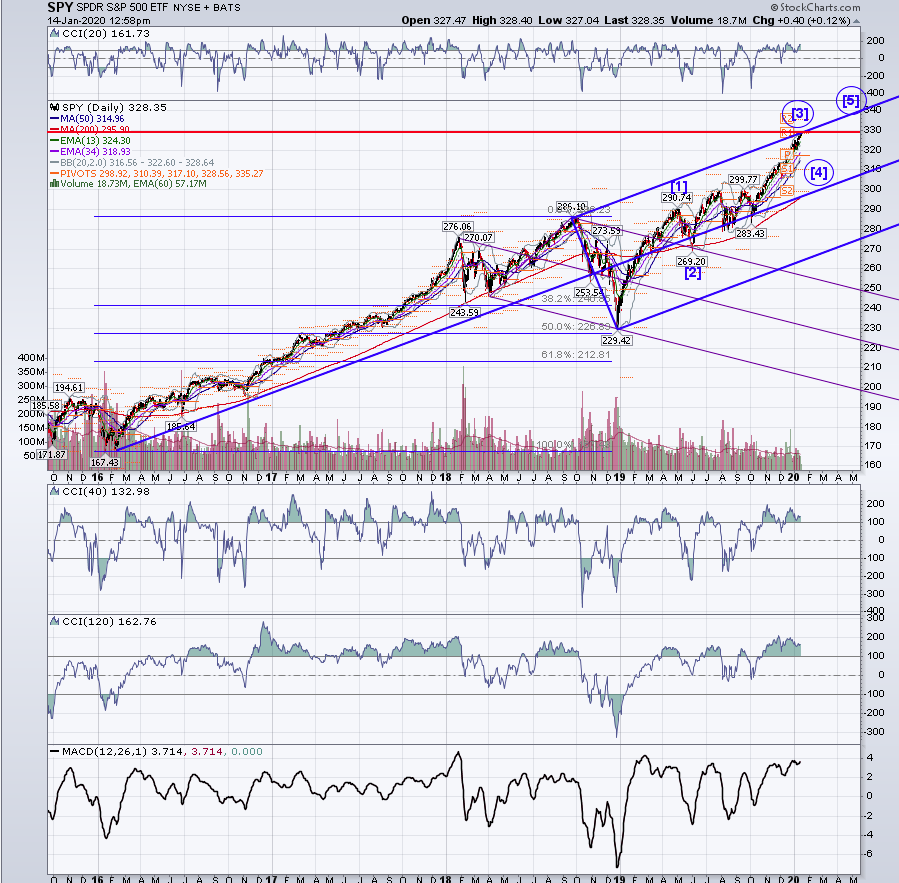
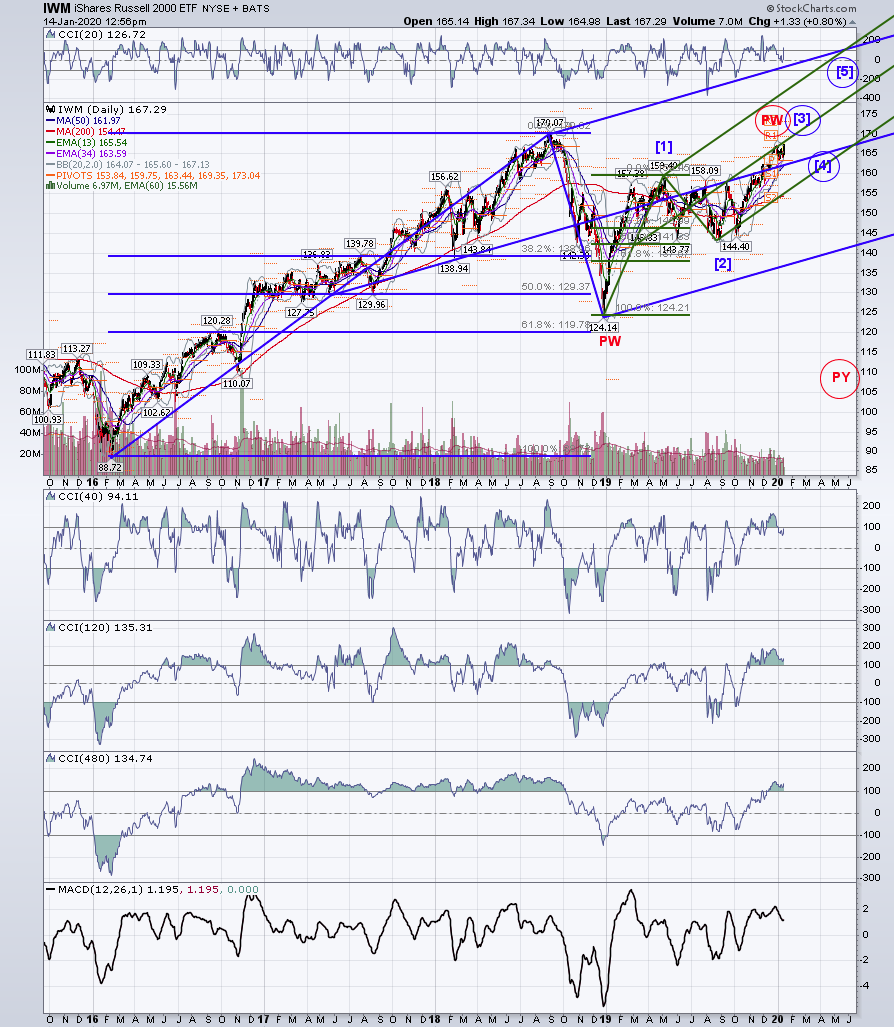
index etfs as of now
Click image for original size
Click image for original size
Click image for original size
Click image for original size
RA
rat89
Rep: 0
Posts: 7,015
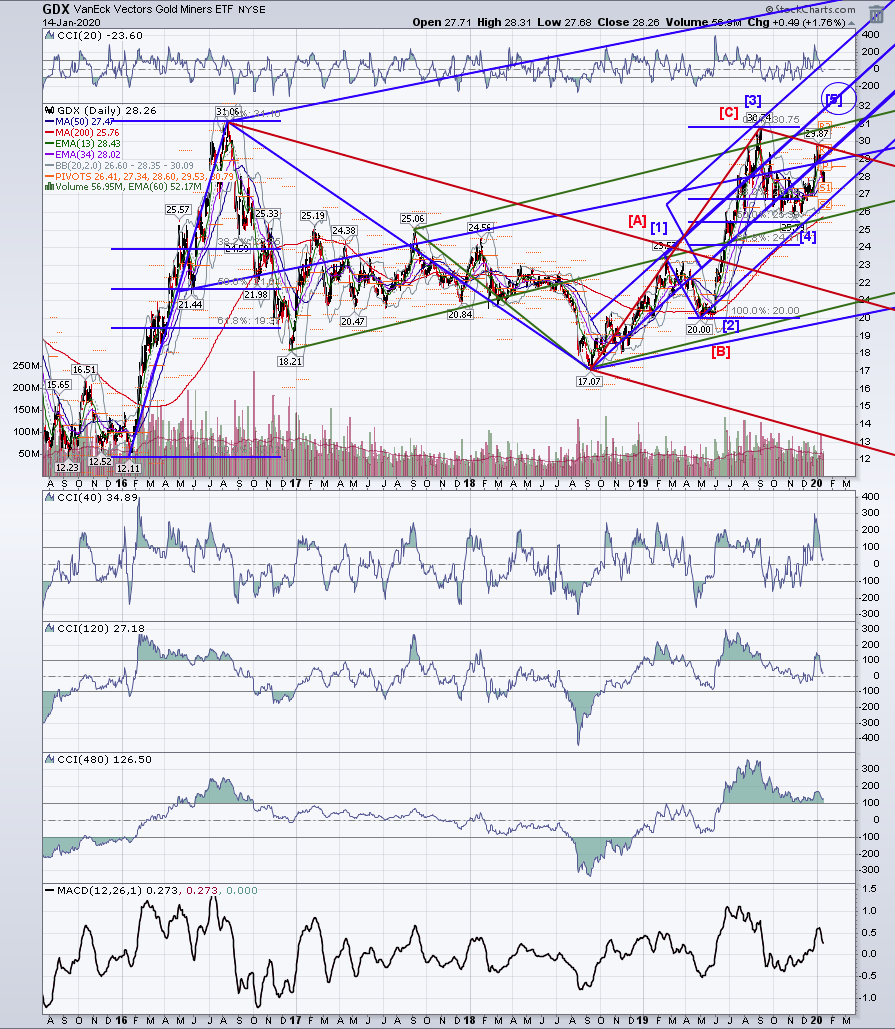
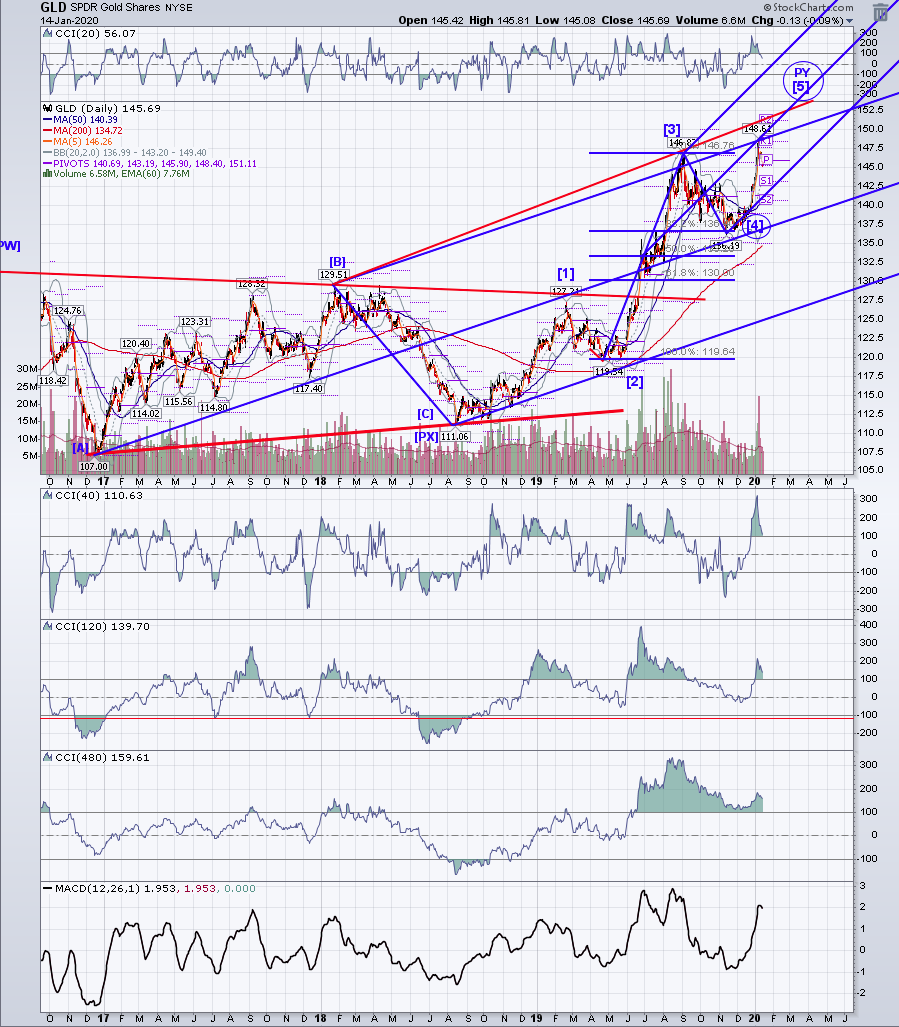
gld and gdx daily - as you all know I've been very bullish on gld and gdx, however, there is a scenario where gld completed 5 waves up for wave PY at 148.62. The lack of confirmation by gdx is troubling, and there is a bearish gdx possibility that cannot be ignored. These are the charts as of the close yesterday, and until gdx takes out last week's high, we won't know. for now I am viewing this recent pullback as wave minor 2 of [5], and the typical wave 2 retraces 62% - 78% of wave 1. Those areas are 27.35 and 26.66. Note that the bull scenario is intact as long as 25.79 is not taken out.
Click image for original size
Click image for original size