MyPivots
Sign In
RA
rat89
Rep: 0
Posts: 7,015
starting it off early with some thoughts for the weekend:

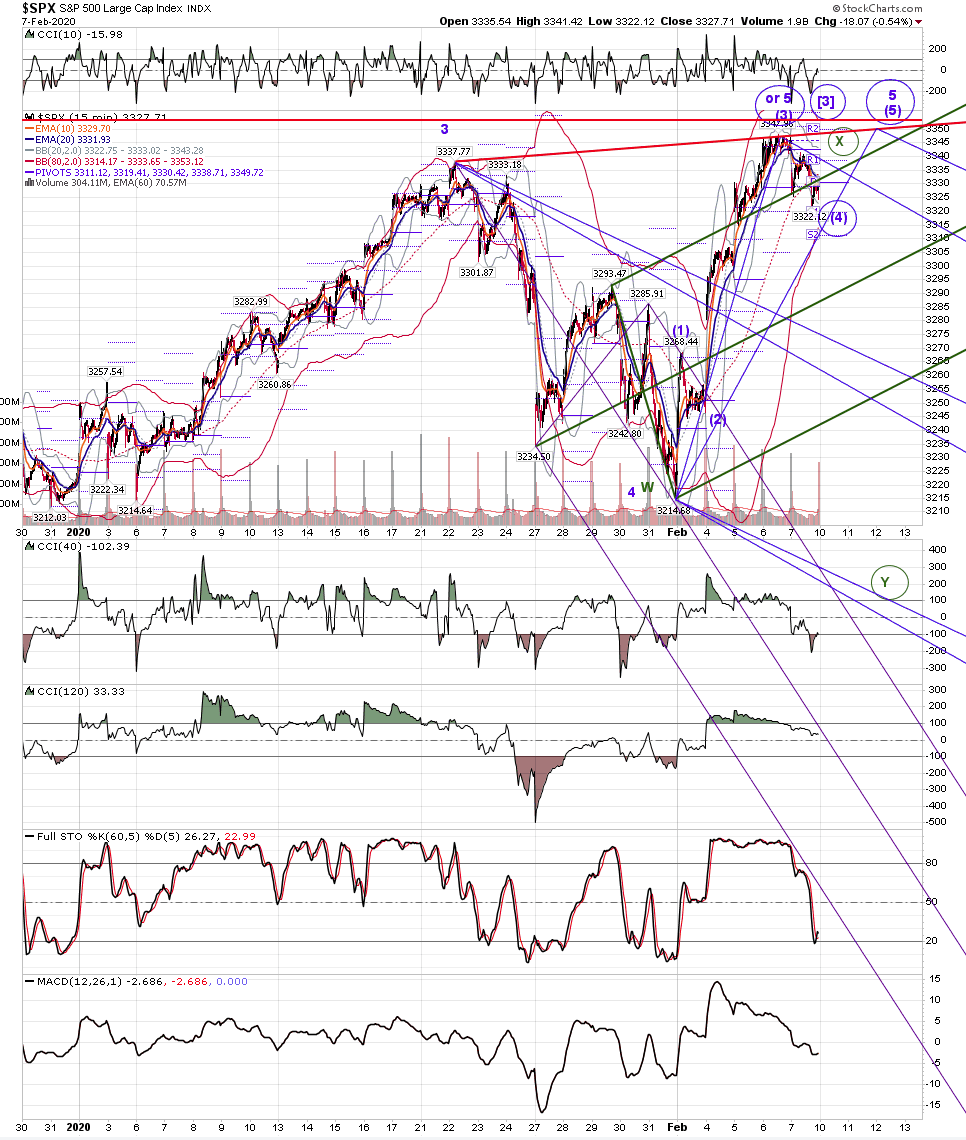
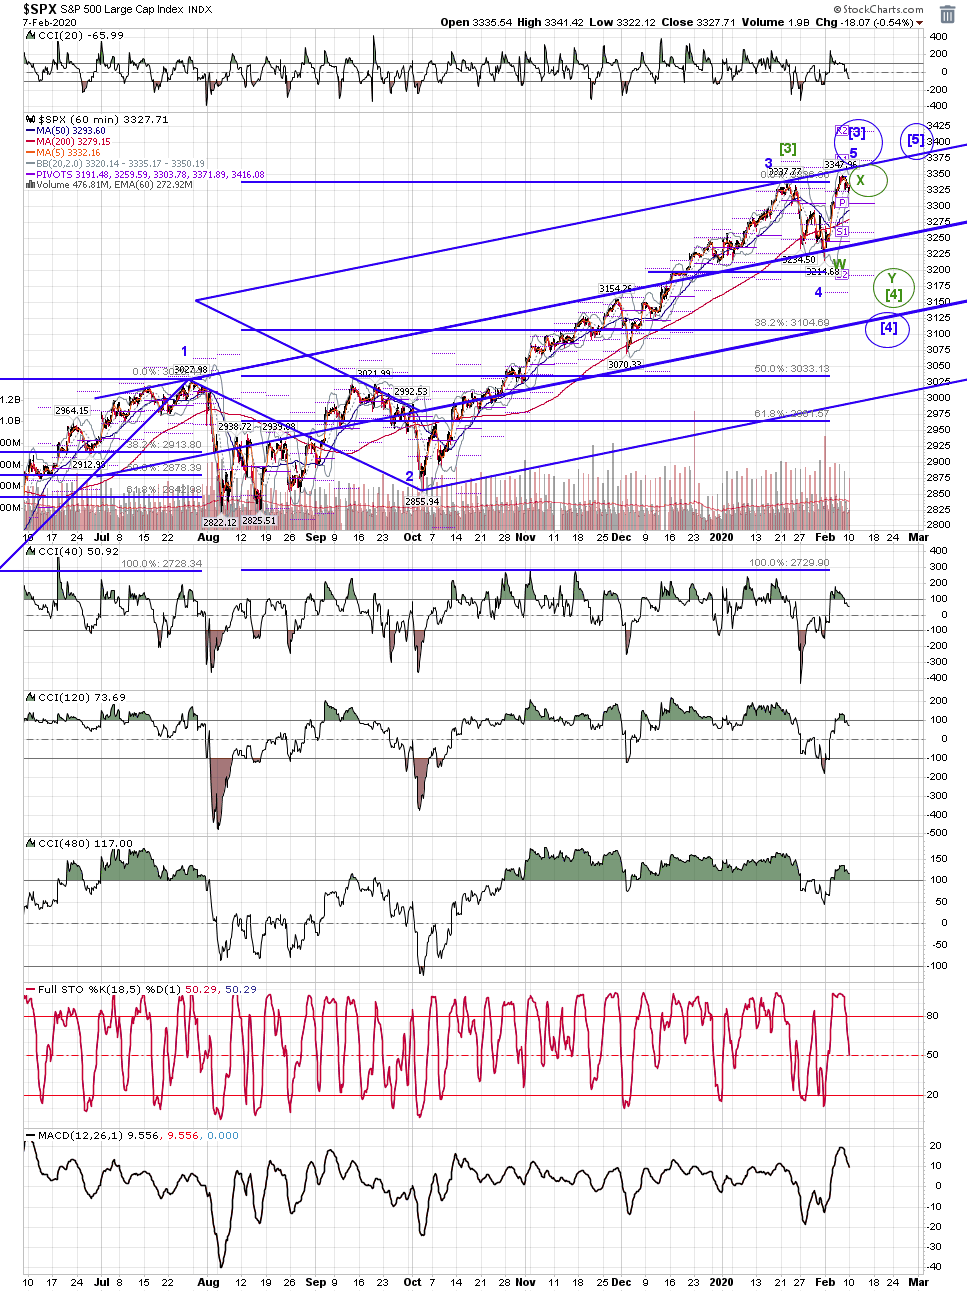
spx 60 and 15 - the big question for me is this - when did, or when will, Major [3] wave up for spx end? For the green count, it ended at 3338, and wave Major [4] is in progress, having given us wave W to 3214, a flat wave X to 3347 (flat because it took out the prior high and retraced more than 100% of W), and is now looking to Y to compete [4].

For the blue count, wave Major [3] is in progress, and has a variety of targets, but the nearest targets would have it ending soon, or at the high a couple of days ago. For me, the more graceful count for blue would give spx a marginal higher high early next week for wave (5) of 5 of [3]. It's a good time to be on your toes, as there is all sorts of negative divergence building up on the daily.
Click image for original size
screen shot 2020 02 08 at 10 34 21 am png

Click image for original size
screen shot 2020 02 08 at 10 51 00 am png
AL
albert
Rep: 99
Posts: 3,094
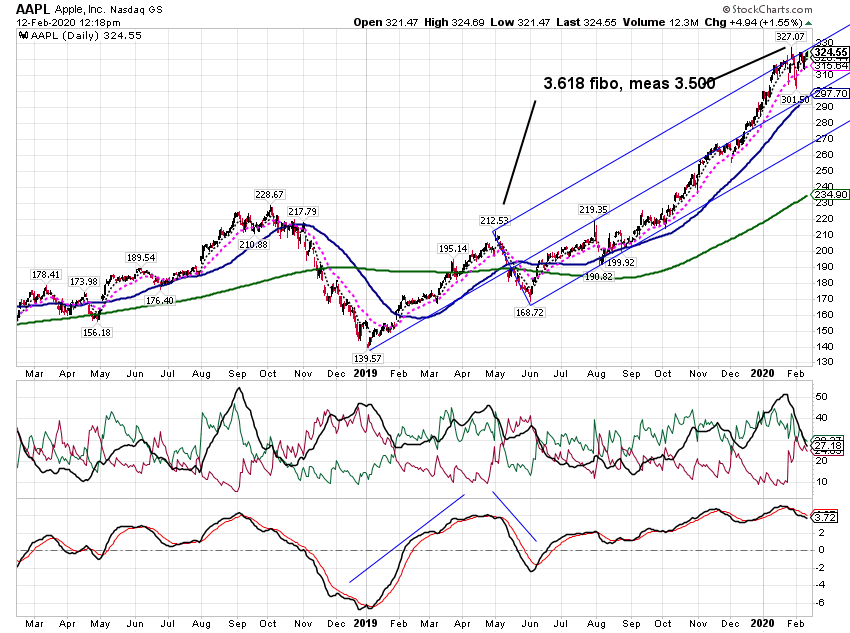
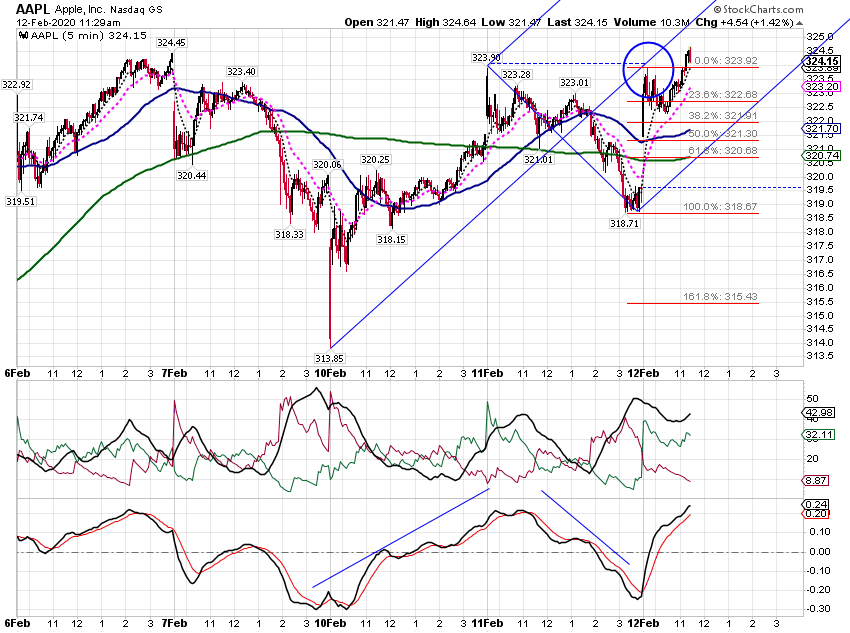
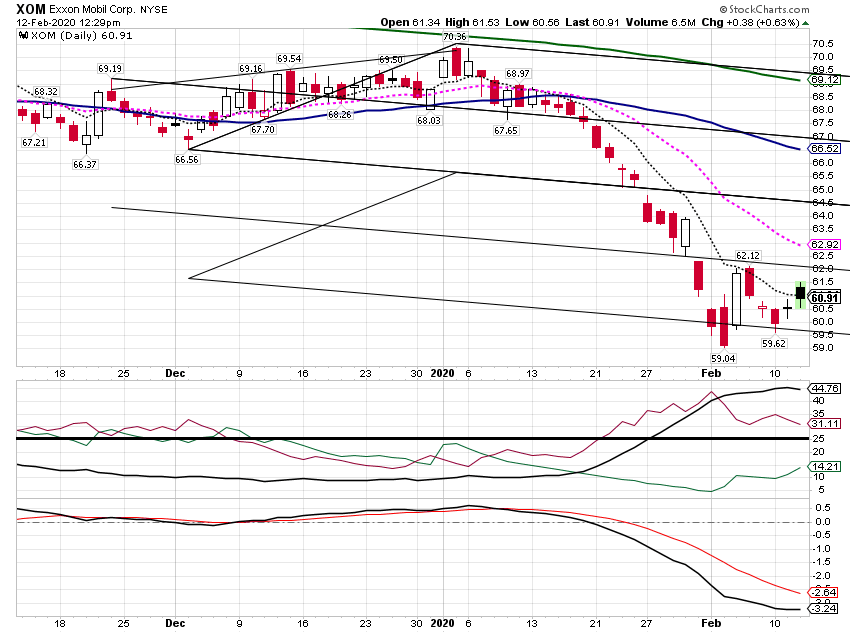
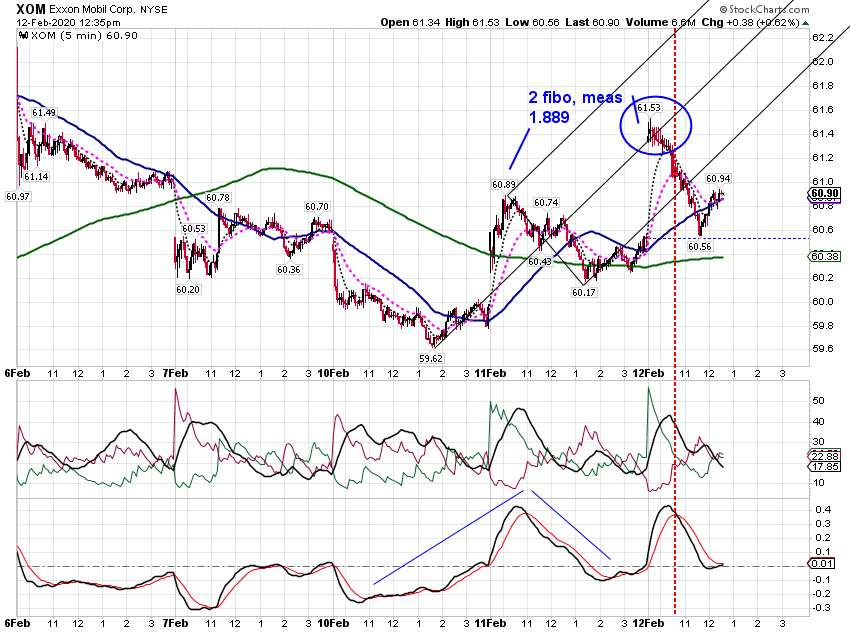
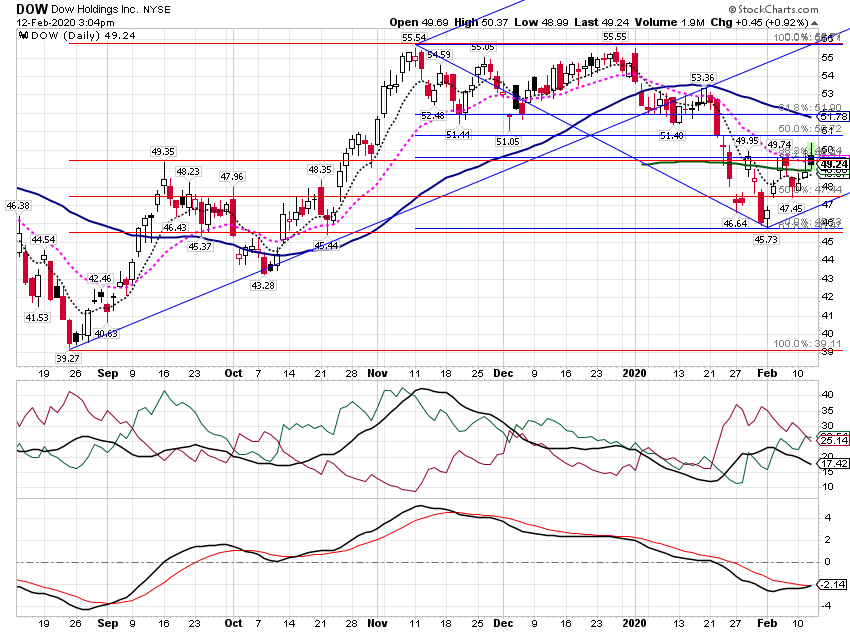
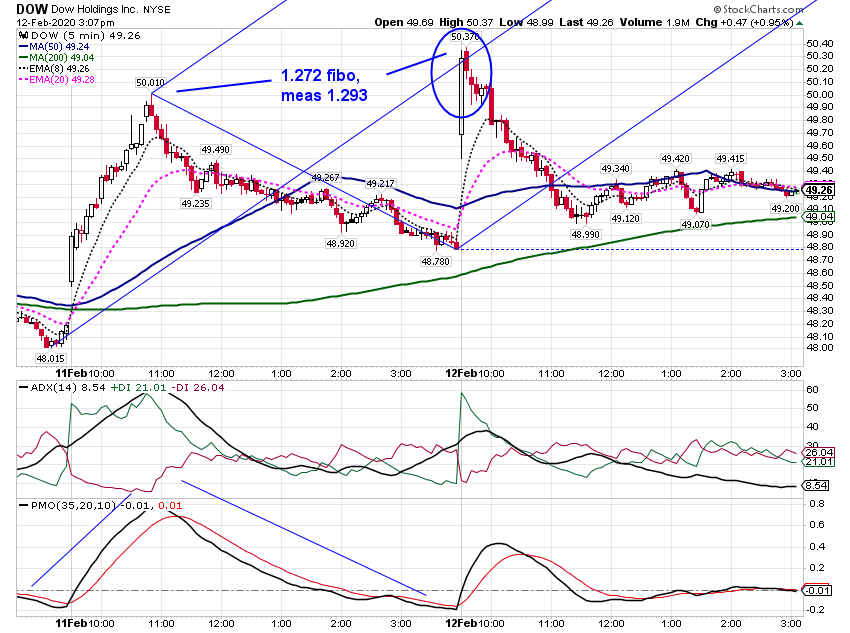
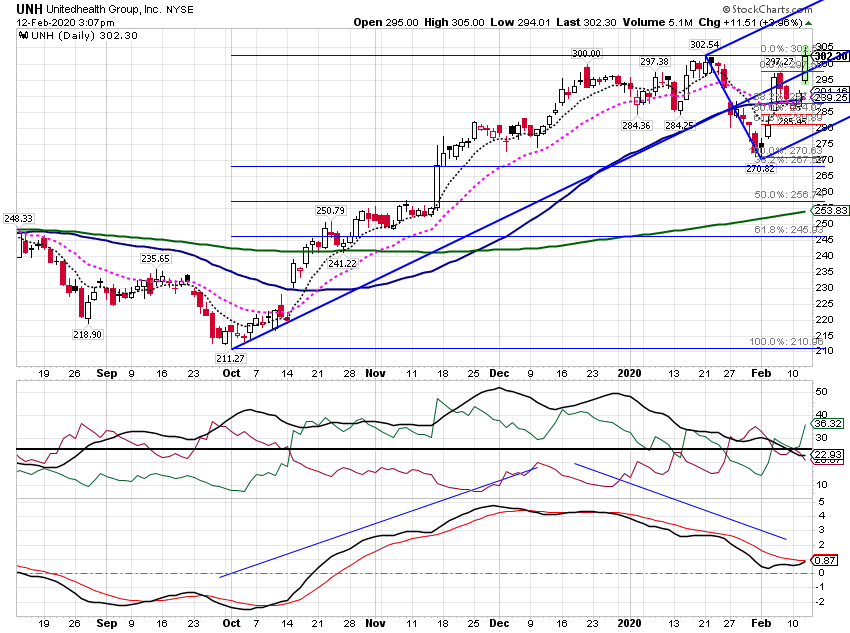
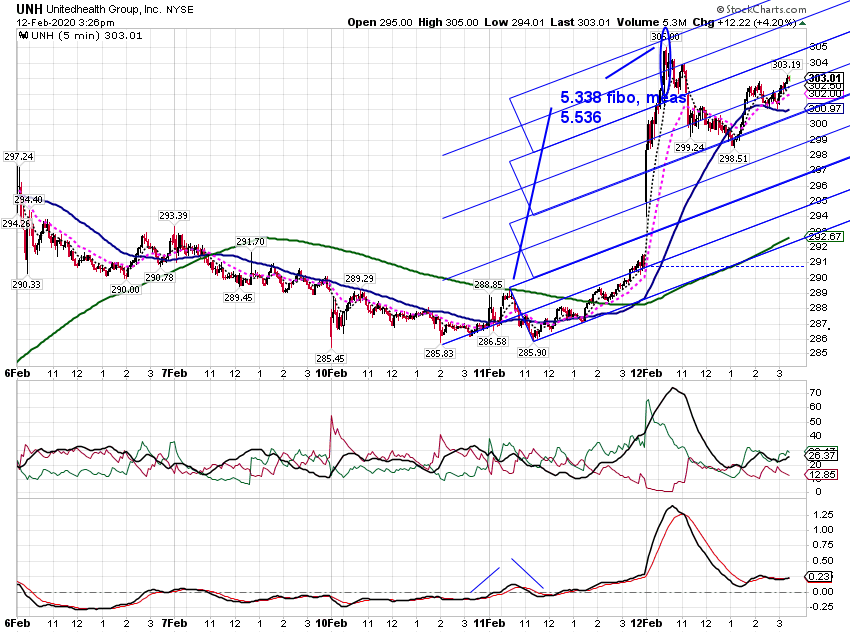
Paper trading. Made some on AAPL long calls. I broke even on XOM with a put.

Al :--))

Click image for original size
sc1990 png


Click image for original size
sc1989 png


Click image for original size
sc1991 png


Click image for original size
sc1992 png
AL
albert
Rep: 99
Posts: 3,094
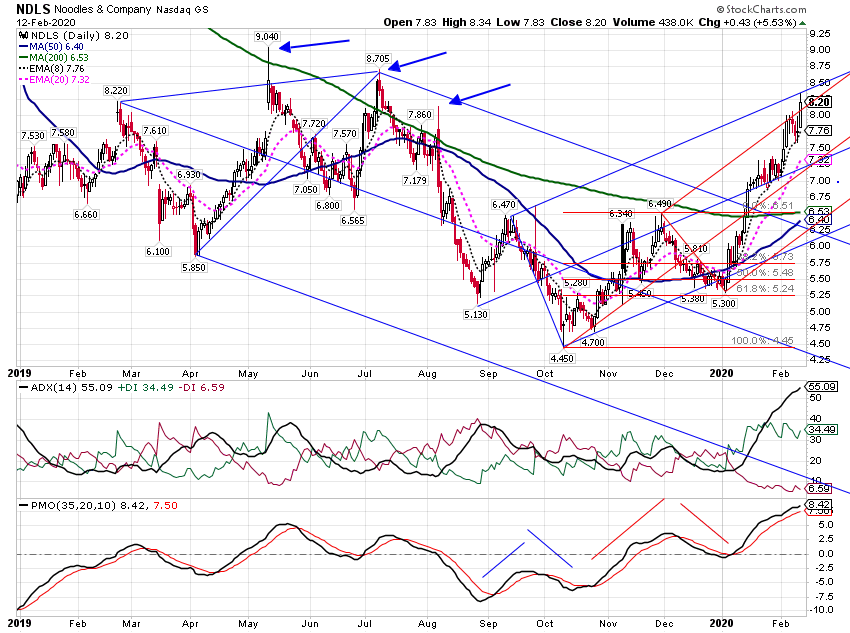
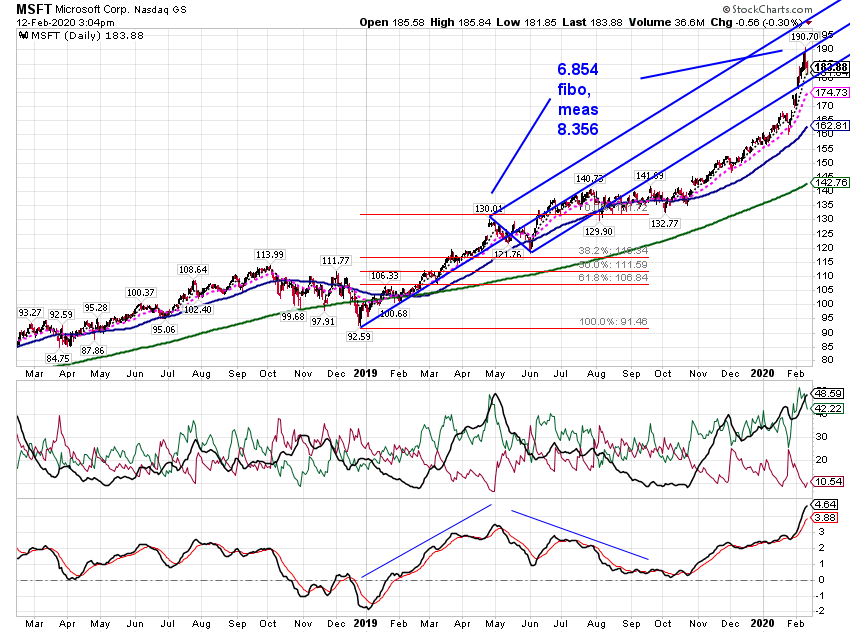
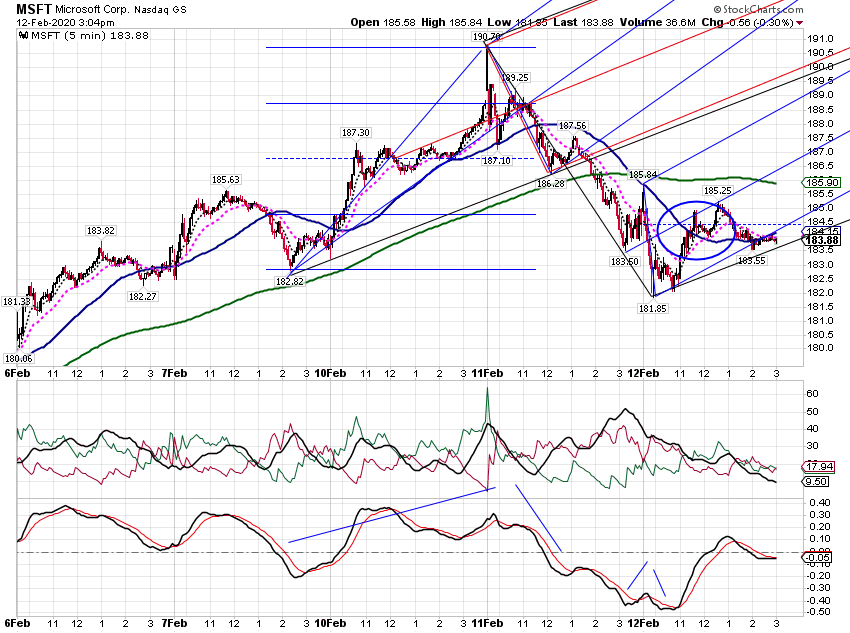
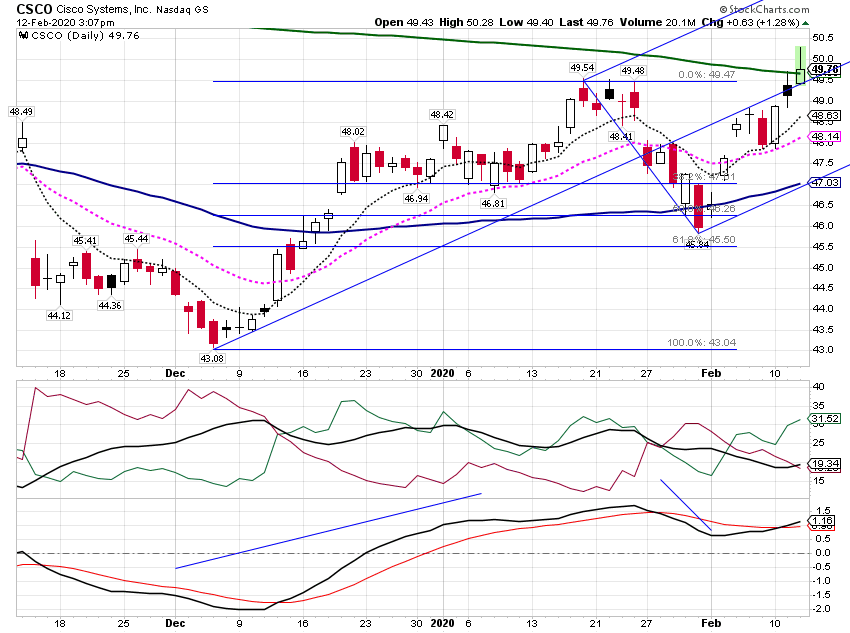
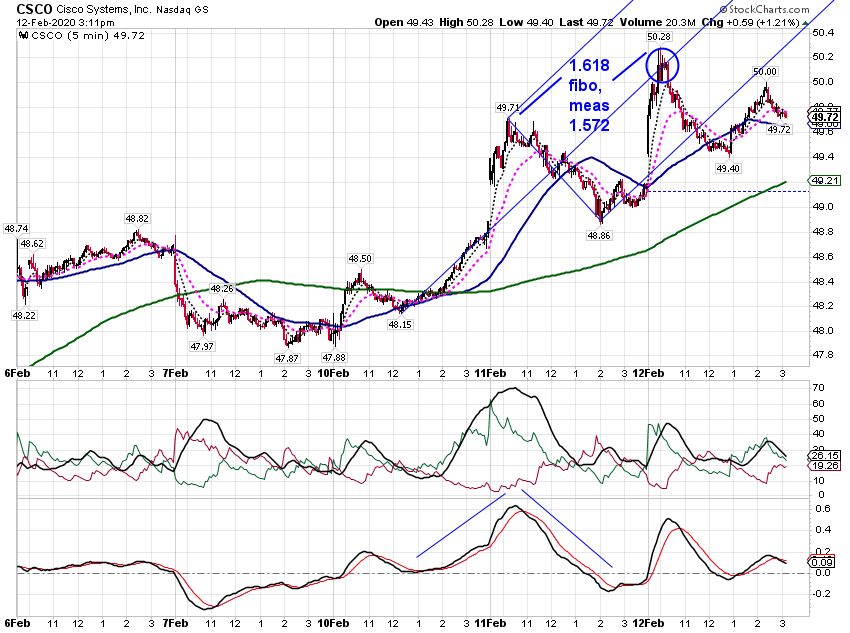
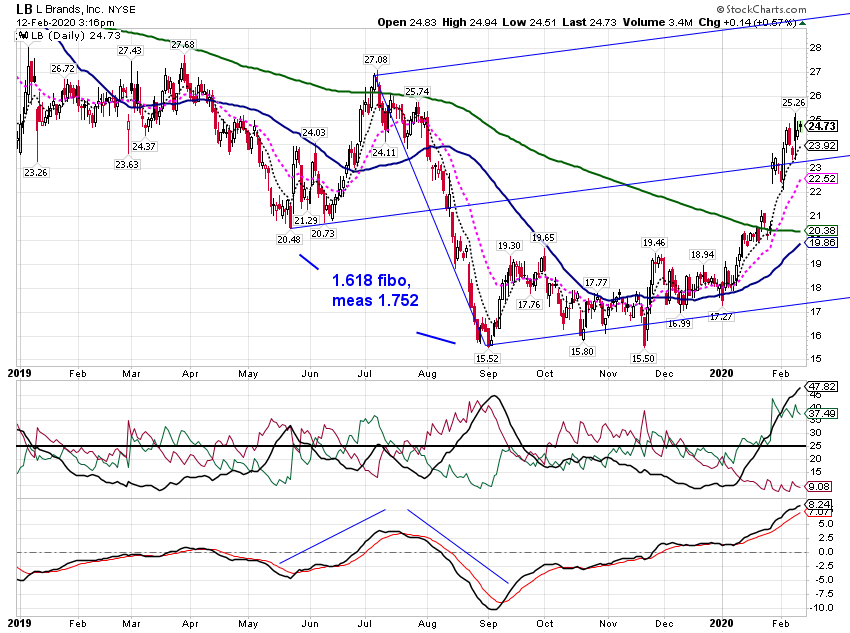
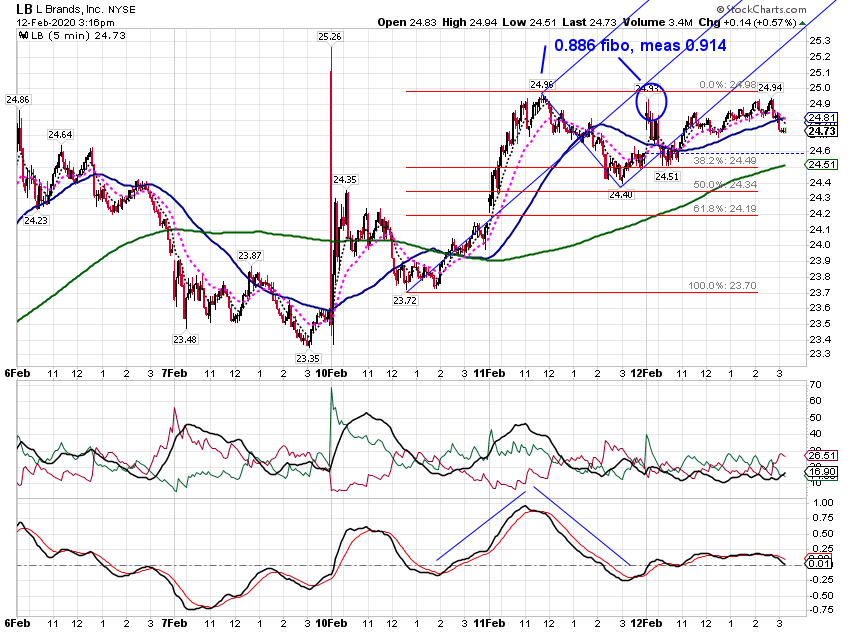
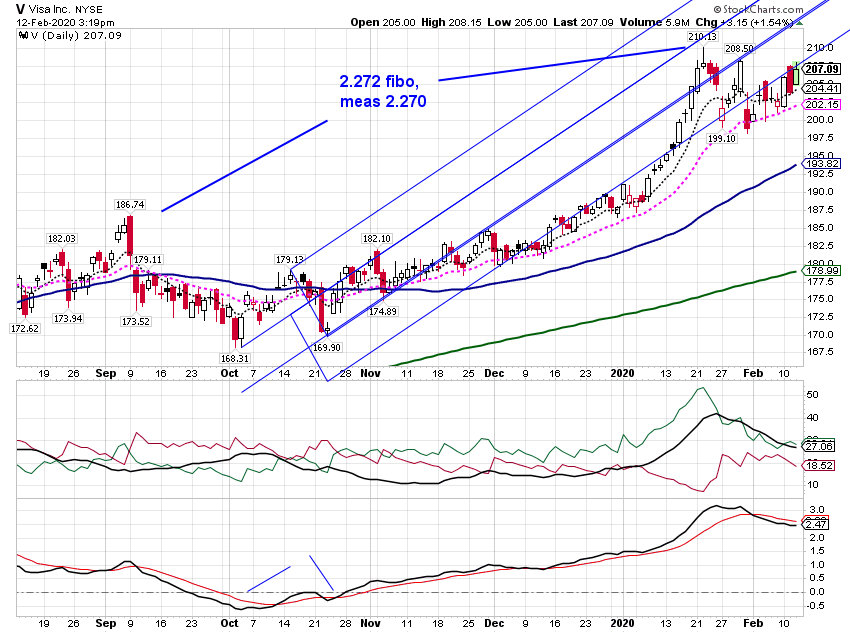
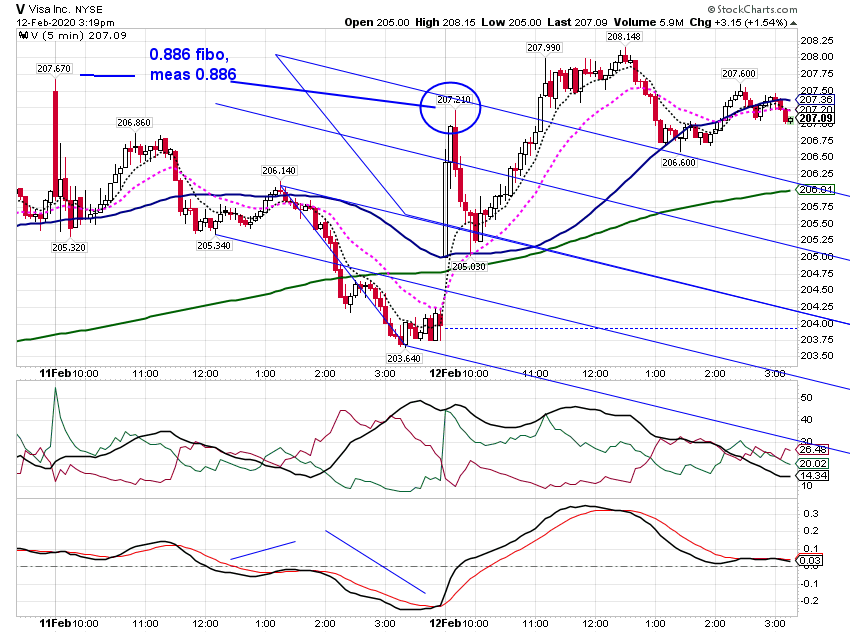
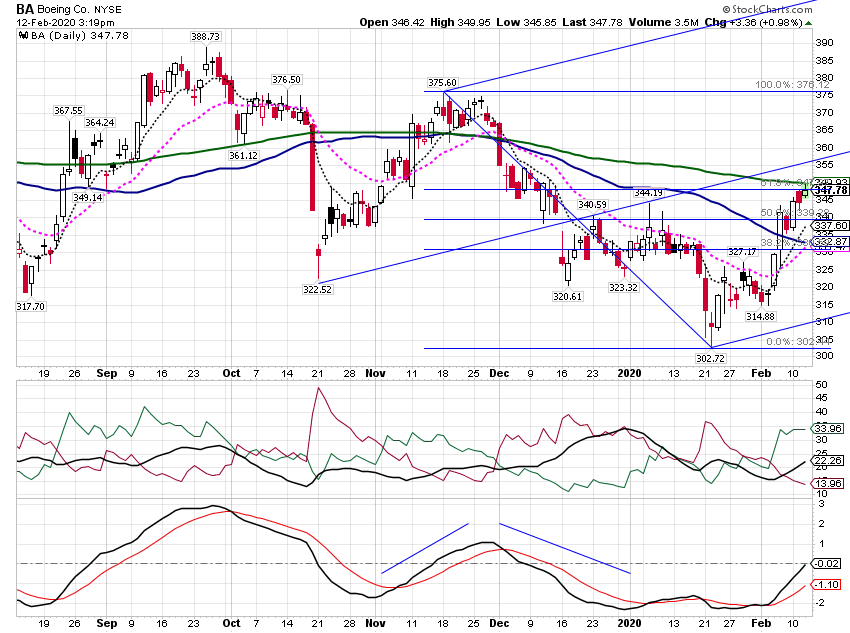
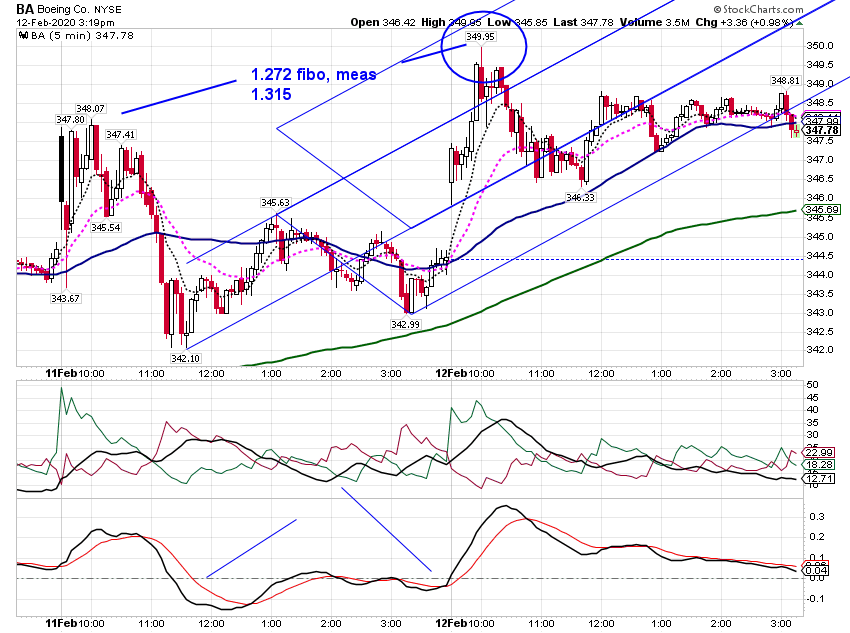
Here are some recent stocks and etfs that I may have paper traded I am looking for bread and butter trade target opportunities at the open using ML sets. I am also looking at the PMO peaks and troughs for guidance in placing a ML set. I am looking for PMO troughs and peaks that straddle the PMO zero line. For example, I look for a PMO trough below the PMO zero line (or reverses near it) for ML Set Point 1 area, followed by a PMO peak that is above the zero line (or reverses near it) for ML Set Point 2 area,, followed by another PMO trough that dips below the zero line (or reverses near it) for ML Set Point 3 area, for a BUY, more or less. This is a work in progress.

AL ;--))

Here is a sample chart that lists the indicators.
Click image for original size
sc2007 png

OK.
Click image for original size
sc1993 png

Click image for original size
sc1994 png

Click image for original size
sc1995 png

Click image for original size
sc1996 png

Click image for original size
sc1997 png

Click image for original size
sc1998 png

Click image for original size
sc1999 png

Click image for original size
sc2000 png

Click image for original size
sc2001 png

Click image for original size
sc2002 png

Click image for original size
sc2003 png

Click image for original size
sc2004 png

Click image for original size
sc2005 png

Click image for original size
sc2006 png
RA
rat89
Rep: 0
Posts: 7,015
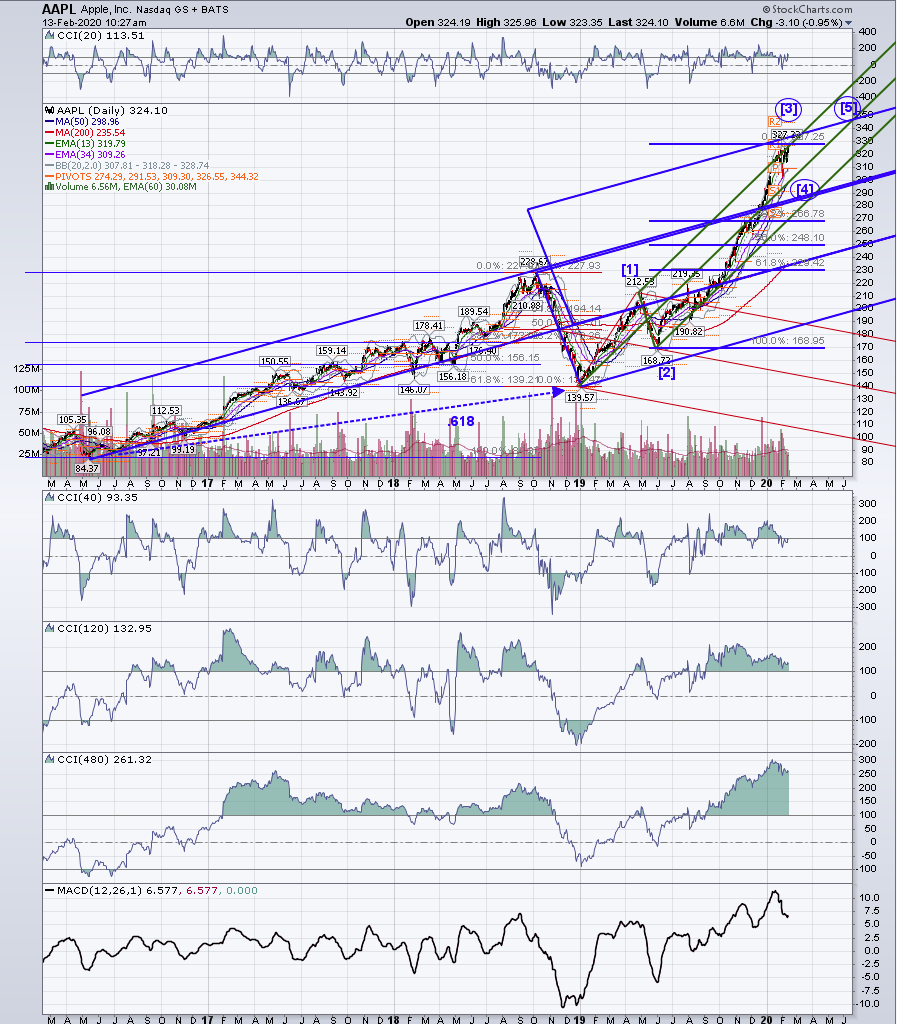
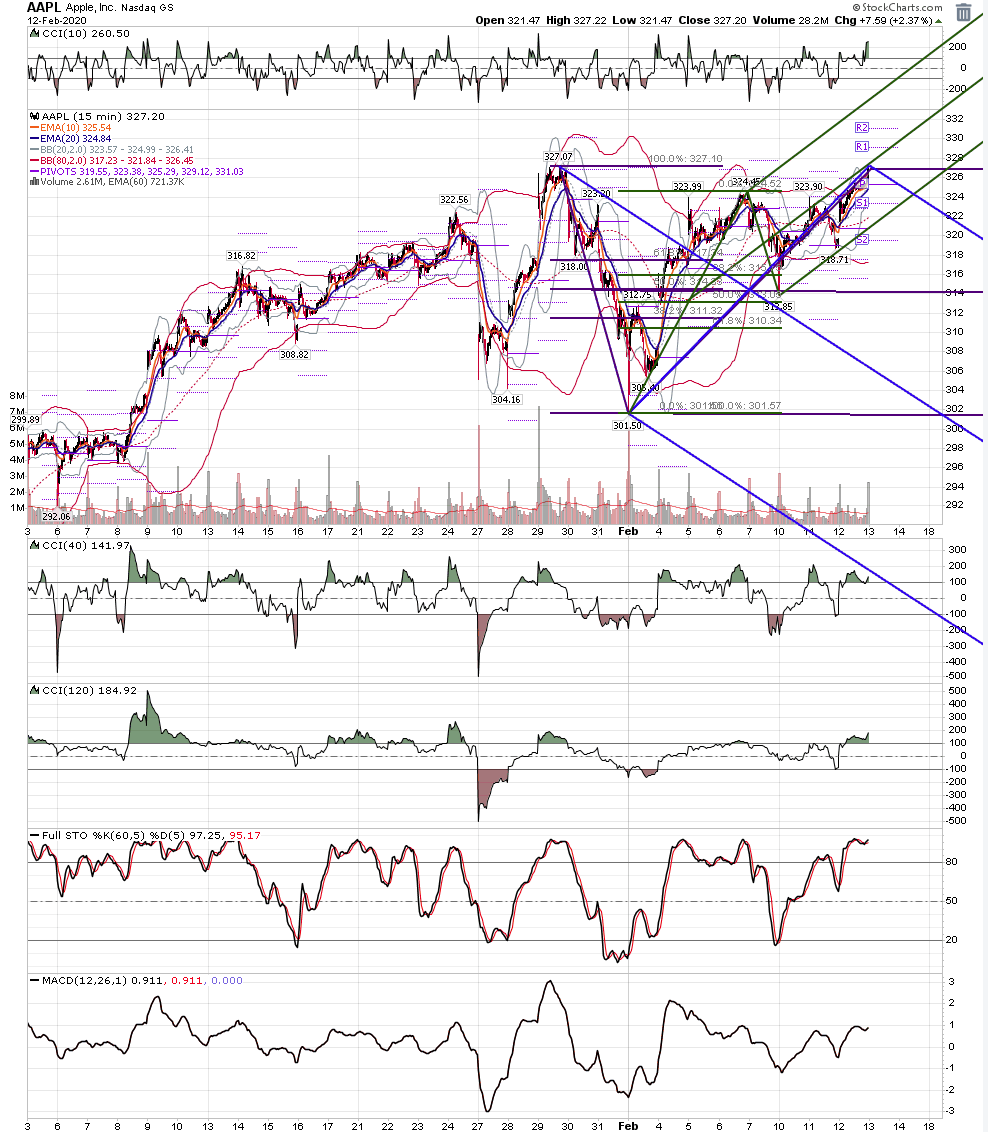
Al, you are doing some interesting work. I have to say that I never heard of fib 3.618! here is aapl daily and 15....it's possible the high yesterday was a flat wave retest, or a final high for a wave [3]. I guess we shall see....

Click image for original size
screen shot 2020 02 13 at 10 28 02 am png

Click image for original size
screen shot 2020 02 13 at 8 29 46 am png
RA
rat89
Rep: 0
Posts: 7,015
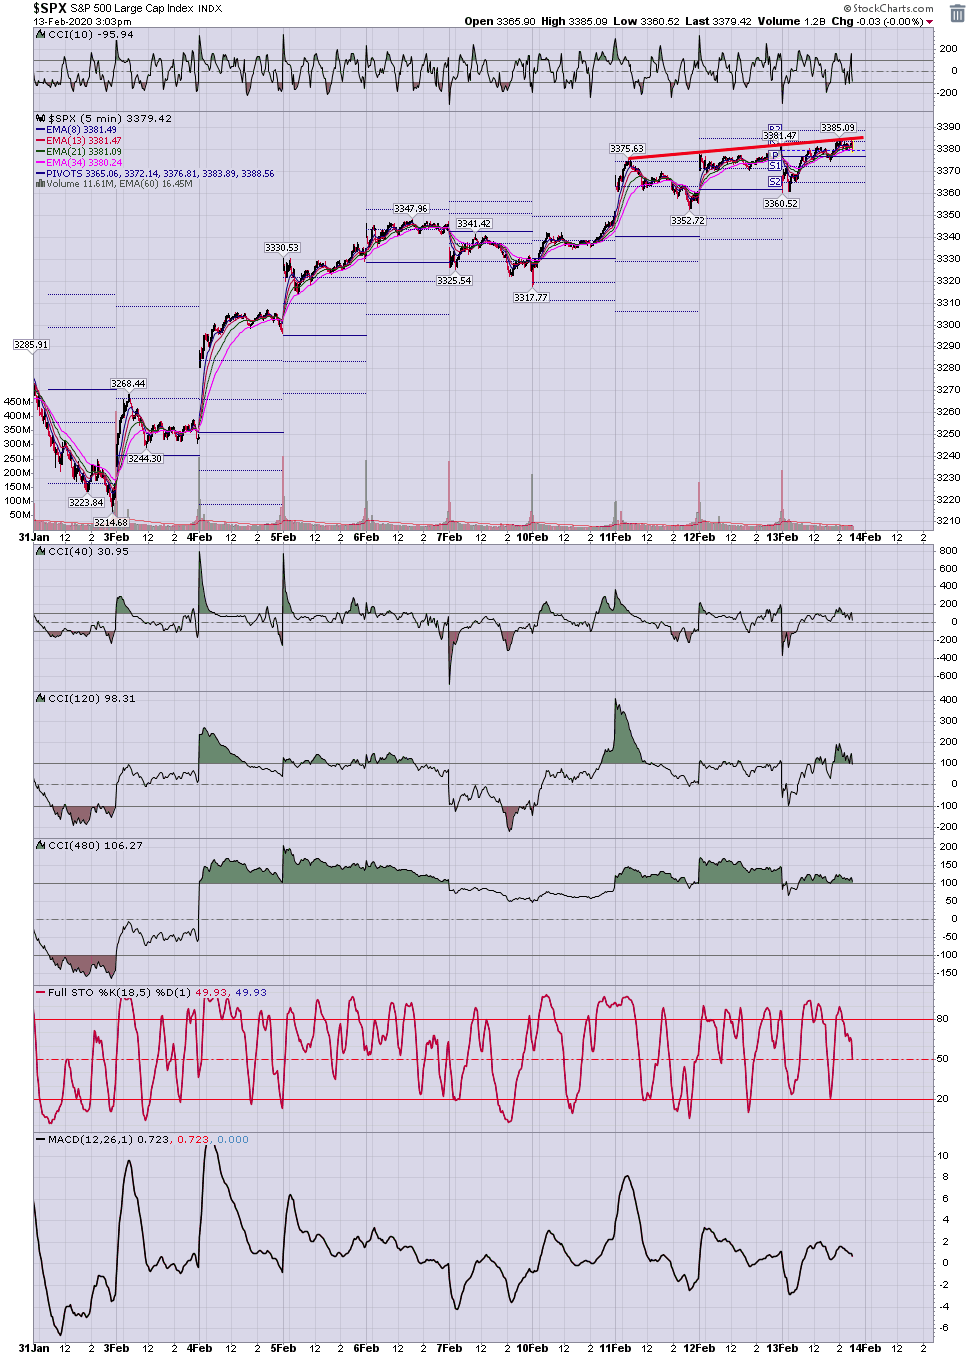
spx 5
Click image for original size
screen shot 2020 02 13 at 3 04 00 pm png
AL
albert
Rep: 99
Posts: 3,094
rat,

Good observation. I got the number from page 46, "Advanced Fibonacci Trading Concepts," by Jim Kane. I guess Jim said 3.618 might be a fibonacci number. Jim discussed the Pythagorean applied to solve the diagonal of a "golden" rectangle, with sides equal to 1, and 1.618. The diagonal is 1.902. And (1.902)^2 (squared) is 3.618.

Good trading,

Al :--)


Originally posted by rat89

Al, you are doing some interesting work. I have to say that I never heard of fib 3.618! here is aapl daily and 15....it's possible the high yesterday was a flat wave retest, or a final high for a wave [3]. I guess we shall see....

Click image for original size
screen shot 2020 02 13 at 10 28 02 am png

Click image for original size
screen shot 2020 02 13 at 8 29 46 am png

AL
albert
Rep: 99
Posts: 3,094
rat,

That was supposed to be page 45, not 46. Sorry about that.

Al


Originally posted by albert

rat,

Good observation. I got the number from page 46, "Advanced Fibonacci Trading Concepts," by Jim Kane. I guess Jim said 3.618 might be a fibonacci number. Jim discussed the Pythagorean applied to solve the diagonal of a "golden" rectangle, with sides equal to 1, and 1.618. The diagonal is 1.902. And (1.902)^2 (squared) is 3.618.

Good trading,

Al :--)


Originally posted by rat89

Al, you are doing some interesting work. I have to say that I never heard of fib 3.618! here is aapl daily and 15....it's possible the high yesterday was a flat wave retest, or a final high for a wave [3]. I guess we shall see....

Click image for original size
screen shot 2020 02 13 at 10 28 02 am png

Click image for original size
screen shot 2020 02 13 at 8 29 46 am png


RA
rat89
Rep: 0
Posts: 7,015
Thanks Al! I actually found mention of it on a couple of trading sites...who knew? ;)
RA
rat89
Rep: 0
Posts: 7,015
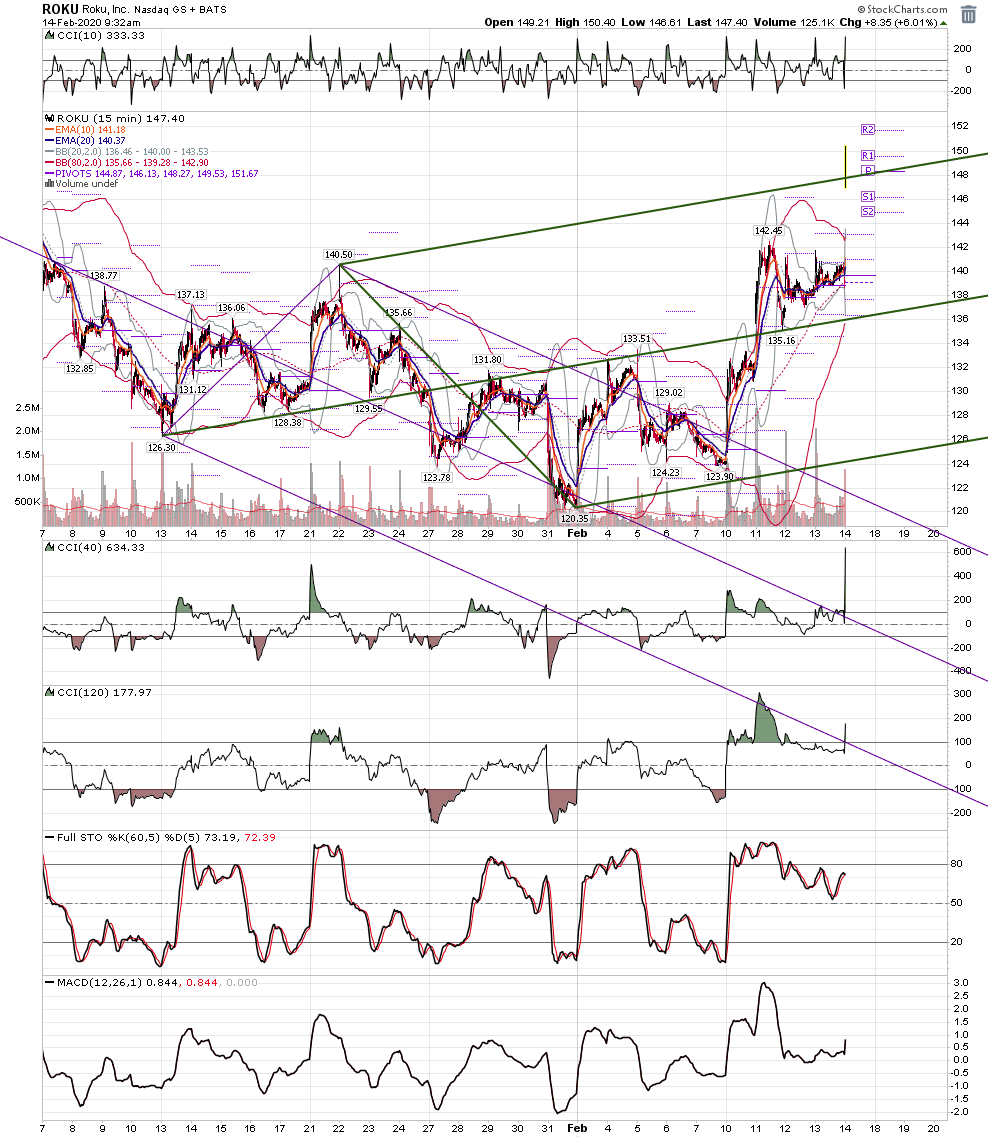
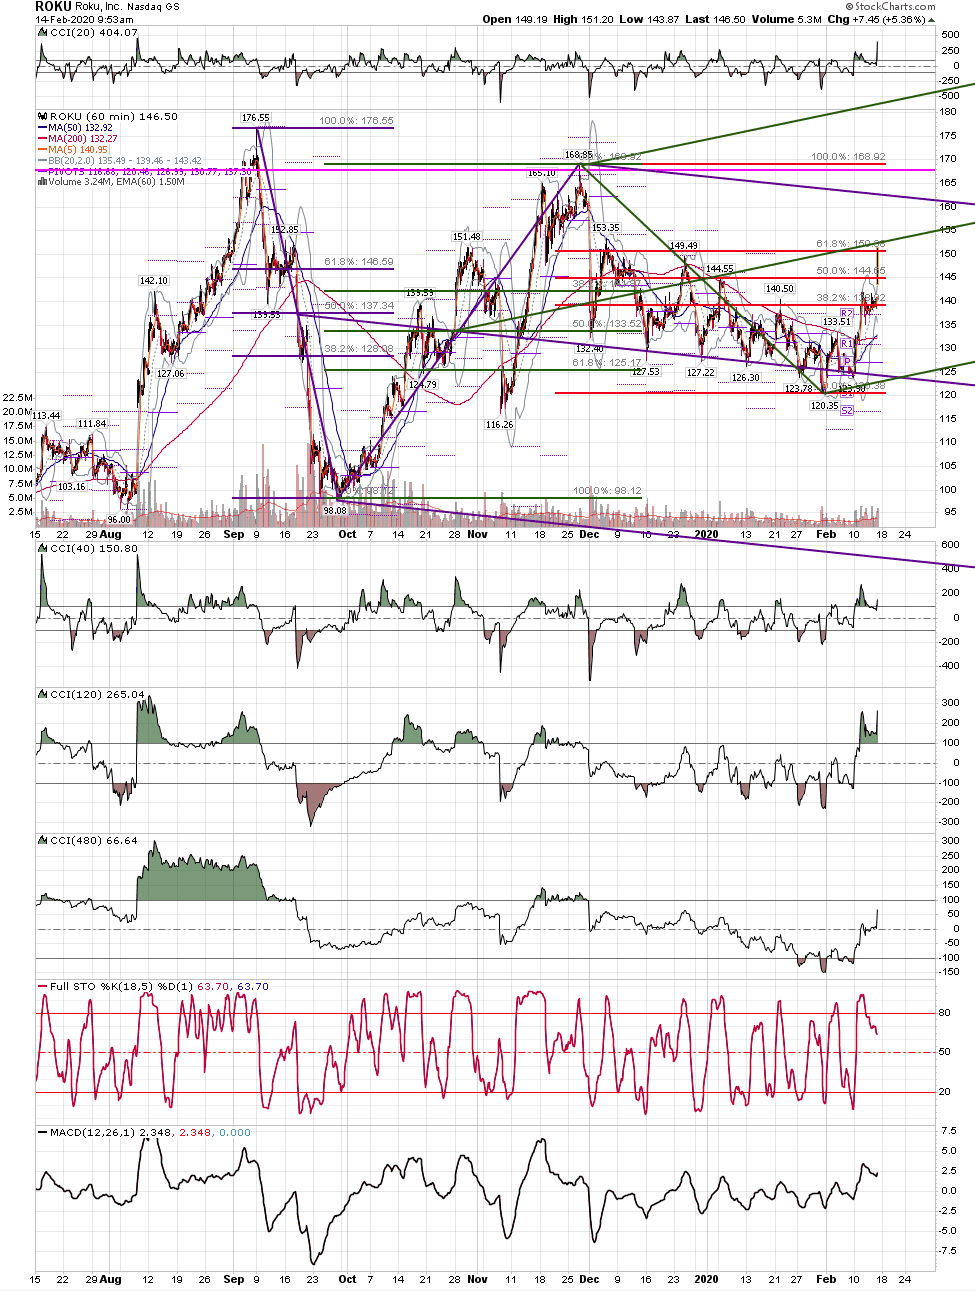
roku
Click image for original size
screen shot 2020 02 14 at 9 32 22 am png

Click image for original size
screen shot 2020 02 14 at 9 55 54 am png
RA
rat89
Rep: 0
Posts: 7,015
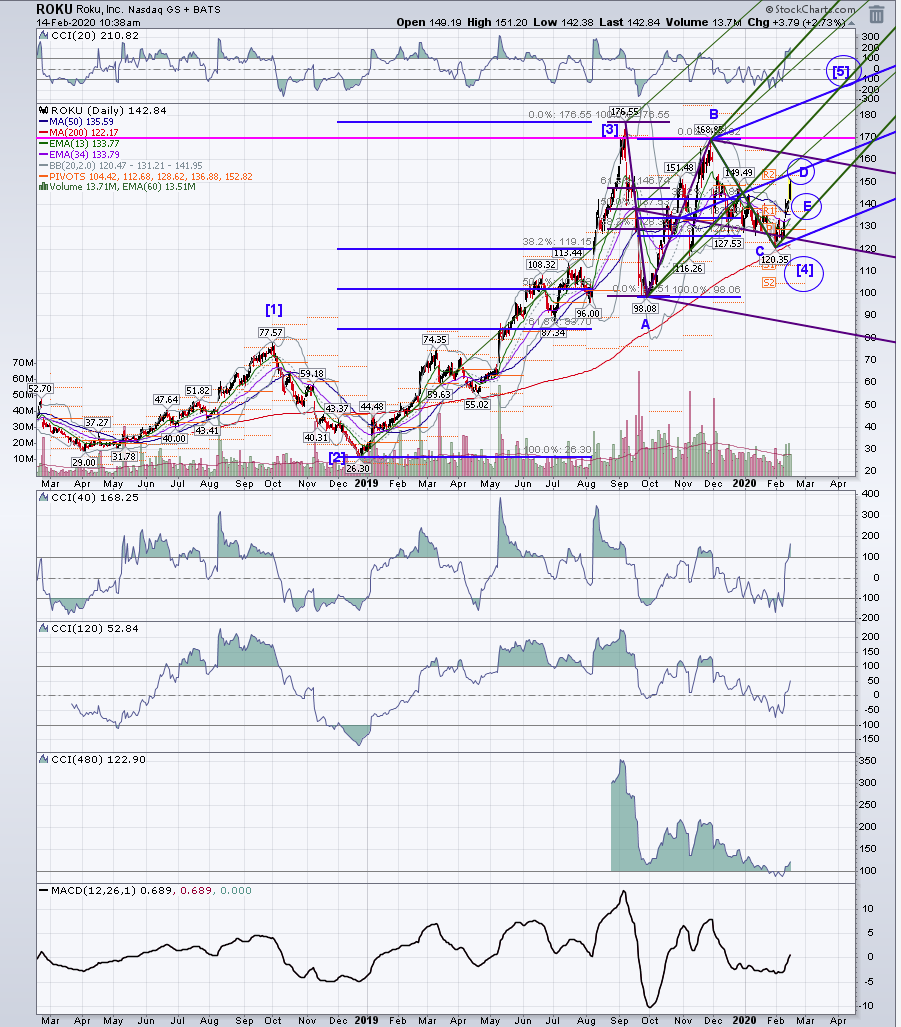
roku daily bigger picture?
Click image for original size
screen shot 2020 02 14 at 10 38 14 am png
AL
albert
Rep: 99
Posts: 3,094
rat,

It is a rarely-used ratio, IMHO.

Al :--)
Originally posted by rat89

Thanks Al! I actually found mention of it on a couple of trading sites...who knew? ;)
AL
albert
Rep: 99
Posts: 3,094
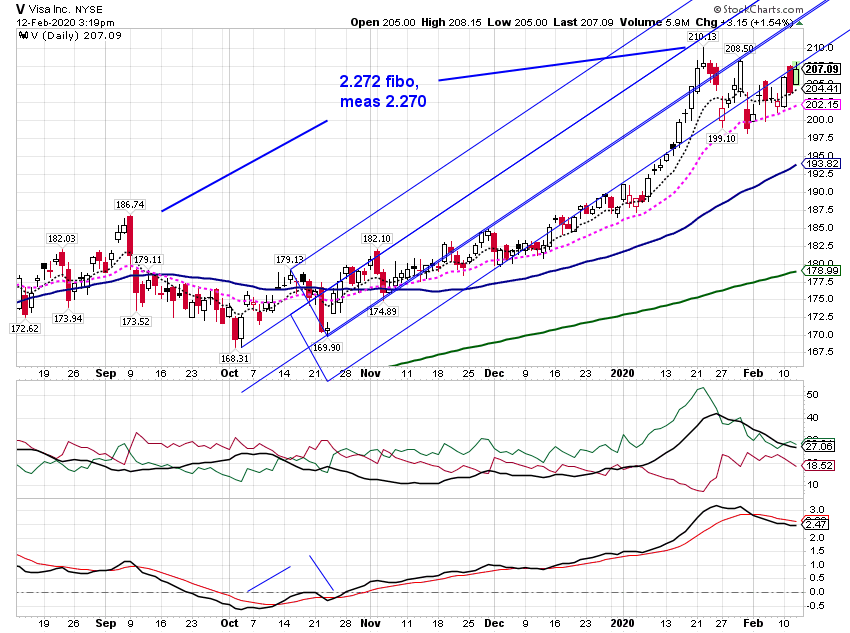
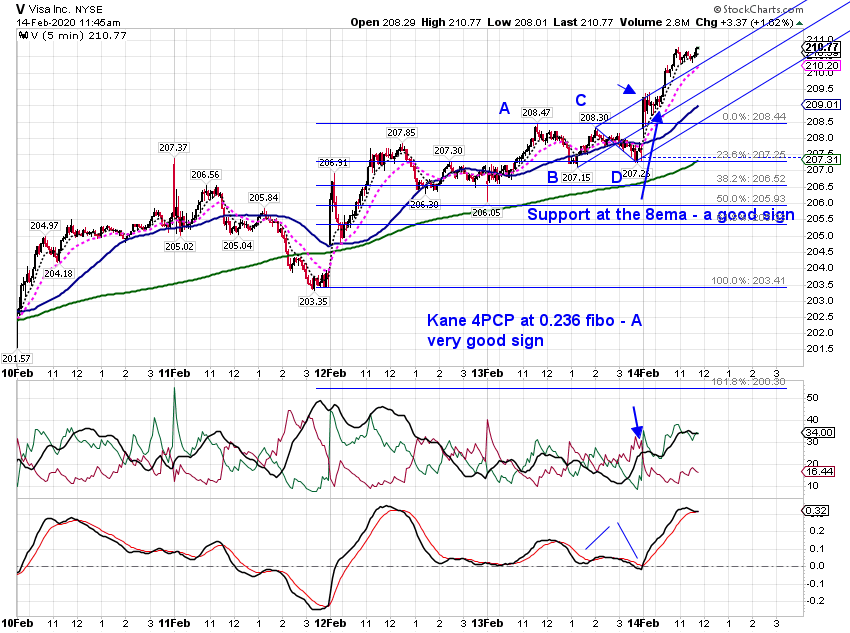
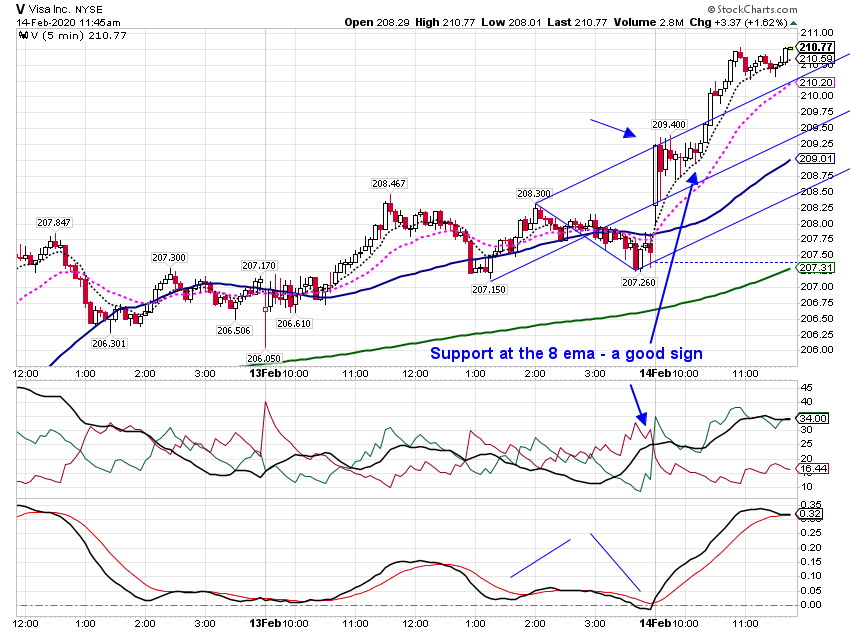
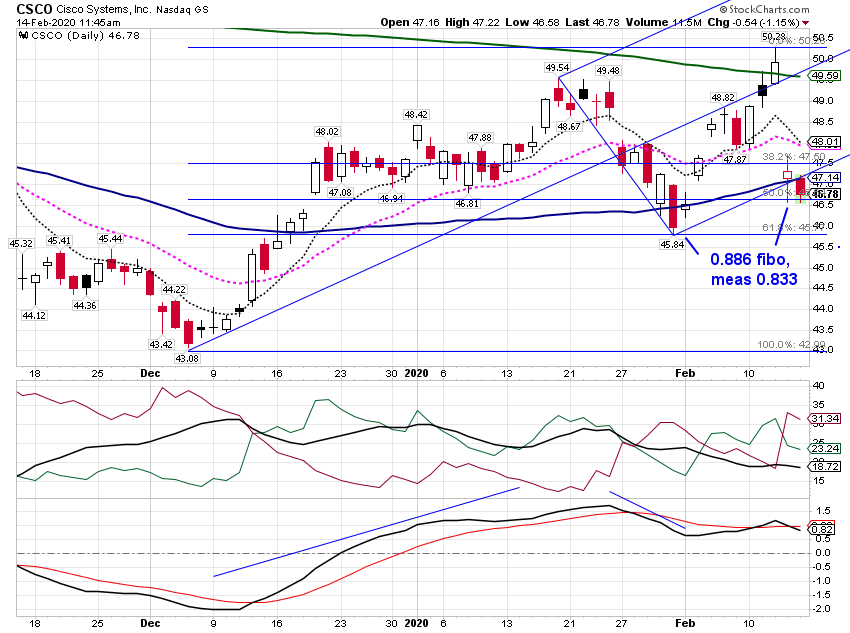
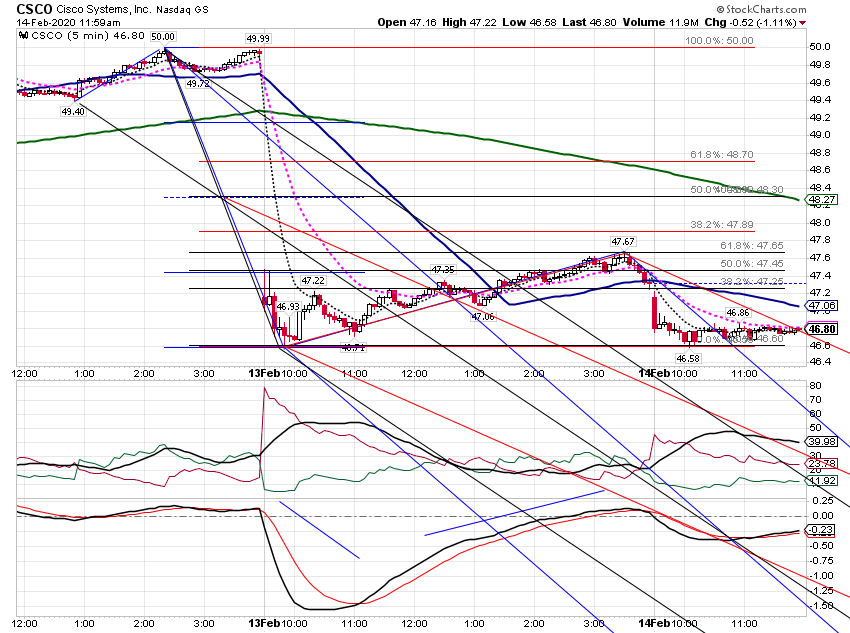
Paper trading. I am still looking at trying to find targets for opening moves by making use of ML sets based on PMO "line wiggles." This time I used the StockCharts "Market Movers" feature of StockCharts.com. I looked at the "Most Active" list for symbols that also appeared in the "% Up" and % Down" columns. I figured these might have small big-ask spreads. I paper traded Visa V, with a long call and it worked well. I found that V price formed a very nice Kane 4P at 0.236 fibo at yresterday's close. My CSCO puts did not do as well, and I exited with a loss. I probably got in the CSCO trade too late. That 0.618 fibo retrace from CSCO's previous morning mid gap might have been a good entry point for a long put.

Al :--))

Click image for original size
sc2003 png

Click image for original size
sc2008 png

Click image for original size
sc2009 png

Click image for original size
sc2011 png

Click image for original size
sc2012 png