PF - Profit Factor
while i'm certain most (possibly some, hopefully all ) traders 'round har keep a good record of their trades. well, i came across a very simple measure (in an ET thread) for Profit Factor. here it is:
PF = Net Profit / Gross Loss
so, let's say you grossed $1,000. then you had $50 in commissions. plus, you had $200 in losses. So you would have:
GP (Gross Profit) = 1000
GF (Gross Fees) = 50
TL (Total Loss) = 200
NP (Net Profit) = 1000 - 50 - 200 = 750
GL (Gross Loss) = 1000 - 750 = 250
PF = NP / GL = 750 / 250 = 3.0
this gives you a good idea how much it cost you to do business today ($250) and what kind of profit margin you produced (3.0 or 300%). now, obviously, this simple version doesn't include other business expenses (i.e. data subscription fees, charting fees, platform fees, internet fees, advisory fees, and so forth). you could easily add up your monthly fees and figure out how much it cost you each day to do business even if you don't make a single trade. then you would have an even more realistic, more telling PF number. another option would be to calculate it on a per trade basis.
again, nothing groundbreaking or unheardof, but possibly overlooked.
enjoy!
btw: obviously, you could also go through a similar process but also take into account LFT (Loss From Top). in my mind, that would be more effective to get an idea of setup or strategy effectiveness. in other words, you may discover that you give up / return more profits on a more regular basis using Setup A versus Setup B or C. anyway, have fun with it!
From those calculations it looks like a figure of 1.0 or 100% is a bit misleading because if I've understood it correctly then that sort of figure would mean break-even. 100% usually means that you made twice as much as you lost.
Another way to break down your costs is to look at them as fixed and variable costs which is how Management Accountants do the books when working out the feasibility of a business or project.
Your fixed costs can then also be divided into sunk costs and recurring fixed costs. Sunk costs you can usually ignore because you aren't going to incur those costs again. This is like the purchase of a computer or software. Recurring fixed costs are things like your charting package, data feed and/or your trading platform.
Variable costs are the commissions and fees per trade and anything else that is incurred as a function of the act of trading. This can also sometimes be a cost associated with the trading platform if you have to pay licensing fees on a per trade basis.
When doing Profit Factor analysis you can pretty much ignore the fixed costs to start with. What you need to work out is your variable profit. If you are running at a variable loss then you need to shut down operations because each item of activity is adding to your loss.
Assuming that you are running at a variable profit then you can use that Profit Factor figure or your variable profit per unit to calculate how many units you need to turn over per day/month in order to meet your monthly fixed cost obligations. This is your break-even point. Your pure profit then comes after that.
This will give you a measure of how many contracts you need to trade and hence how much capital you need in order to run a successful trading operation.
I'm guessing that 0.001% of traders out there have done this calculation or even thought about this.
Keep at it - you're on the right track.
quote:
Originally posted by day trading
From those calculations it looks like a figure of 1.0 or 100% is a bit misleading because if I've understood it correctly then that sort of figure would mean break-even. 100% usually means that you made twice as much as you lost.
though i am not one to advocate 'fuzzy math' , this may come down to a matter of mathematical semantics. in my mind, if i want to know how much it will cost to make a buck ($1) and i give you $.25 and you give me $1.00, i had a 3.0 PF because my profit equals three times what it cost me to make that profit. if i gave you $.50 and you gave me $1.00 i would have a 1.0 PF because my profit equals 100% of my cost. to me break even would be i give you $1.00 and you give me $1.00 producing a PF of zero. and if that happened, i'd stop doing business with you cuz yer no fun [:P]
i apologize if all i did was restate my original thought - i wasn't trying to create a circular argument . i think we can both be right (warm fuzzies for everybody!!), because i think the most important point is to find some measure or metric that lets you the trader have an ongoing and easily obtainable idea where you stand and how you are doing.
regarding fixed costs, you made some good points and great suggestions. again, the main gist would be to make sure, one way or another, you remain cognizant of how much it cost - fixed and variably - for you to do business. it's all well and good if you have a high PF , high W/L ratio, low draw down and so forth, but each month spend $5,000 to make $5,100.
obviously, i'm not suggesting anyone EVER use business expenses as a reason to put on a trade. just the opposite; i think traders should be fully aware what it takes for them to do business and whether or not they truly have a realistic chance to turn trading into a viable, income-producing career BEFORE the market opens. as time progresses and my eductation advances, i become more and more sold on the idea that there is very little work that should be going on during the trading day. prepare. execute. analyze. repeat. notice the absence of 'think' and 'hope' and 'wish'.
as always, thank you for your insight and contribution.
quote:
Originally posted by omni72
...if i gave you $.50 and you gave me $1.00 i would have a 1.0 PF because my profit equals 100% of my cost. to me break even would be i give you $1.00 and you give me $1.00 producing a PF of zero...
I was about to rip you apart again and then I went back and discovered that you are 100% correct and your initial calculations were good
Apologies for trying to be misleading.
I like the idea of this Profit Factor business. Very simple math and idea but powerful nonetheless.
quote:
I was about to rip you apart again ...
wow even after i gave out warm fuzzies??? for FREE?? man, where's the love? j/k
quote:
Apologies for trying to be misleading.
no worries in fact, it prompted me to review my own understanding and presentation of the concept. made me make sure i was delivering the message i wanted to be received. kudos to you!
quote:
I like the idea of this Profit Factor business. Very simple math and idea but powerful nonetheless.
excellent! hope it is useful for you and others. again, i can't take credit for creating it, just sharing it
enjoy!
I started putting together a spreadsheet to allow a plug and see concept of this and these ideas but then I ran out of time so I've shelved it but will hopefully get back to it and we can try some experiments with it.
In fact, this might be an interesting project for Google Spreadsheets. The math is really simple. Are you set-up on Google Spreadsheets?
In fact, this might be an interesting project for Google Spreadsheets. The math is really simple. Are you set-up on Google Spreadsheets?
Okay I've upload my attempt so far (pretty pathetic) onto Google Spreadsheets and sent you and invitation to be able to edit it. Let's see how that works out.
I can also send out invitations to view it so if someone wants to look at it then reply to this posting and I'll add you to the view list.
I can also send out invitations to view it so if someone wants to look at it then reply to this posting and I'll add you to the view list.
quote:
Originally posted by day trading
Okay I've upload my attempt so far (pretty pathetic) onto Google Spreadsheets and sent you and invitation to be able to edit it. Let's see how that works out.
I can also send out invitations to view it so if someone wants to look at it then reply to this posting and I'll add you to the view list.
sounds good. i sent you an alternate email addy to use. i'm slowly migrating using gmail as my primary.
thx for putting together the spreadsheet and sharing it ... you rock!
By the way: To anybody else reading this, I'm not being mean by not sharing the Google Spreadsheet URL with you. I believe that a current limitation of Google Spreadsheets is that they don't give you a URL that you can publish to allow people to look at your spreadsheet. You have to physically invite each person to look at your spreadsheet in either read or write mode.
If a URL becomes available in the future then watch below and I'll post it here.
If a URL becomes available in the future then watch below and I'll post it here.
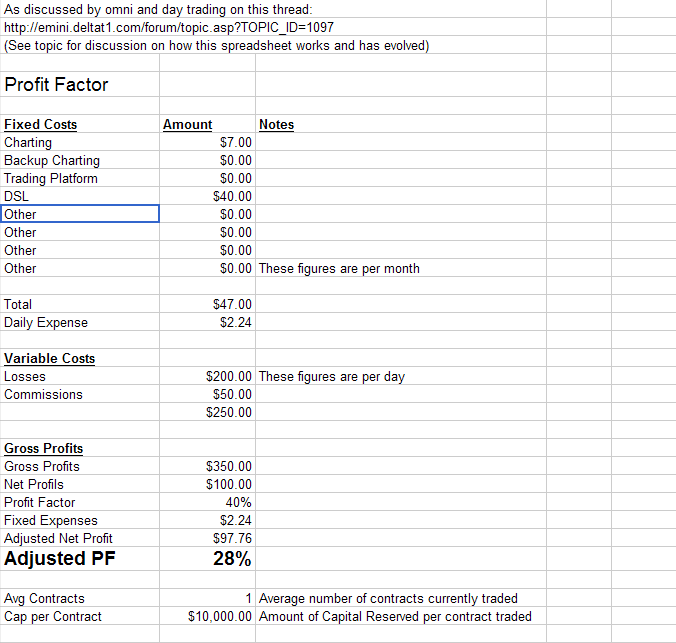
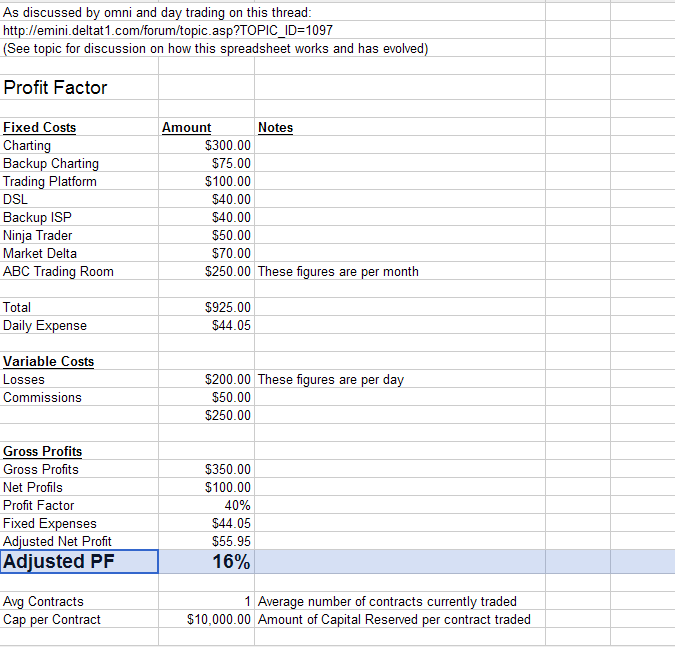
just wanted to give a simple example of how fixed expenses can dramatically affect a trader's business:
Trader A and Trader B use the same broker and trade the same markets, so those fees are nulled out. they trade the same strategy, so we'll assume their P/L and W/L ratio will be nulled out as well (because we are assuming they are psychologically identical ). now we'll look at how the fixed expenses seperates these two traders:
Trader A
Trader B
Trader A outperforms Trader B O/N THE SAME SYSTEM by almost 100% strictly due to his fixed expenses. in 102 days (five trading months), Trader A has a good chance to up his size by one contract. Trader B will have to wait another 70+ days (a total of almost nine months).
anyway, just an illustration of what can happen and how much impact a trader can have by being VERY cognizant of one of the things he has complete and direct control over - fixed costs.
Trader A and Trader B use the same broker and trade the same markets, so those fees are nulled out. they trade the same strategy, so we'll assume their P/L and W/L ratio will be nulled out as well (because we are assuming they are psychologically identical ). now we'll look at how the fixed expenses seperates these two traders:
Trader A
Click image for original size
Trader B
Click image for original size
Trader A outperforms Trader B O/N THE SAME SYSTEM by almost 100% strictly due to his fixed expenses. in 102 days (five trading months), Trader A has a good chance to up his size by one contract. Trader B will have to wait another 70+ days (a total of almost nine months).
anyway, just an illustration of what can happen and how much impact a trader can have by being VERY cognizant of one of the things he has complete and direct control over - fixed costs.
Interesting figures omni. I think that you duplicated Ninja with Trading Platform because they are the same thing... not?
But I get your point about how much a trader can rack up in fixed costs. I think that this lacks context because traders who are racking up those sorts of costs aren't trading 1 contract, they are trading many more than that and so I think that the fixed costs are probably in the same ratio to profits through the spectrum.
But I get your point about how much a trader can rack up in fixed costs. I think that this lacks context because traders who are racking up those sorts of costs aren't trading 1 contract, they are trading many more than that and so I think that the fixed costs are probably in the same ratio to profits through the spectrum.
quote:
Originally posted by zarni
quote:
Originally posted by omni72
quote:
Originally posted by day trading
From those calculations it looks like a figure of 1.0 or 100% is a bit misleading because if I've understood it correctly then that sort of figure would mean break-even. 100% usually means that you made twice as much as you lost.
though i am not one to advocate 'fuzzy math' , this may come down to a matter of mathematical semantics. in my mind, if i want to know how much it will cost to make a buck ($1) and i give you $.25 and you give me $1.00, i had a 3.0 PF because my profit equals three times what it cost me to make that profit. if i gave you $.50 and you gave me $1.00 i would have a 1.0 PF because my profit equals 100% of my cost. to me break even would be i give you $1.00 and you give me $1.00 producing a PF of zero. and if that happened, i'd stop doing business with you cuz yer no fun [:P]
i apologize if all i did was restate my original thought - i wasn't trying to create a circular argument . i think we can both be right (warm fuzzies for everybody!!), because i think the most important point is to find some measure or metric that lets you the trader have an ongoing and easily obtainable idea where you stand and how you are doing.
regarding fixed costs, you made some good points and great suggestions. again, the main gist would be to make sure, one way or another, you remain cognizant of how much it cost - fixed and variably - for you to do business. it's all well and good if you have a high PF , high W/L ratio, low draw down and so forth, but each month spend $5,000 to make $5,100.
obviously, i'm not suggesting anyone EVER use business expenses as a reason to put on a trade. just the opposite; i think traders should be fully aware what it takes for them to do business and whether or not they truly have a realistic chance to turn trading into a viable, income-producing career BEFORE the market opens. as time progresses and my eductation advances, i become more and more sold on the idea that there is very little work that should be going on during the trading day. prepare. execute. analyze. repeat. notice the absence of 'think' and 'hope' and 'wish'.
as always, thank you for your insight and contribution.
Actually PF of 1 is breakeven. Anything less is a loss.
we've already adressed it, but a profit factor of 1 is not breakeven. if you spend $1 to make $2, then you have a PF of 1:
net profit: $1
gross loss: $1
PF: 1.0
that is clearly not breakeven. that is 100% profit or a PF of 1.0
Emini Day Trading /
Daily Notes /
Forecast /
Economic Events /
Search /
Terms and Conditions /
Disclaimer /
Books /
Online Books /
Site Map /
Contact /
Privacy Policy /
Links /
About /
Day Trading Forum /
Investment Calculators /
Pivot Point Calculator /
Market Profile Generator /
Fibonacci Calculator /
Mailing List /
Advertise Here /
Articles /
Financial Terms /
Brokers /
Software /
Holidays /
Stock Split Calendar /
Mortgage Calculator /
Donate
Copyright © 2004-2023, MyPivots. All rights reserved.
Copyright © 2004-2023, MyPivots. All rights reserved.