Bid Ask Indicator
I would like to start a thread and post some ways I am using the bid/ask indicator I actually bought from Guy, I used to have a different way of charting this, but this is just easier.
I will explain the indicator, my techniques, it's benefits,and it's problems........
I will explain the indicator, my techniques, it's benefits,and it's problems........
Guy,
Thanks for fixing the charts. As far as you question
" was just reading a comment in the pitbull thread about Single Prints and that made me think of this indicator as a confirming indicator for the Single Print strategy. You may have read my 3 months of forward testing with the Single Print strategy in the Market Profile Strategies forum. This strategy proved profitable (if I recall correctly) over the 3 months that it was forward tested. During testing I used this in isolation and I am wondering if this indicator would filter out some of the losing traders.
So my question to you is: Have you used this with the Single Prints like you use it with the VAH and VAL? "
I would say that any level that you feel will be support/resistance is a place to use this.....I watch the VA hi/lo from the previous day, previous hi/lo/close, and overnight hi/lo. If the market appears to be trending I will look at a moving average or look for support resistace areas that occurred the last time the market was in this price area. There are tons of other ways to find levels... range extensions,pivots, more advanced market profile techniques, etc. There is only so much stuff when can watch, and my "numbers" are usually pretty good. Ofcourse, I sometimes miss important turns that I am sure somebody watching a different set of numbers might be able to identify, but that's trading. I think that any level that you think might either hold, or more importantly provide some "action" is a valid place to look for setups with this indicator. I will try thr single print idea going forward as I have it in the software. I am getting a single print indicated at 1432.75 on the ES from 12/21.....so if that is correct, I will watch that level to see what happpens......
pt_emini.....
You know, I really wish it was that easy, that is what I had been hoping for, but I don't think it is. I think you need to spend some time watching the indicator live and see what you think....I am not in Guy's marketing group by the way....:-)
You will see these divergences sometimes, but othertimes they might not be that clear, perhaps the amount of contracts required might give clearer signals......there is one way to use this that is a little more defined then in my original charts, that using a divergence type idea............I will try to follow up with that
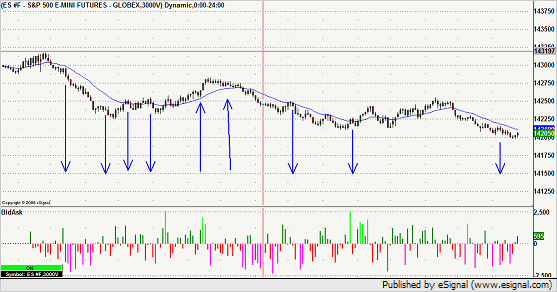
Here is an idea that works OK, but can cause you to miss some moves and possibly get in late, all in all it is pretty good though.....it uses the trend idea combined with divergences (hopefully you can see this clearly......I can't draw the arrows from the price window to the indicator window......anyway....you have a defined trend.....you are free to define this trend however you like, but let's say we have a down trend, we assume the bid/ask indicator will be negative as sellers are selling at the market and pushing the bids lower.....the indicator is red, for some reason buyers come into the market and this causes prices to bounce we now have a pullback in a downtrend.....here is the setup, the highest bar must be a reversal bar, meaning we see a few green bars and the the bars start turning red again and closing in their lower ranges (this in itself could be a sell signal) what we want to see is on the bid ask indicator is the the buyers are drying up completely, so on that highest bar of the retracement, the bid/ask goes negative again.....we try to enter when we see that last bar close in this case red and the indicator is red again..., this can be trick in a fast market, but it works, you might want to apply other filters as well, has the trend become extended, is the trend weakening, is the market approaching support?
Obviously sells are reversed.....this is a good concept, but you sometimes don't get a complete signal and actually in certain market conditions you will miss some of the better pullbacks....however, it is more defined.
These are good signals a lot of of times in the early morning, particularly if the market is breaking one way or the other on news or reports.
Click image for original size
massive typos sorry, doing two things at once......does this make sense....let me know if you want a larger chart posted
pem06081971 - thanks for your reply
Just want to make sure I understand your last setup, the divergence signal is:
In an uptrend price retraces pulling the bid/ask indicator below zero, price makes a new low in the retracement but the bid/ask diverges and pops above zero.
Just want to make sure I understand your last setup, the divergence signal is:
In an uptrend price retraces pulling the bid/ask indicator below zero, price makes a new low in the retracement but the bid/ask diverges and pops above zero.
pretty much, but I would also like to see the price bar close positive as well, meaning the bar that printed the lowest price should reverse and close near or on it's highs, as the indicator also it now closing back in positive territory.....not sure you need to be that exact about it to be honest, but that is the set up..............
pem06081971: By talking about the color of the bar/candle when it closes you've given me an idea although this is not about the strategy but just trying to make the changes/nuances in the market easier to see with the naked eye.
I personally don't care much for a red or green candle or how many are in a row. If a trend is in place I can see that. For this reason I often have all the bars in the same day colored the same color and I use a bar chart instead of a candle chart.
So my idea is to take the colors from the indicator at the bottom (i.e. the Bid/Ask indicator) and place them on the chart itself so that the bars take up those 4 colors indicating whether that bar is made up mostly of trades hitting the bid/ask and/or hitting the bid/ask excessively.
What do you think?
quote:
Originally posted by day trading
pem06081971:
I personally don't care much for a red or green candle or how many are in a row. If a trend is in place I can see that. For this reason I often have all the bars in the same day colored the same color and I use a bar chart instead of a candle chart.
What do you think?
day trading you say >>"If a trend is in place I can see that". were do you see that and their is an specific indicator you use?
quote:
Originally posted by inventor
day trading you say >>"If a trend is in place I can see that". were do you see that and their is an specific indicator you use?
I'm talking from a purely visual point of view. If the market is going up then I don't need 5 green candles in a row to tell me that. I can see higher highs and higher lows etc.
The color of a candle is sometimes arbitrary. If the market is moving sideways then you might get (say) 5 green candles in a row on a 3 minute chart. Now if you were to re-chart that 3 minute chart and instead of ending each candle on the minute you end it on the half minute such that you still have a 3 minute chart but this time you could have 5 red candles in a row.
It's the same set of data but because or the arbitrary point at which a new candle started it has made it a certain color. For some people that color may help in understanding the market but I feel that it is important to understand that it is chance in time that can make it one color or the other.
Daytrading,
I think your idea is fine......would be interested in taking a look at that. I guess the point I was making, and I may have made it sound too absolute, was that I was hoping to see the price weakening (assume we are talking about a pullback in a downtrend) a little as well, the bid/ask indicator does a good job, but I was hoping to see some sort of indication in the actual price that the pullback was just about over.......I am thinking of this in terms of the actual price bar is telling us what where the price has been and where it is now, the bid/ask indicator is kind of an xray into the bar telling us a little more about what happened "inside it"....is that a fair statement? I agree getting caught up in the color is not necessary, but I am thinking of this in terms of reading price and AND the actual order flow....I am actually pretty sure you could trade successfully just following certain setups on these volume bars....the bid/ask indicator provides a really nice edge though that you don't have when just looking at price......that's my thinking.....
I think your idea is fine......would be interested in taking a look at that. I guess the point I was making, and I may have made it sound too absolute, was that I was hoping to see the price weakening (assume we are talking about a pullback in a downtrend) a little as well, the bid/ask indicator does a good job, but I was hoping to see some sort of indication in the actual price that the pullback was just about over.......I am thinking of this in terms of the actual price bar is telling us what where the price has been and where it is now, the bid/ask indicator is kind of an xray into the bar telling us a little more about what happened "inside it"....is that a fair statement? I agree getting caught up in the color is not necessary, but I am thinking of this in terms of reading price and AND the actual order flow....I am actually pretty sure you could trade successfully just following certain setups on these volume bars....the bid/ask indicator provides a really nice edge though that you don't have when just looking at price......that's my thinking.....
Yes ..more charts please...I'm still digesting this stuff...thanks
Bruce
Bruce
Emini Day Trading /
Daily Notes /
Forecast /
Economic Events /
Search /
Terms and Conditions /
Disclaimer /
Books /
Online Books /
Site Map /
Contact /
Privacy Policy /
Links /
About /
Day Trading Forum /
Investment Calculators /
Pivot Point Calculator /
Market Profile Generator /
Fibonacci Calculator /
Mailing List /
Advertise Here /
Articles /
Financial Terms /
Brokers /
Software /
Holidays /
Stock Split Calendar /
Mortgage Calculator /
Donate
Copyright © 2004-2023, MyPivots. All rights reserved.
Copyright © 2004-2023, MyPivots. All rights reserved.