High volume numbers
Here they are from Fridays (11-14-08) trading. Some match up with the Value area numbers. Good targets and fade points.
874 - 876 Minor volume
891 - 893.50
901- 902.50 Minor
910 - 912.50
Bruce
874 - 876 Minor volume
891 - 893.50
901- 902.50 Minor
910 - 912.50
Bruce
Bruce I'm not sure if you are wanting more than this or not. The data box shows the up/down volume.
Click image for original size
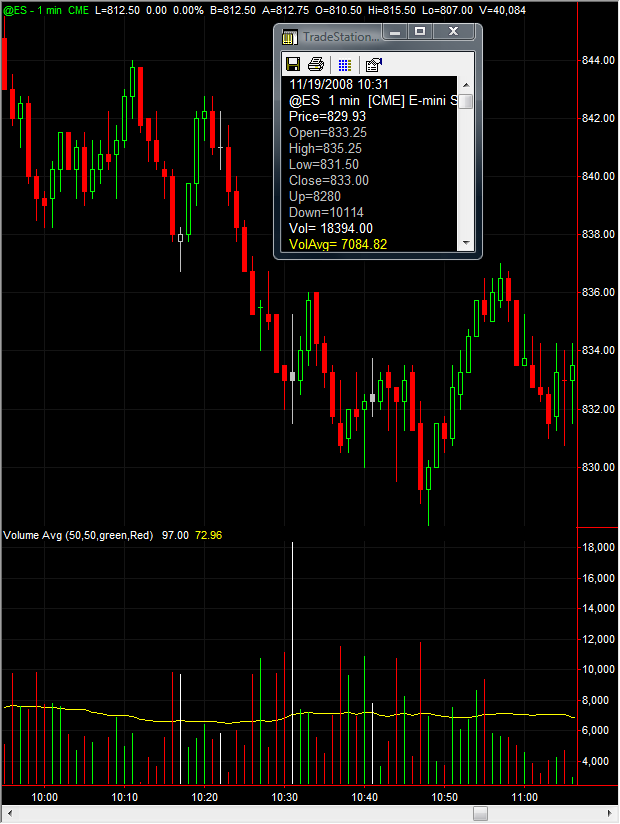
Thanks so much. To be honest I am not sure what would make these volume thrusts easier to decipher. Knowing that there was more volume selling than buying seems to be a great obvious indication. I can't get that with my el-cheapo Ib data.
On the data you are showing VO are we to assume that there are more sellers than buyers because the Down volume reading is higher? This may seem like a simplistic idea to some but how do the volume numbers you show relate to bid/ask info? That may be a seperate piece of information that may be useful
In other words is the fact that we have a higher down volume reading mean that there was more volume on the ask? This may be fundamental to some but I'm not beyond admitting that I don't have a clue in this area...... thanks for the help here
Bruce
Bruce that is my understanding, because for every seller there is a buyer right...so the difference would be the bid/ask. Here is another chart with 10,000 volume bars. Although it wont match with a 1m chart the 2 candles @ the 10:30 are marked with arrows.
Click image for original size
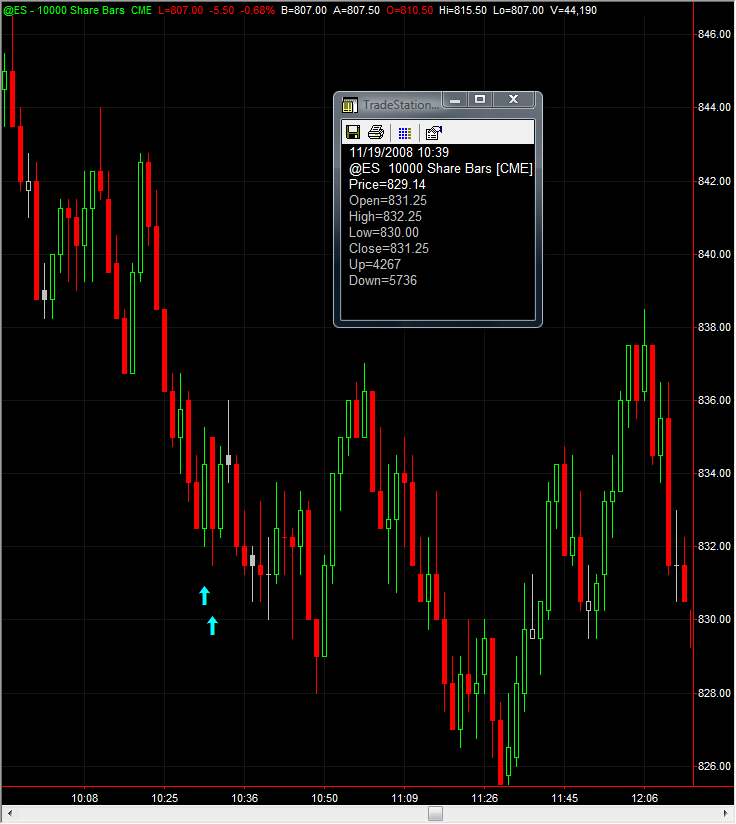
the data box should be correct on this one. Sorry for the confusion.
Click image for original size
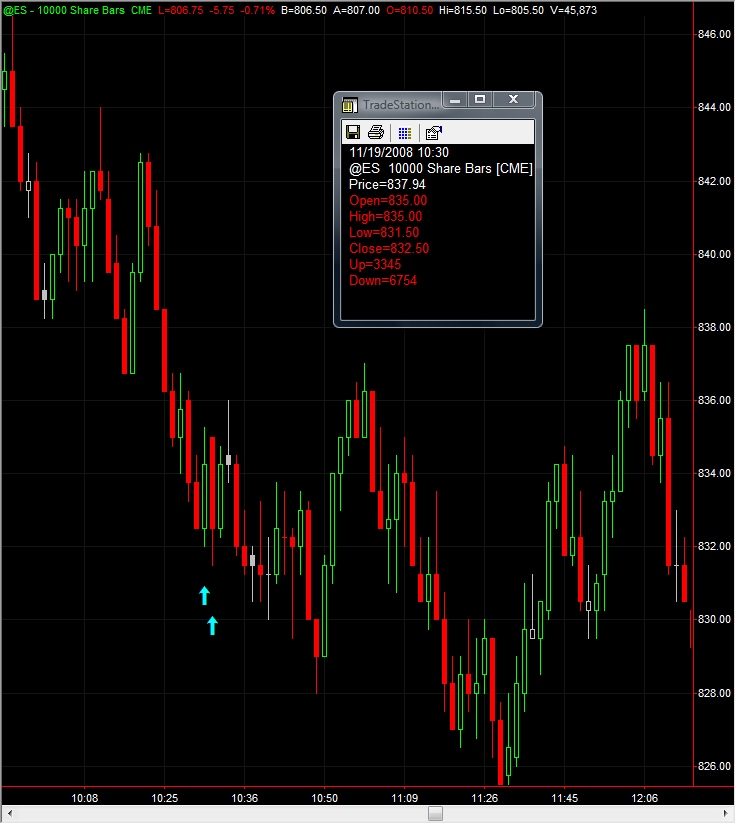
Bruce I would have to conclude that level was a area of distribution
quote:
Originally posted by BruceM
I'd appreciate it if someone who has data on bid/ask etc could analyze the 11:30 E.S.T one minute bar and tell me if there is any information you can derive from that bar...in other words can you tell if there was heavy selling or buying etc......interesting bar as the close was at the open
Bruce,
Here is what my BAV showed around 11:30 ET. I am on CT so I have zeroed in on the 10:30 area. From this it looks like the net trade at 10:30 was relatively balanced in terms of net volume on the bid vs. ask. The white BAV line is my estimation of big money action (net trade lot sizes of 50 or more contracts on the bid (sell) or ask (buy) while the brown line is small money. Bigs had been distributing into the 10:30 time frame, bought a little after it and then resumed distributing. Something else to keep an eye on is that it seems that program trades seemm to happen on and around the top and bottom of the hour. I frequently see trade volume spikes (and a little more volatility) then, fwiw.
Click image for original size
thanks so much to both of you.
It's 1:25 and the high volume area so far created with todays trade are 785.50 - 88.50 and 796 - 803......that's a big one...I think the 903 is a good number because another high volume bar came out of there..secondary minor one sits at 812-816
It will be interesting to see how the Value area numbers place later on...
The market didn't stop at the va low today but nailed the high volume zone perfectly////ok, bragging is over
edit:
should be 85.50 - 90 as the other zone...
Should be 803 up there, not 903
this what I have:
812 - 816
796-803----
these two are close together
85-90-----
71-75
54-59
crazy days....these may come into play for friday...I'll be interested to see where value comes in at
Bruce
812 - 816
796-803----
these two are close together
85-90-----
71-75
54-59
crazy days....these may come into play for friday...I'll be interested to see where value comes in at
Bruce
A few brief comments: I believe it easier to work from the volume areas that are created from the previous days trading just like you would use any other form of support or resistance. It can be very tricky trying to figure out the volume areas as they unfold on some days. You basically want to see if price is being accepted above or below a high volume zone and then trade in that direction. Some will find price action entries easier on the stomach and the wallet.
Volume can also deceive you. Today I was sure I had all the key zones outlined but the huge selloff at the end of the day created additional zones ( with higher volume). Just some things to think about. I hope the market settles soon. As most know I have core positions in my "darlings" thread that are taking a real beating. I'm getting bored and frustrated with the market from a longer term perspective so I assume others are feeling similar things if not worse things.
At this point nobody will believe it when the low finally comes including me.
Luckily I have day trading to fall back on. That sounds strange....
Good trading.
Bruce
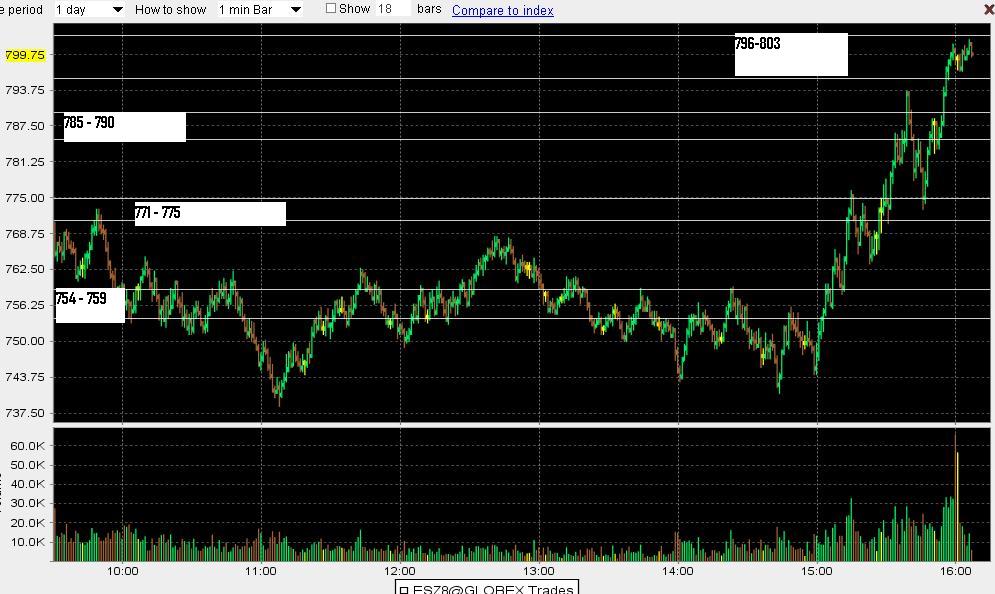
here is a fairly crude S&P chart from a few minutes ago showing the day session only.....I have the high Volume bar zones from yesterday defined on the chart. This is a one minute chart but you can see a few things:
a)How they are attractors of price
b) How they can act like support and/or resistance and reverse polarity
c) How they are not perfect by any means
The hardest part from the volume zones posted today was that we had two big zones fairly close together...the 785 - 790 area and the 796 - 803 we couldn't penetrate the 803 number and we sold off back down to 790 just before the close ( this may not be shown on my chart)
Click image for original size
Emini Day Trading /
Daily Notes /
Forecast /
Economic Events /
Search /
Terms and Conditions /
Disclaimer /
Books /
Online Books /
Site Map /
Contact /
Privacy Policy /
Links /
About /
Day Trading Forum /
Investment Calculators /
Pivot Point Calculator /
Market Profile Generator /
Fibonacci Calculator /
Mailing List /
Advertise Here /
Articles /
Financial Terms /
Brokers /
Software /
Holidays /
Stock Split Calendar /
Mortgage Calculator /
Donate
Copyright © 2004-2023, MyPivots. All rights reserved.
Copyright © 2004-2023, MyPivots. All rights reserved.