Price Support Resistance
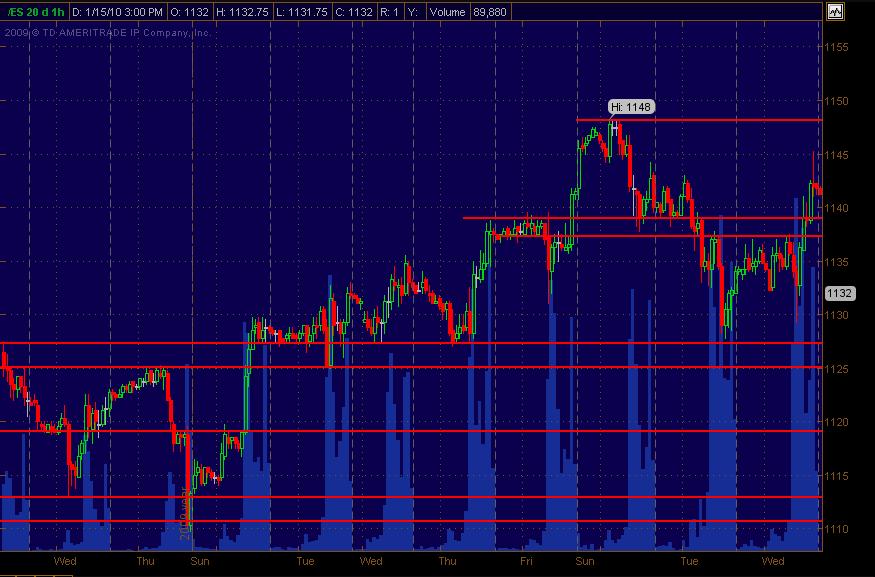
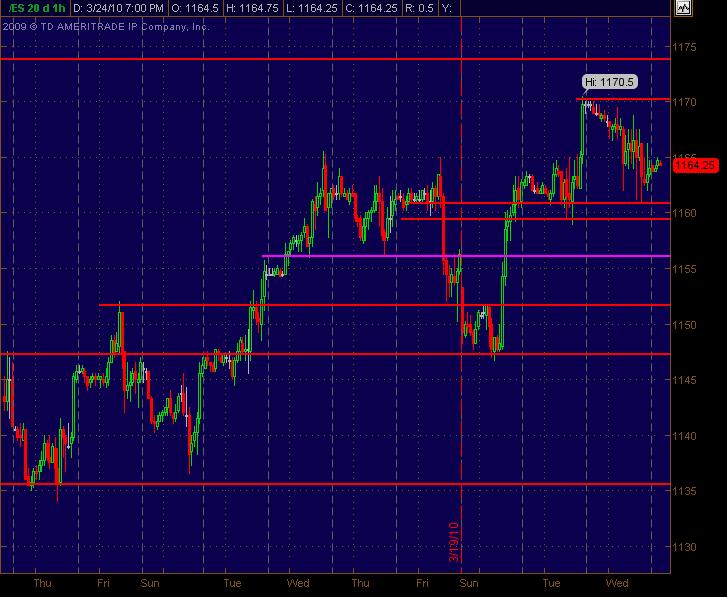
Main focus is currently on stock trades but always following the ES among other things for market analysis. I always draw in S/R lines on the ES. The first chart is what I drew in as of Wednesday's close. Simply eyeballed it and drew in the red horizontal lines. If 2 lines are within a couple of points of each other I view that as a "zone." And all S/R lines are in effect a tiny zone give or take a couple ticks.
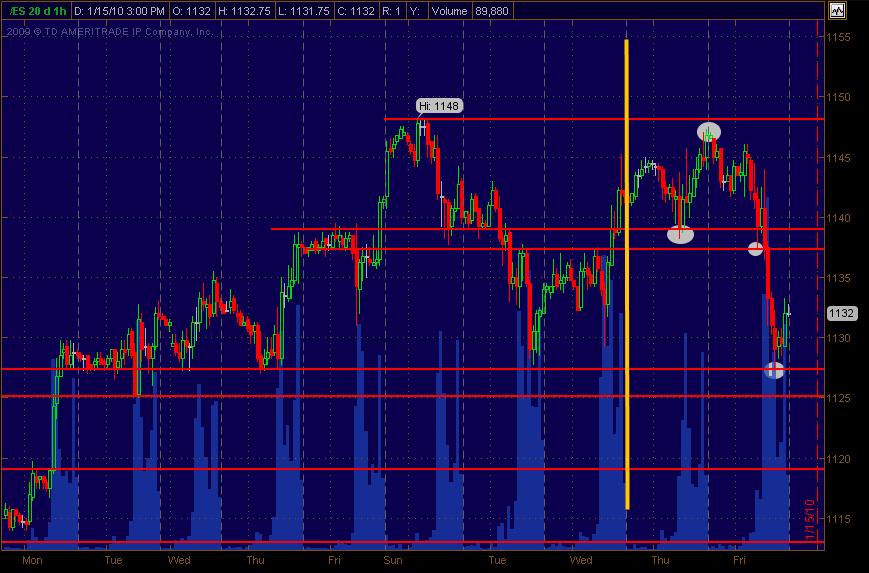
At the close Friday I nabbed another screenshot of the same chart where I'd drawn a vertical yellow line at Wednesday's close so that the following 2 trading days can be seen. It's an hourly chart. I circled in white the price swings where they react off of these areas of price S/R.
Just tossing this out since I see this all the time and could be incorporated or folded in to so many other strategeries or trading analysis and styles.
Would like to hear and see how others employ what I call PASR lines ... Price Action Support Resistance ... in their own trading with as much specificity and any xtra info. This sh@t's been around since before Dinosaurs and the Big Bang ... but thought it might be interesting to explore ideas of how it's effectively employed in the current market. Hope that makes sense.
The following 2 days of price action after Wednesday's S/R lines drawn.
At the close Friday I nabbed another screenshot of the same chart where I'd drawn a vertical yellow line at Wednesday's close so that the following 2 trading days can be seen. It's an hourly chart. I circled in white the price swings where they react off of these areas of price S/R.
Just tossing this out since I see this all the time and could be incorporated or folded in to so many other strategeries or trading analysis and styles.
Would like to hear and see how others employ what I call PASR lines ... Price Action Support Resistance ... in their own trading with as much specificity and any xtra info. This sh@t's been around since before Dinosaurs and the Big Bang ... but thought it might be interesting to explore ideas of how it's effectively employed in the current market. Hope that makes sense.
Click image for original size
The following 2 days of price action after Wednesday's S/R lines drawn.
Click image for original size
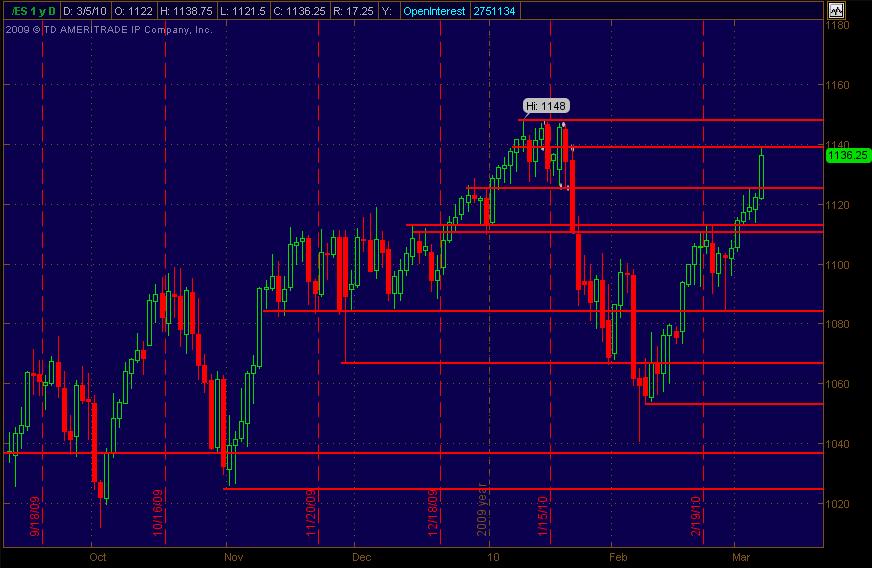
Thanks Phileo for the analysis! Posting an ES Daily updated chart with S/R lines. Obviously there's more to work with below the current market, but have the 1148 high from Jan as next significant potential resistance (as if it takes a "nookyooler" scientist to figger that 'un out).
Click image for original size
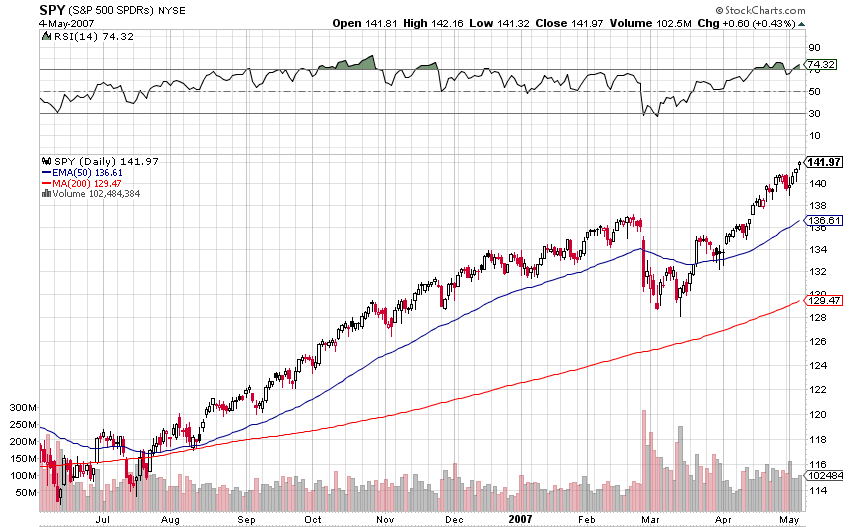
Here is the closest comparison that I keep referring to:
I keep comparing Feb/07 to now because they both have similar big moves down which ended with a hammer reversal.
If we extrapolate the above chart to today's market, I'd say a gap up over 1147 would make it no-brainer crystal clear bullish. Beyond that, you could see the market was indecisive as the potential double top resistance level was approached.
I'm not expecting Monday to be decision day - this should take a few days, if not weeks to play out.
Click image for original size
I keep comparing Feb/07 to now because they both have similar big moves down which ended with a hammer reversal.
If we extrapolate the above chart to today's market, I'd say a gap up over 1147 would make it no-brainer crystal clear bullish. Beyond that, you could see the market was indecisive as the potential double top resistance level was approached.
I'm not expecting Monday to be decision day - this should take a few days, if not weeks to play out.
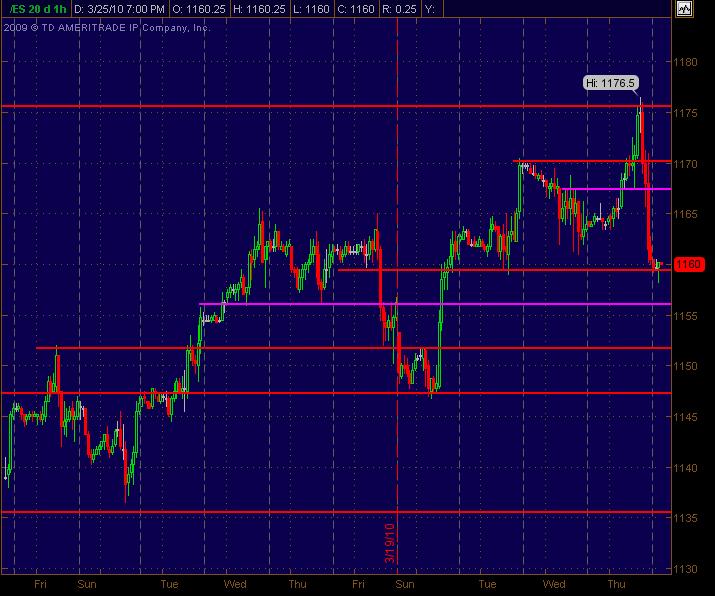
Price action S/R levels that I'm seeing on the ES 1-hour chart coming into 3-25-10. Below the current market are 2 Red lines close together which for me function as more of a "zone" of a few ticks above and below 1160. Also, the Magenta line is a more minor (weaker?) potential support level.
Anyway, always looking for any and all feedback and additional analysis coming into tomorrow's trading day.
Anyway, always looking for any and all feedback and additional analysis coming into tomorrow's trading day.
Click image for original size
Also, I went thru a tad over 1000 daily stock charts eyeballing 'em and didn't see much in the way of how it would typically look for "good" longs. Feels mixed (not necessarily short). I'd gone thru them with the idea of posting a few long picks for equities ... and ended up uncomfortable with what I saw drilling down and thru the mkt fwiw. Maybe it means some sloppy trading for the next day or few ... dunno, just anuddah 2 cents from me.
Here's what I've got for Friday 3-26-10 as Price Action S/R levels. Yesterday was a bit whacky ... which, when reviewing stock charts, looked like Thursday was gonna be sloppy. But Thursday gapped up on the open, held, then ran to new highs ... and then rolled over and sold down pretty hard. There were some good and tradable decent moves ... but ended up kinda weird and "sloppy" by the end of the session. Then again, Friday's got several significant reports/numbers coming out. Anyway, here's my skeletal map for coming into Friday. As always, any feedback and additional analysis (pro and/or con) is encouraged and welcome! Magenta lines are "less significant" S/R levels.
Click image for original size
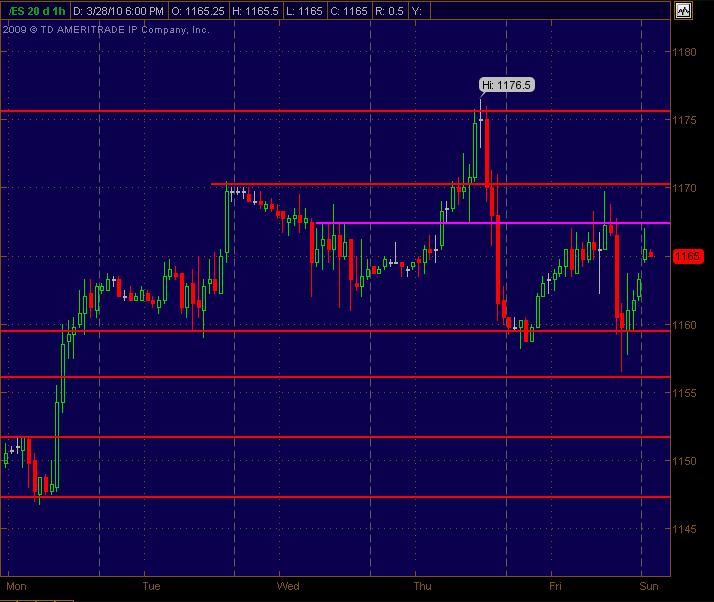
Here's an update of Price Action S/R levels for the ES coming into Monday 3-29-10. I looked at a bunch of daily equity charts and really wasn't turned on for many longs (or shorts) ... mixed. That's what I've seen the past few days fwiw. And the SP has been "sloppy" trading back and forth intraday for the past few sessions. (even though there have been some decent moves for trades).
Anyway, it still looks choppy (at least to me) now after such a strong and grinding run up the past few weeks ... even on low volatility. Hope this helps as a roadmap with some ideas. As always, open to any and all analysis and feedback.
Anyway, it still looks choppy (at least to me) now after such a strong and grinding run up the past few weeks ... even on low volatility. Hope this helps as a roadmap with some ideas. As always, open to any and all analysis and feedback.
Click image for original size
Emini Day Trading /
Daily Notes /
Forecast /
Economic Events /
Search /
Terms and Conditions /
Disclaimer /
Books /
Online Books /
Site Map /
Contact /
Privacy Policy /
Links /
About /
Day Trading Forum /
Investment Calculators /
Pivot Point Calculator /
Market Profile Generator /
Fibonacci Calculator /
Mailing List /
Advertise Here /
Articles /
Financial Terms /
Brokers /
Software /
Holidays /
Stock Split Calendar /
Mortgage Calculator /
Donate
Copyright © 2004-2023, MyPivots. All rights reserved.
Copyright © 2004-2023, MyPivots. All rights reserved.