ES Short Term Trading 5-4-10
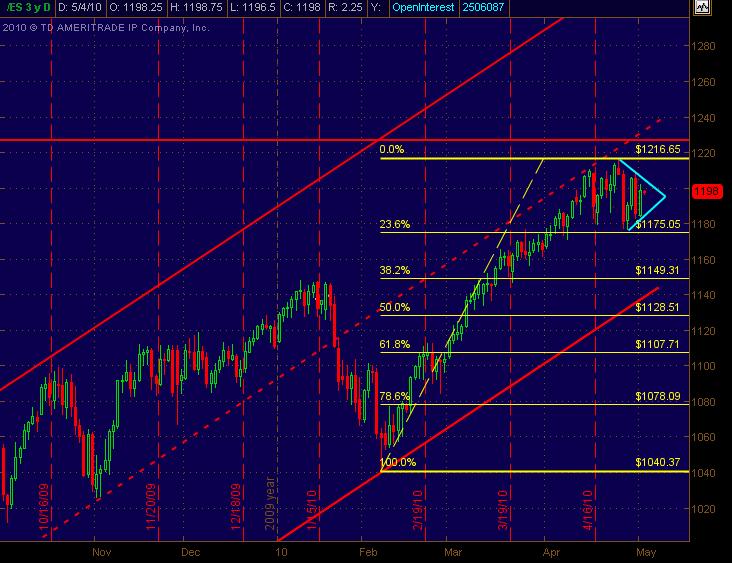
I'm still trying to get used to Thinkorswim, but here's a basic big pic overview of the Daily ES chart. Have the the trend channel and also included Fib Retracement levels though I don't typically use them much ... but nice to know where they are. And Kool and others have referenced the sideways pattern that I've thrown Cyan lines on as a pennant type formation ... even though it's not so much price swings creating it as it is the volatility increase and Wider Range trading sessions of overlapping bars. Hope this is helpful.
Click image for original size
Here's my whacked-out Monkey take on PASR levels using a 30min chart. The Red are potentially significant while the Magenta could be considered semi-significant. Took into account RTH and all trading hours on multiple time frames for drawing these in. Made adjustments on about 4 levels and killing off one level from yday's S/R chart. The dashed Cyan lines are the Wkly Standard Pivots. Again, hope this, as a map, is useful to some folks!
Click image for original size
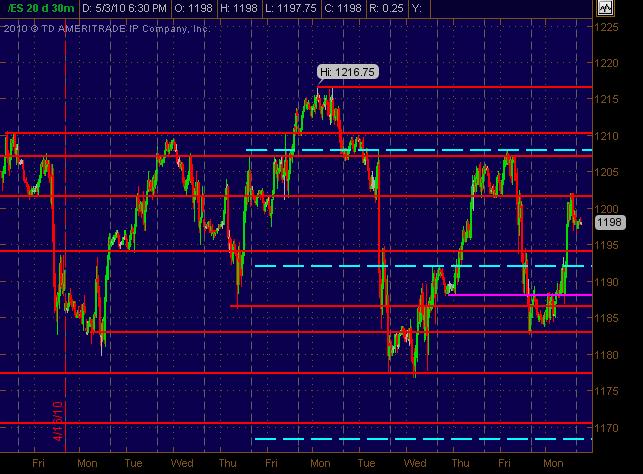
Just an addendum ... 87 and 95 are the Daily Pivots which line up near to a couple of potential S/R zones drawn in on the chart.
Also, blew through (eyeballing) some daily charts of the Dow 30 plus another 500 other equity charts ... and the majority have decent uptrends and also a lot of basic bullish patterns and price action over the past few days and weeks fwiw.
Btw,some really good analysis premkt and throughout the day today (Monday) by Kool, Phileo, Bruce, ak1(on the opening long trade setup posted on another topic/thread), TraderF and others. Some great mapping, analysis and trading synergy. Any and all who have hesitated posting their own analysis, I'd encourage to do so. This is probably one of the best daily places/topics/threads to not only trade off of, but also learn from a variety of different approaches to the market! Hope all trade as well or better on Tuesday!!
Originally posted by MonkeyMeat
I'm still trying to get used to Thinkorswim, but here's a basic big pic overview of the Daily ES chart. Have the the trend channel and also included Fib Retracement levels though I don't typically use them much ... but nice to know where they are. And Kool and others have referenced the sideways pattern that I've thrown Cyan lines on as a pennant type formation ... even though it's not so much price swings creating it as it is the volatility increase and Wider Range trading sessions of overlapping bars. Hope this is helpful.
Click image for original size
Hi MM, if you mirror that cyan sticks vertically along that big red candle, you can see what it looks like a bearish 'diamond' formation.
Today's RTH day candle is a Narrow Range Inside Day. Also, there was a short covering during the second half of the day. I expect the next big move on the daily timeframe will be on the downside.
Hello everyone.
MM, thanks for the charts and comments. I notice that you mentioned the diamond formation in the daily. In 2007 the DJ monthly had the same diamond formation. Diamond formations are rare, and they usually indicate a top. After they unfold, well you know what happens. But, I will not jump the gun just yet. In the 240m. chart, you can see that the ES has retrace 78% of the presiding move. Right now, we are at the top of the 78% ret. If the ES was to move above today's high then, I think it will challenge the 1216.75 high and move to test the 1.272% at 1219.50., Moving above that, then the 1227.00.
In the down side, if it was to move below today's low, then the next support is the 1176.00 and below that 1169, 1161, 1156.
Will see how this plays out in the next couple days. Interesting times in from of us.
In due time the market will show us the way.
I will try to participate a bit more, you guys are fantastic! Thanks for all you comments and charts.
Very little trade above at 93. area and 95 so longs down here at 91.25 is the prefered direction....may need to add as we have matching lows at the bottom which they like to run....Va low is at 92 and big air pocket should get tested in the 93 - 96 area today but the real concern is thatthey are blowing through that zone like it doesn't exist......
The real point of this post is to wacth that zone ...it should get tested again so shorts below 93 I think are riskier to take for those who are short..does that make sense?
The real point of this post is to wacth that zone ...it should get tested again so shorts below 93 I think are riskier to take for those who are short..does that make sense?
Bruce, could you please identify your matching lows? (24 hour prices, rth only, where, what price?)
Did anyone see anything (headline, earnings report, whatever) that might have coincided with the 7:45am drop out of the consolidtion range in the 5min?
RIght now, I am wondering (sort of expecting) that price (today, RTH) has to fill gap 1187-1185.75 area before rebound.
after reviewing chart from yesterday, biggest mistake I made was not giving more weight (early in RTH) to the fact that price was able to exceed the AH H. RE the price pattern I mentioned yesterday, (I was expecting a return to print within 1 point of the O/N L), in previous pattern (occurred on 4/28/10) Price in RTH was only able to print O/.N H plus 2 ticks and then was brutally and forcefully rejected.
Click image for original size
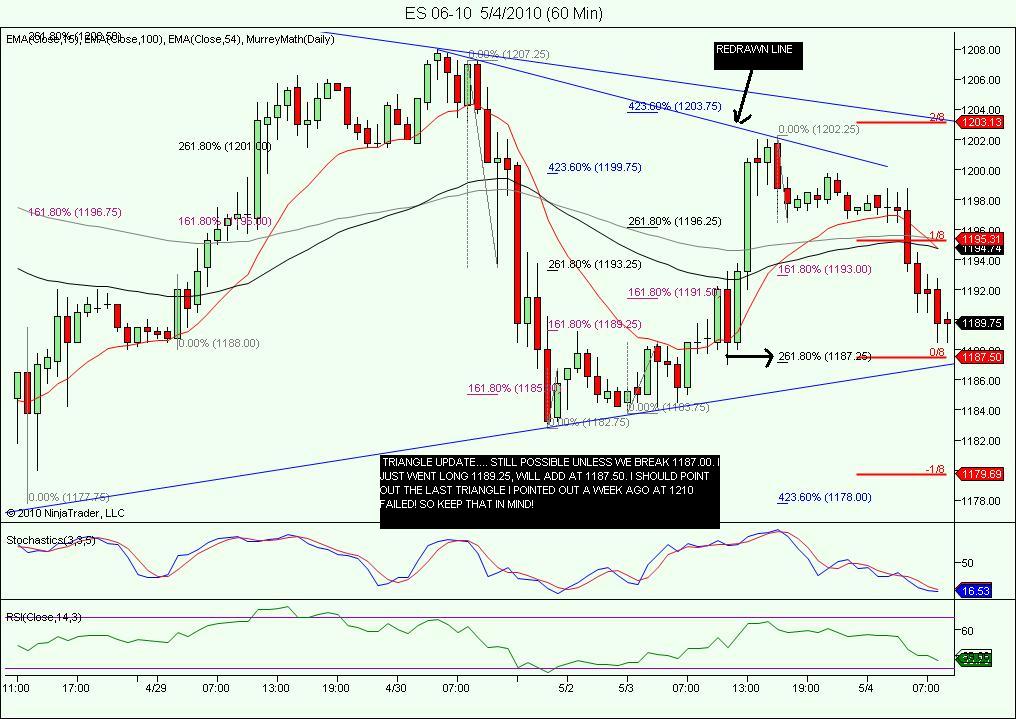
GOING LONG 1187.50: ....
I am going long 1184.25 since is the 261.8% of the fib retracement level.
Bruce I find him to be the most thoughtful, accurate and flexable analyst I have ever seen. His Sat audio updates are complete and concise. He has been calling for March 20 high to be followed by a short correction leading to an Aug 20 high which you better get out of the way. This call is over 6 mos old. New Lows, maybe and lasting for a major cycle.
Emini Day Trading /
Daily Notes /
Forecast /
Economic Events /
Search /
Terms and Conditions /
Disclaimer /
Books /
Online Books /
Site Map /
Contact /
Privacy Policy /
Links /
About /
Day Trading Forum /
Investment Calculators /
Pivot Point Calculator /
Market Profile Generator /
Fibonacci Calculator /
Mailing List /
Advertise Here /
Articles /
Financial Terms /
Brokers /
Software /
Holidays /
Stock Split Calendar /
Mortgage Calculator /
Donate
Copyright © 2004-2023, MyPivots. All rights reserved.
Copyright © 2004-2023, MyPivots. All rights reserved.