ES short term trading 5-19-10
Here we are! The 19th, which my work shows could be a pivotal day! It should come as no surprise that we went all the way down to the number shown on the weekend preview, the 0.786 retracement at 1110.25. It is also the 2.618 projection from the 1147.50 high on the one hourly chart.Also it is the 3 std deviation line on the 13 min vwap. Cycles had us down into today ,then up and down again into the 24th. So its all coming together... or is it? Extreme caution is advised , as today either marks an important low.. or the breakdown of the indexes for a true test of 1090 or even 1056!
best so far is 18.50 and trying to hold 3 for that 12.75 number...strong open...If this is range trade then they will want that 29.50......so keeping it tight
kool,
it's the clusters of price levels that I like to see.
I used to read charts looking only for horizontal S&R.
And, for me, price levels mean more than pivots or extensions (but I use them all, looking for confluences, still, at confluence you still need to have PA indicate possible reversal or extension.
Bruce,
you commented yesterday about the number of consecutive LH and LL in 5min chart. I looked at both, consec LH and LL and upside with HH and HL, just an eyeball of a couple of days (RTH only) and 3 to 4 bars of trend very common, the 4th tending to see some sort of retracement.
BTW that was the case for today's open (on the 5min bars)
too many numbers today...that 22.50 was the low volume from YD...but more importnat was the 8-10 range so quick....I'll be surprised to see a real trend today as too many numbers will confuse us all....so it chops back and forth..let see whatthe test of the O/N high brings
took two more off at 13 even print...only one left and haven't a clue now
flat at 15.75...not sure from here
LOL... NICE TRADE FRIEND .I didnt show it ,but the upper prc band on the hourly was at the same area! Cant really call it a prc trade tho cause it was too far from the projection (1123.75), but had all the other conditions!...Well done
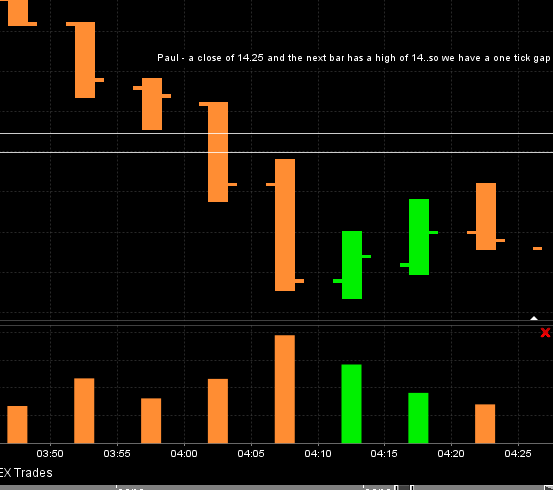
takin a breather...here paul....gap was in the data... look atthe two bars below your name...as with most of my ideas they look for the market to be efficient...gaps are not efficient to me..
Click image for original size
note also on the 5 min chart i posted... the avg's just crossed to a bullish mode, and there are pos. divergencies on the hourly chart.
thanks Kool...this volatility has me a bit jittery too..but trying to get that under control
Paul..notice the ORB (crabel) breakout with high $ticks that failed.....again...!!so we always need to study when they don't fail and what conditions make that fade fail...your NR7 , NR4.. may be two of them..
Paul..notice the ORB (crabel) breakout with high $ticks that failed.....again...!!so we always need to study when they don't fail and what conditions make that fade fail...your NR7 , NR4.. may be two of them..
great trading, Bruce
and thanks for the chart,it was traditional gap, just escaped me.
frustrating today, once again I have underestimated the potential weakness in the markets.
and thanks for the chart,it was traditional gap, just escaped me.
frustrating today, once again I have underestimated the potential weakness in the markets.
Thanks for the feedback johnpr2010. Judging by the number of people that visit the site versus the number that post on the forum (1 to 5%) I'm guessing (and hoping) that there are a lot of other traders out there who are a little bit more profitable today because of the generosity of one of the other traders on this forum.
Emini Day Trading /
Daily Notes /
Forecast /
Economic Events /
Search /
Terms and Conditions /
Disclaimer /
Books /
Online Books /
Site Map /
Contact /
Privacy Policy /
Links /
About /
Day Trading Forum /
Investment Calculators /
Pivot Point Calculator /
Market Profile Generator /
Fibonacci Calculator /
Mailing List /
Advertise Here /
Articles /
Financial Terms /
Brokers /
Software /
Holidays /
Stock Split Calendar /
Mortgage Calculator /
Donate
Copyright © 2004-2023, MyPivots. All rights reserved.
Copyright © 2004-2023, MyPivots. All rights reserved.