ES Short Term Trading 9-1-10
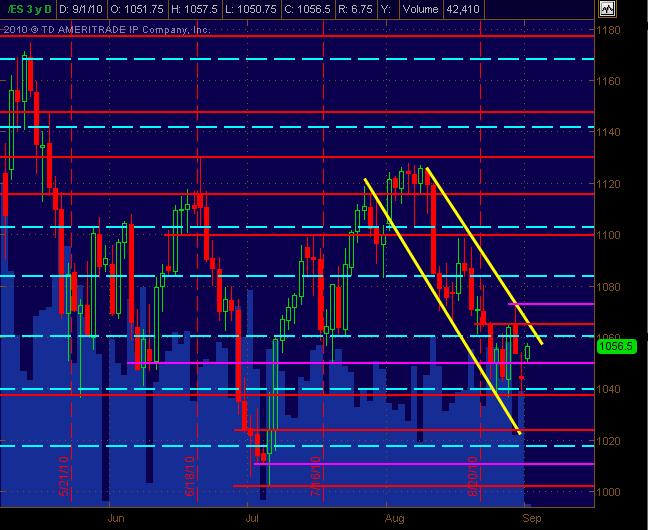
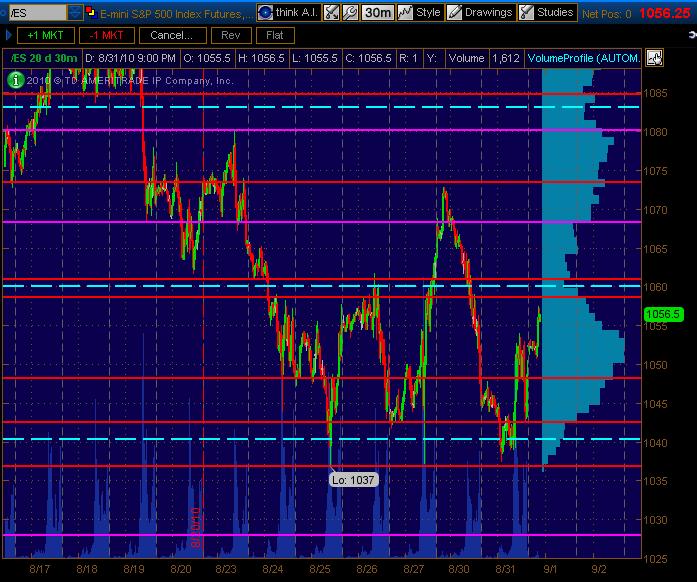
Have a daily and 30min chart with price action S/R levels on both ... Red = potentially significant ... Magenta = potentially semi-significant. The Cyan dashed lines are Wkly Pvt Levels. This is just a map.
Hope this is helpful ... am not liking TOS after a few months of digging around in it ... but this is where the charts are pulled from for now.
The Intermittent Funky Monkey
Click image for original size
Click image for original size
Hope this is helpful ... am not liking TOS after a few months of digging around in it ... but this is where the charts are pulled from for now.
The Intermittent Funky Monkey
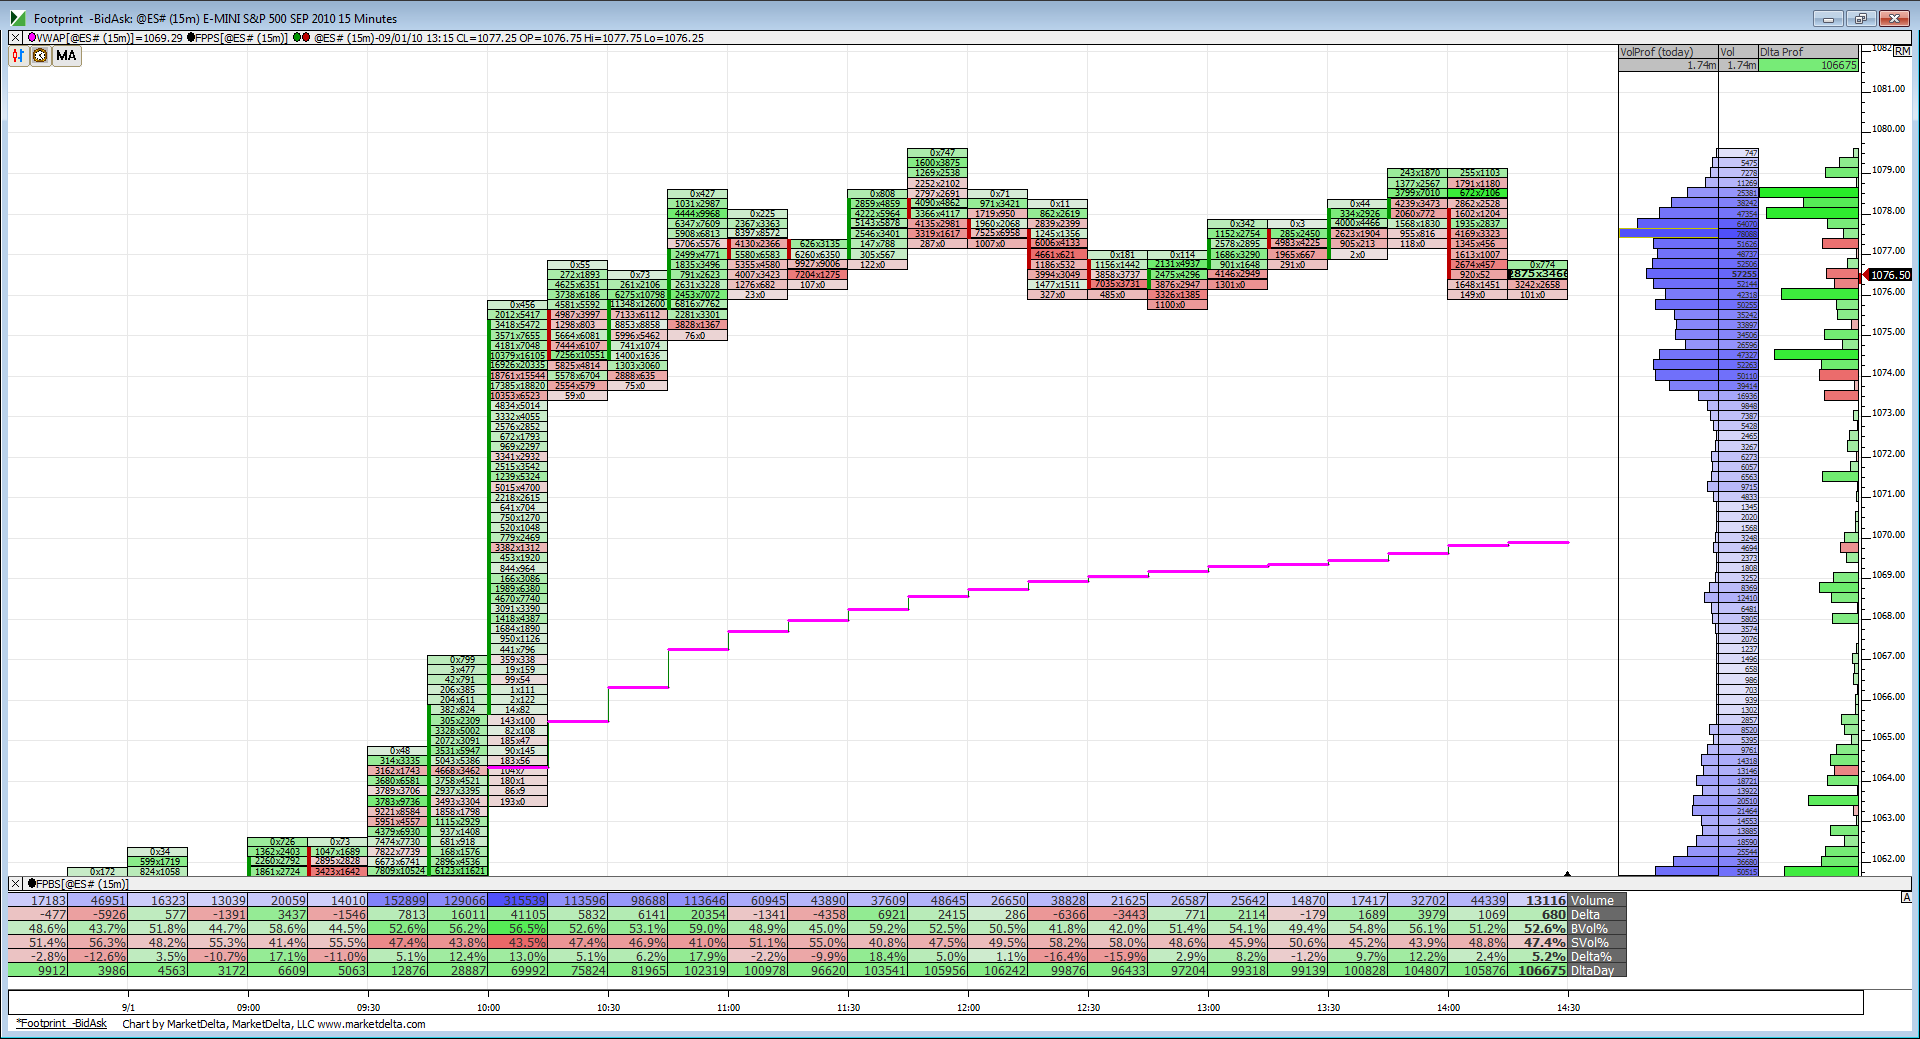
our VWAP king Jerry would be saying that the SKEW is negative because VWAP is below Peak volume of 77.50....so most volume is below 77.50 now...expecting itto trade higher would be the more agressive play I think and higher risk..
If I had to find a negative ( for shorts to win now) it would be that double high of 79 that's trying to form on this 30 minute bar and the one before it
Notice on this recent selling in the 2:15 zone you can actually see delta increase on the bottom of the chart. Perhaps the selling is being absorbed. Or at least that particular bout.
Click image for original size
my vwap is at 73 area lorn..yours is at 70....HMMM....
that looked like sell vol decreased while buying Increased and that increased delta.......still lame with Market delta though
What setting do you have VWAP set to? I know some programs allow different calculations which might be the difference. Also mine is showing continuous contract VWAP. I've always used O/N volume in my trading. Its what I prefer.
Originally posted by BruceM
that looked like sell vol decreased while buying Increased and that increased delta.......still lame with Market delta though
if we weren't on board during the first hour reports then we'd only have a 6 point range.....where is the trend??.
ok Lorn...mine is just today's session without O/N etc...thanks
ES is only one not testing single prints....YET..Nq in there now and YM testing singles now...interesting place
rburns:
The following is my interpretation of Paul9's findings...
On 30-Aug-2010 (Monday):
Hi = 1063.50
Lo = 1044.50
So, range = 1063.50 - 1044.50 = 19.00
So, 0.618 extension from Monday's Hi = 0.618*19.00 + 1063.50 = 1075.00 (rounded down from 1075.242)
Paul9 says that if price hits 1075.00 (as it happened today, i.e., 01-Sep-2010), then there is a high probability that the price will hit 1.000*19.00 + 1063.50 = 1082.50. Today, it did hit 1082.50.
Hope this helps.
Originally posted by rburns
Am I understanding this correctly? Take Mon H and L. Any .61 move off the bottom or top of the days range will produce a 1.61 move either higher or lower than the days range.
Emini Day Trading /
Daily Notes /
Forecast /
Economic Events /
Search /
Terms and Conditions /
Disclaimer /
Books /
Online Books /
Site Map /
Contact /
Privacy Policy /
Links /
About /
Day Trading Forum /
Investment Calculators /
Pivot Point Calculator /
Market Profile Generator /
Fibonacci Calculator /
Mailing List /
Advertise Here /
Articles /
Financial Terms /
Brokers /
Software /
Holidays /
Stock Split Calendar /
Mortgage Calculator /
Donate
Copyright © 2004-2023, MyPivots. All rights reserved.
Copyright © 2004-2023, MyPivots. All rights reserved.